Hale County Alabama Land Cover Map shows a county with a clear north–south contrast. Forest is the largest 2025 class at 36.19%, but it is most continuous across the northern and northeastern half. Agriculture accounts for 26.99% and becomes much more prominent toward the south, while wetlands cover 21.68% and form broad corridors through the west and along several interior drainage paths. Developed land remains a relatively small 4.91% and clusters in only a few places.
This page includes four matching views of Hale County: general land cover, forest and farmland, fractional impervious surface, and mapped class differences from 1985 to 2025. The four original JPG maps are available in one download for lessons, county profiles, reports, presentations, and broad environmental comparison. Each original JPG is 2480 × 1754 pixels, while the article uses 1800 × 1273 WebP previews.
Table of Contents
Forest dominates the north while agriculture opens across the south
The general 2025 map divides Hale County into several visually distinct zones. Dark green forest covers much of the northern third and remains strong through the northeast. Yellow agricultural cover appears throughout the county but expands substantially in the southern half, where large connected field areas replace much of the continuous northern forest. The central part acts as a transition zone, with farms, forest, wetlands, and developed cells more tightly mixed.
The countywide percentages reinforce that pattern without replacing the map itself. Forest leads at 36.19%, agriculture follows at 26.99%, and wetlands account for 21.68%. Shrubland is 4.01% and developed cover is 4.91%. Because the three largest classes occupy different parts of the county, Hale County is better described as a forest–farm–wetland mosaic than as a county dominated by one uniform landscape.
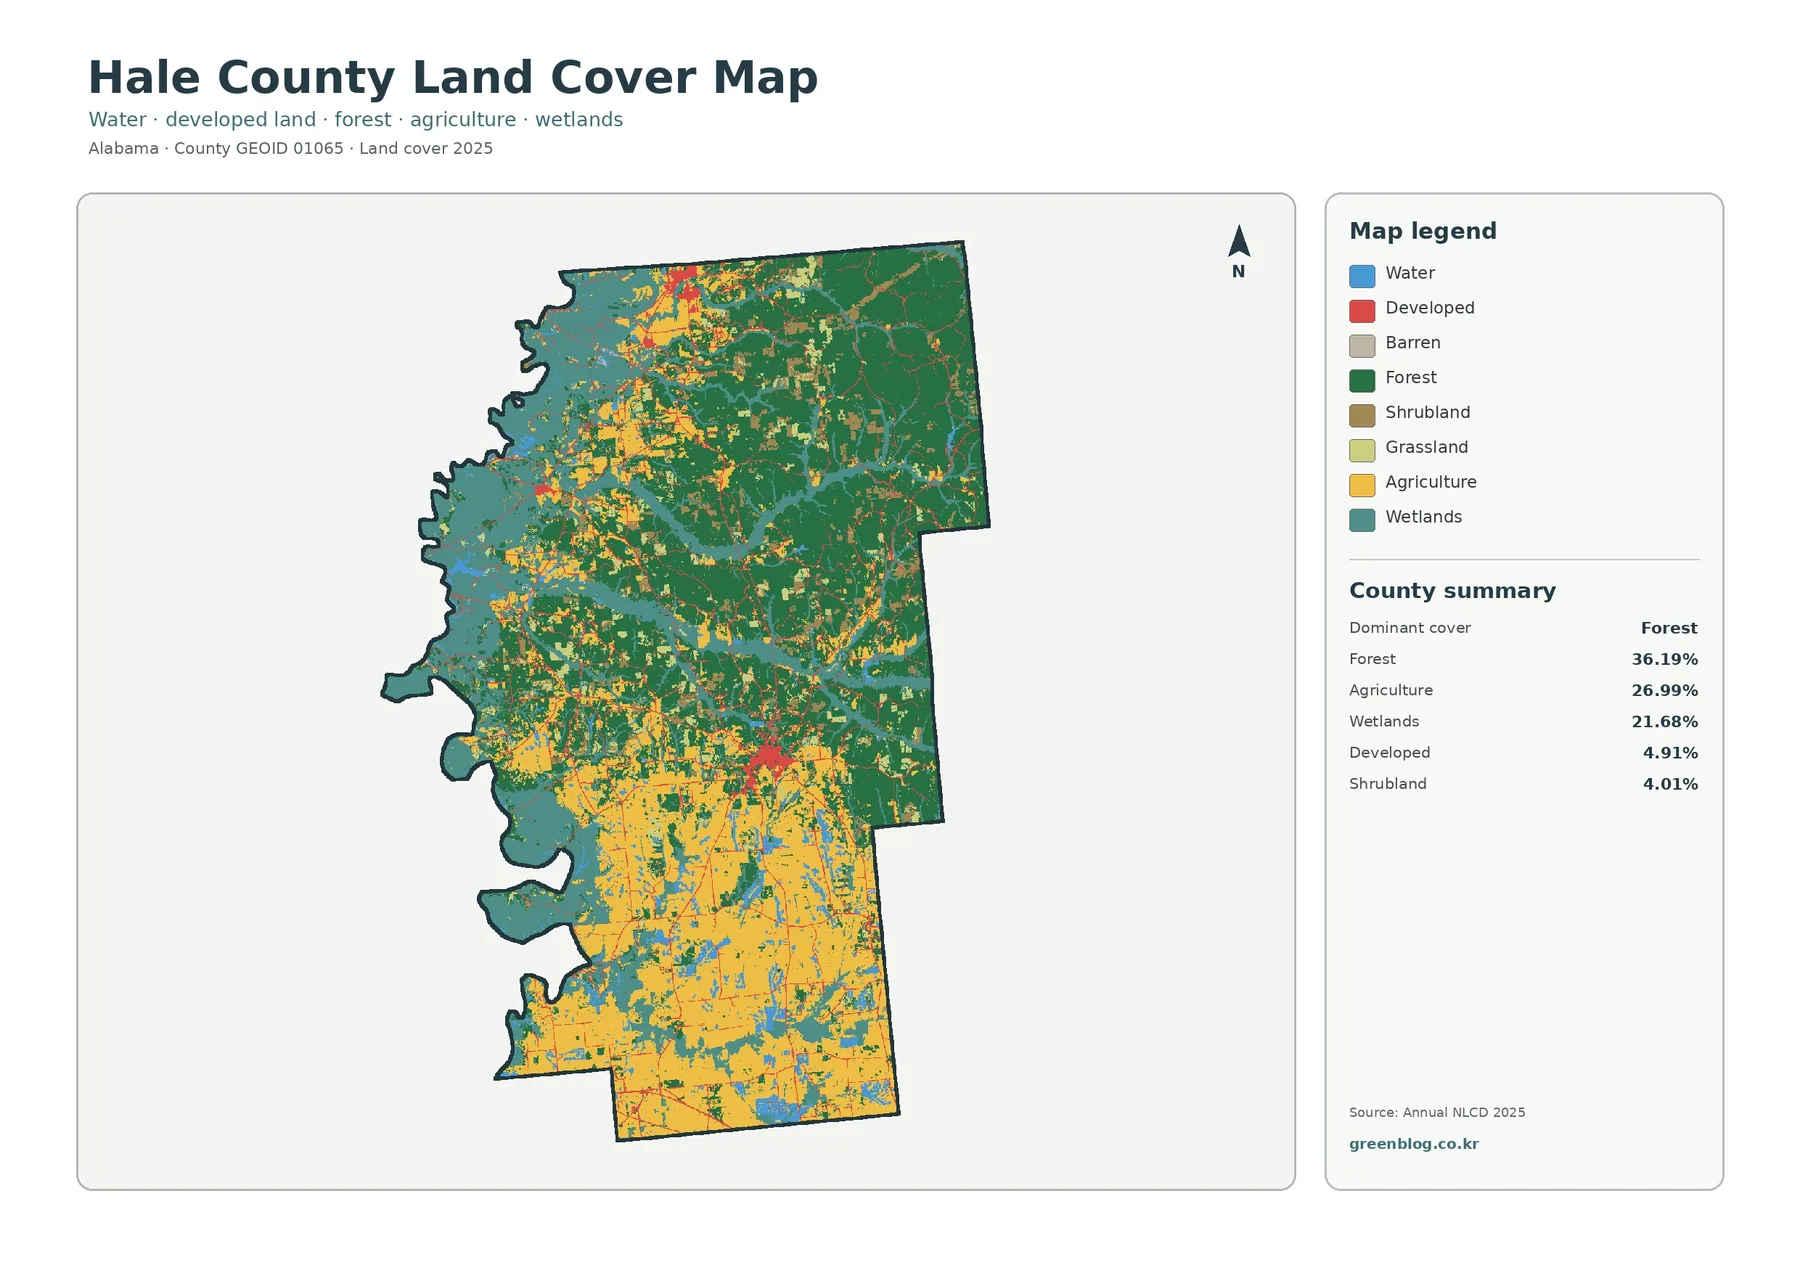
The western boundary and several interior corridors contain extensive wetland color. Open water is less common than wetland, so broad blue-green areas should not be described simply as rivers or lakes. The forest-and-farmland summary reports water at 3.50%, compared with wetlands at 21.68%. This distinction is useful when reading the map because wetland is a land-cover class rather than a symbol for open water.
The developed pattern is compact. One of the clearest clusters appears near the center-right of the county, with another smaller concentration in the north. Thin developed traces extend along connecting routes, but most of Hale County remains lightly developed. The map itself does not label towns, so the safest interpretation is to describe the location and intensity of these clusters rather than assign every red patch to a municipality without a separate reference map.
Black Warrior watershed context helps explain the western wetland pattern
Hale County lies within the broader Black Warrior River watershed. An Alabama Department of Environmental Management watershed plan lists Hale County communities including Akron, Greensboro, Moundville, Newbern, and Sawyerville within the Black Warrior watershed, and ADEM’s reservoir information places Warrior Reservoir in Greene, Hale, and Tuscaloosa counties. These official sources provide useful regional context for the broad water- and wetland-related cover visible along the county’s western side.
The thematic maps do not label individual rivers, creeks, or reservoir reaches. For that reason, a particular blue or blue-green strip should not automatically be named from appearance alone. A hydrography layer or topographic map is needed to match each channel precisely. What can be stated directly from the supplied imagery is that wetland cover is extensive in the west, branches into the interior, and separates some of the forest and agricultural areas.
This is also an important limit for flood or permit questions. A mapped wetland cell does not establish a regulatory wetland boundary, a floodplain, a stream buffer, or a drainage easement. Annual NLCD classifies the visible surface at a generalized raster scale. Site-level environmental work may require current agency data, field indicators, soils, hydrology, or survey information.
The rural map shows where cropland and pasture interrupt the forest
The forest-and-farmland view removes much of the visual competition from developed classes and separates cropland from pasture or hay. Its summary lists forest at 36.19%, agriculture at 26.99%, wetlands at 21.68%, water at 3.50%, shrubland at 4.01%, and grassland at 2.68%. Agriculture is therefore substantial, but the legend makes clear that the county’s open rural land is not all the same type.
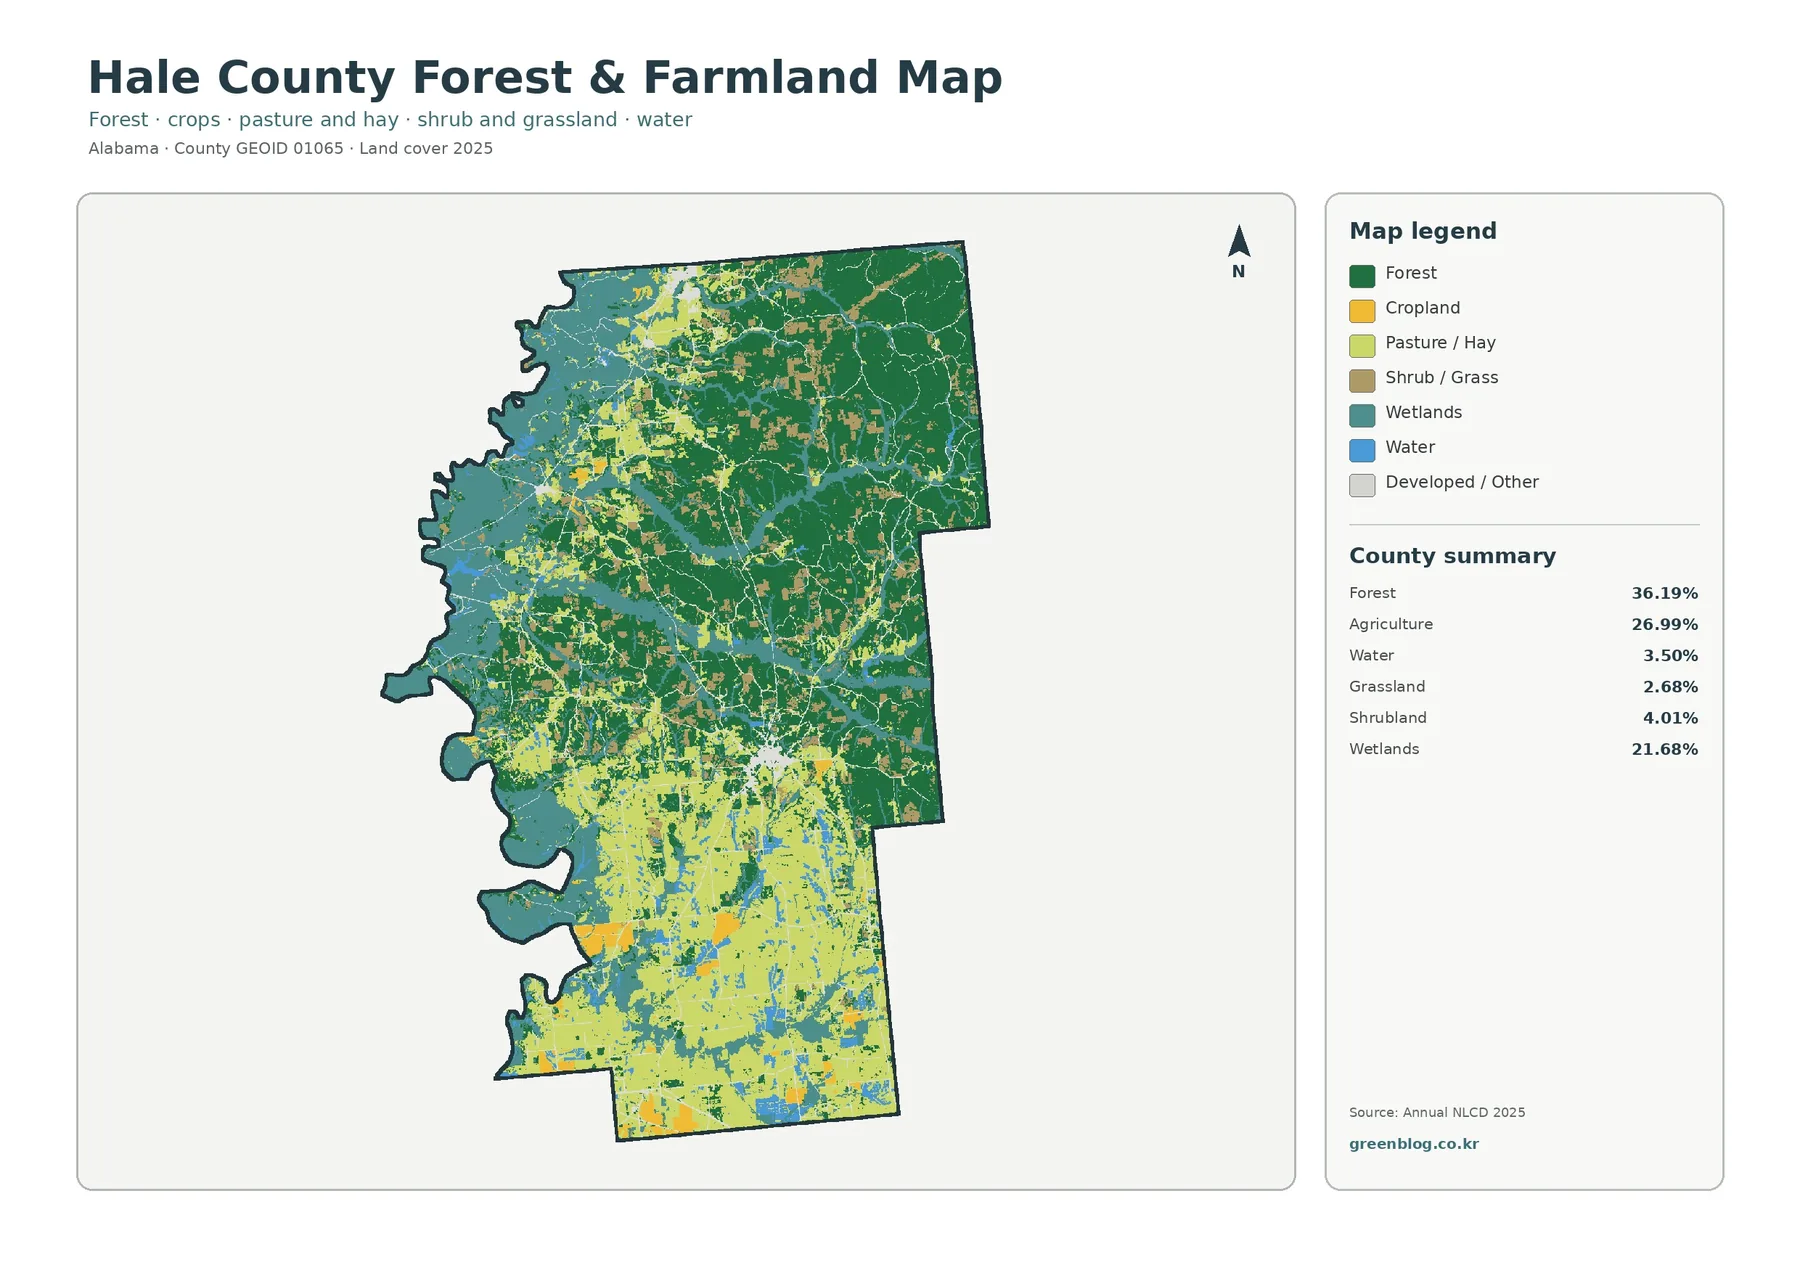
Large agricultural areas are especially easy to see in the southern third. Many of those open areas appear as pasture or hay rather than cropland, while smaller cropland blocks are scattered through the south and central part of the county. Moving north, the forest becomes more continuous, although farms and wetland corridors still interrupt it. This shift is one of the strongest county-specific patterns in the entire four-map set.
The western half differs again because wetlands occupy long connected areas between forest and fields. In some places agriculture ends abruptly beside wetland color; in others narrow forest strips lie between the two. Those relationships are useful for habitat or watershed discussions because they show how farmland, woodland, and wetter surfaces meet across the county without assuming that one class causes another.
The Alabama Cooperative Extension System operates the Hale County Extension Office in Greensboro. That county-specific resource is appropriate for practical questions about agriculture, forestry, livestock, gardening, and land management that go beyond what a satellite classification can answer. The map can show where agricultural or forest cover is concentrated, but it cannot identify an operator, crop contract, timber plan, parcel owner, or legal land-use status.
Impervious cover is low countywide and concentrated in a few centers
Impervious surface estimates the fraction of a cell covered by hard materials such as pavement and rooftops. Hale County’s mean imperviousness is 0.69%, while only 0.13% of the county is mapped at 50% or greater imperviousness. Developed land covers 4.91%, which is higher because a developed land-cover cell can also contain lawns, trees, bare soil, and other permeable ground.
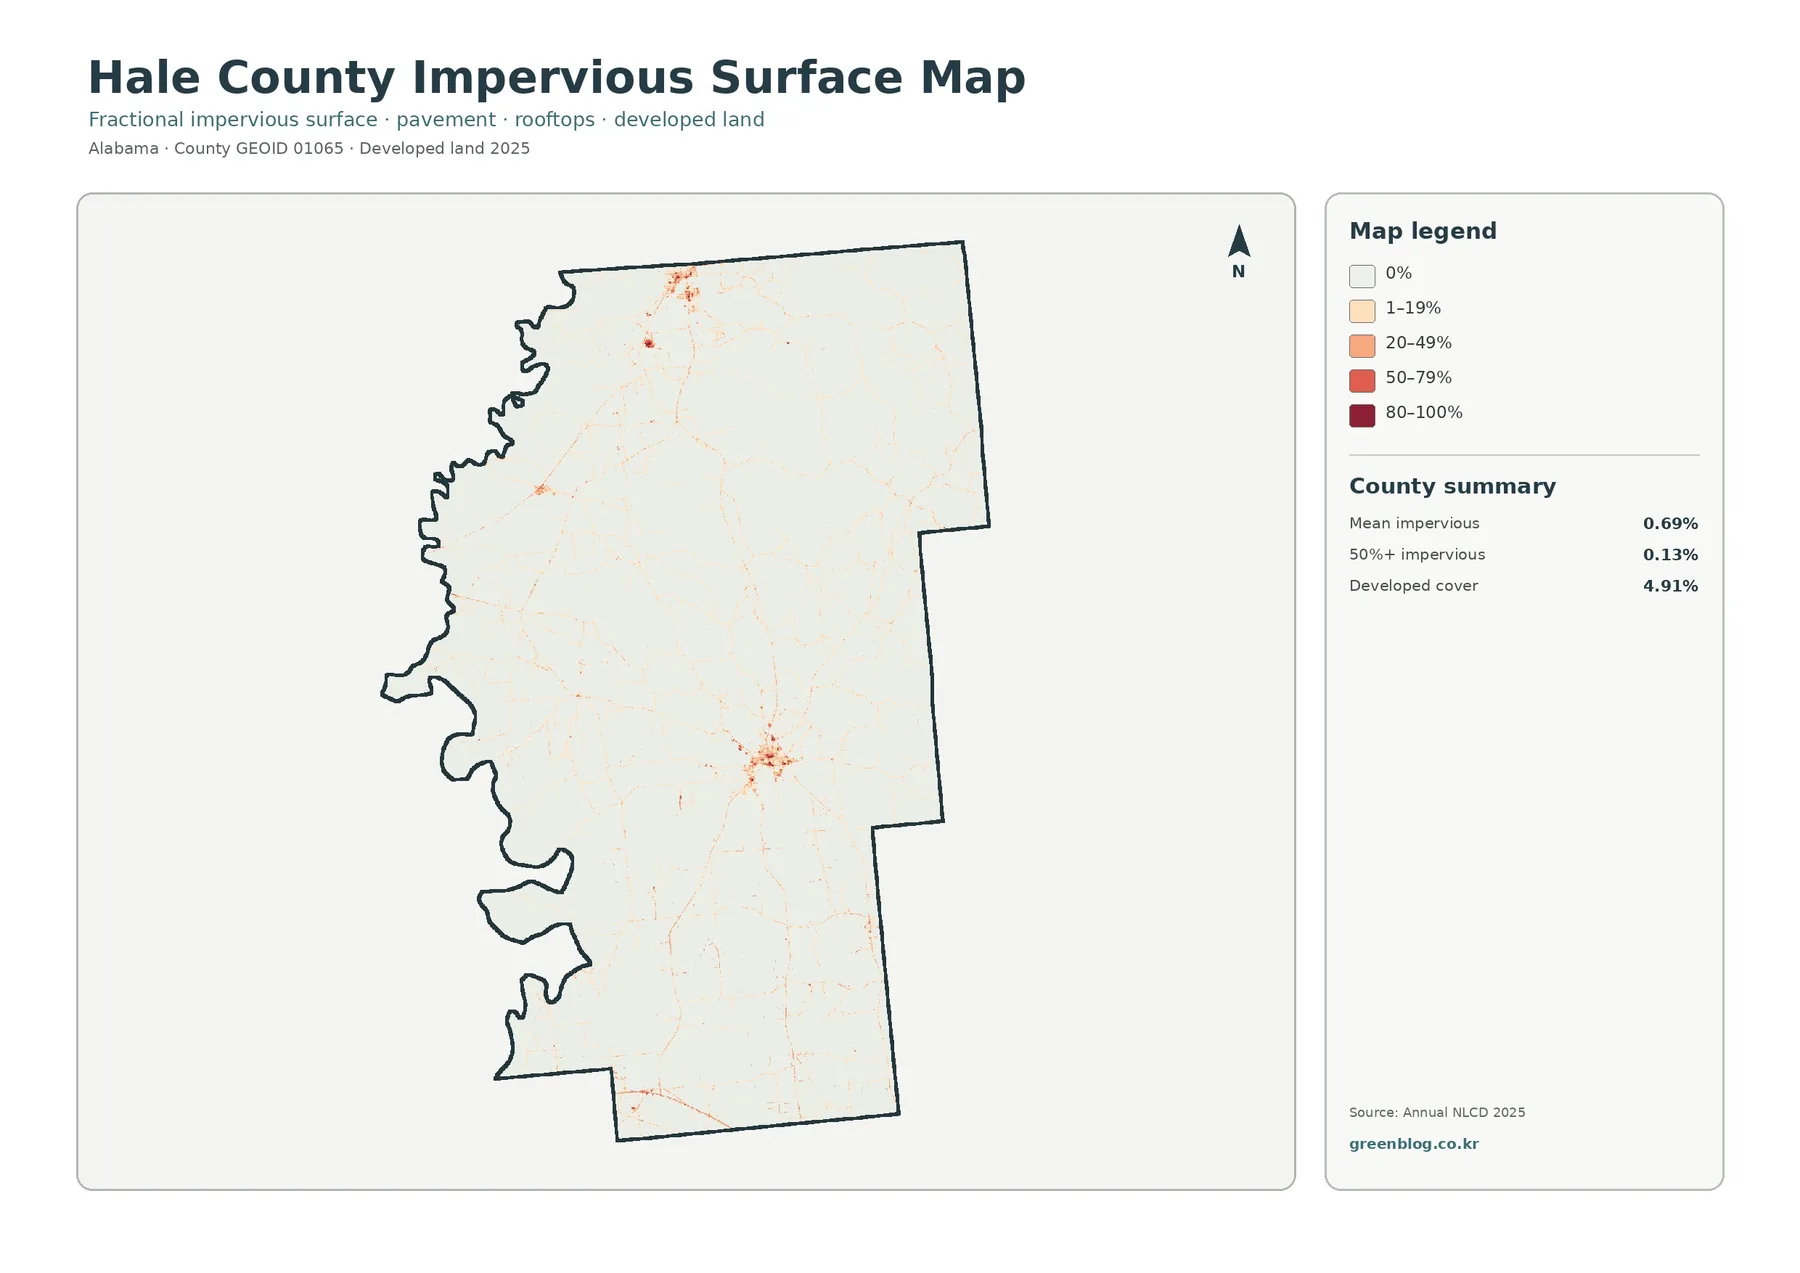
Most of the impervious map is nearly white. The strongest dark cluster appears near the middle-right of the county, and a smaller but very distinct concentration is visible in the north. Narrow pale-orange lines connect additional developed traces, while the southern agricultural area remains mostly light except for scattered roads and small centers. The pattern explains why the countywide mean stays below 1% even though developed areas are easy to locate visually.
The impervious map is useful for discussing settlement intensity or broad stormwater context, but it is not an engineering layer. It does not show drainage pipes, culverts, detention basins, flow direction, road ownership, or building footprints. A dark cell means a relatively high estimated hard-surface fraction within that raster cell, not that the entire cell is one paved object.
The 1985–2025 comparison is densest across the forested north and central transition zone
The change product compares mapped land-cover classes at two endpoints, 1985 and 2025. The supplied summary reports class differences across 30.36% of Hale County. Within the named categories, 1.00% is classified as to developed, 6.00% as forest loss, 5.14% as agricultural loss, and 17.58% as other class difference. A wetland-difference color appears in the legend, but the summary does not give a separate countywide percentage for that class.
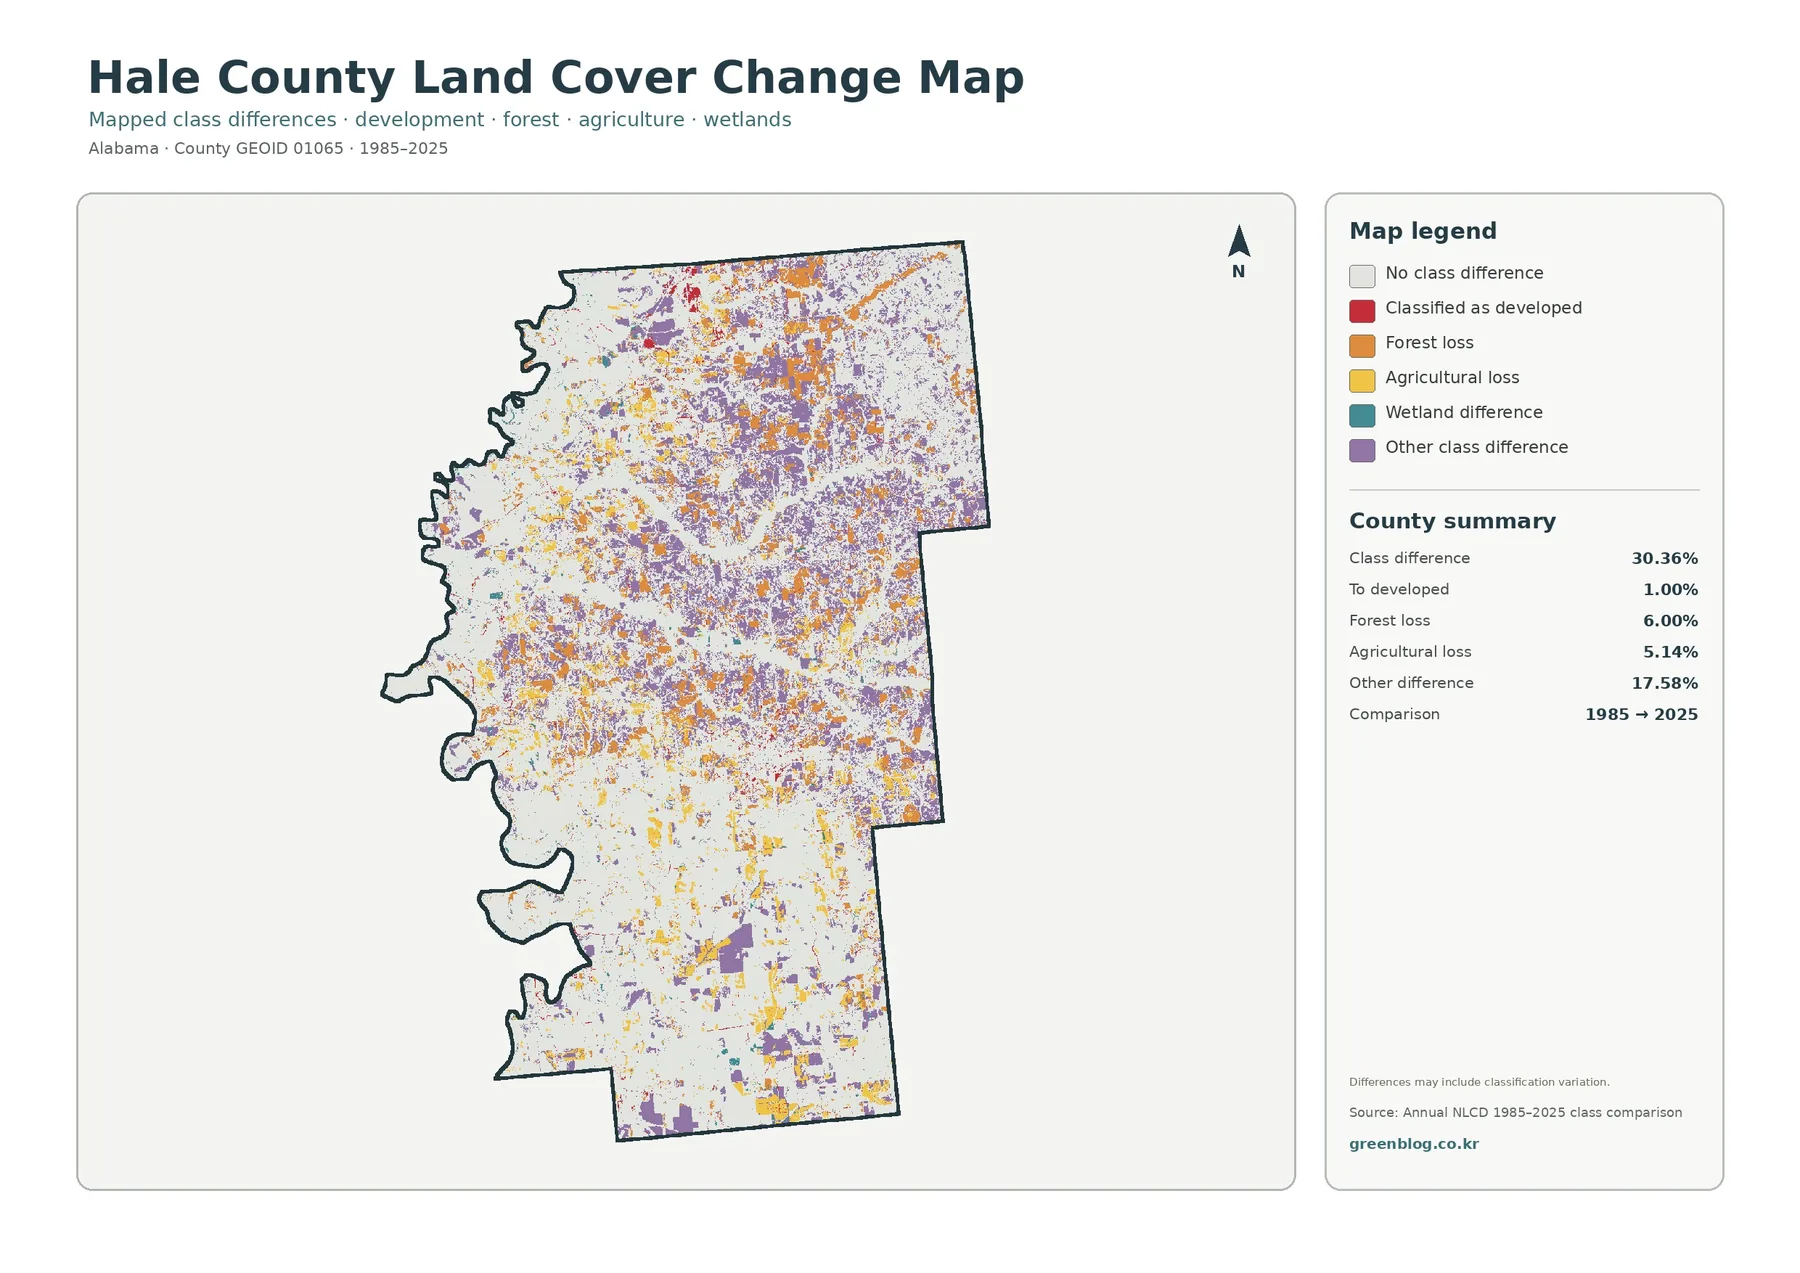
Orange forest-loss and purple other-difference cells are especially dense across the northern and central portions of the county. Yellow agricultural-loss cells are scattered across both agricultural and mixed-cover areas, while red to-developed cells occur in much smaller clusters. The southern third contains fewer dense change patterns than the north, although localized differences remain visible.
The printed warning on the map is essential: differences may include classification variation. A cell with one class in 1985 and another in 2025 does not automatically prove a physical conversion on the ground. Mixed pixels, seasonal vegetation, image quality, sensor differences, or changes in classification methods can affect the assigned class. Real development, clearing, regrowth, farming changes, and wetland transitions may also be present, but this two-date image cannot identify the exact cause or year.
For a historical project, the best use of the map is to identify areas that deserve closer study. Intermediate Annual NLCD years, older aerial photographs, local agricultural or forestry records, and field evidence can then be checked. This approach keeps the 30.36% endpoint-difference value useful without treating it as a direct measurement of physical land conversion.
The four maps answer different questions and should be compared in sequence
A clear reading order starts with the general 2025 map, which establishes the county’s forest, farm, and wetland balance. The forest-and-farmland map then separates the rural classes more clearly. The impervious map narrows attention to hard surfaces within developed areas. Finally, the 1985–2025 map shows where the two endpoint classifications differ. Reading them in this order reduces the chance of describing a current developed cell as new development simply because it is red today.
The percentages should remain attached to the measurement that produced them. Developed cover is 4.91% in 2025, but only 1.00% is labeled “to developed” in the endpoint comparison. Mean imperviousness is 0.69%, which measures hard-surface fraction rather than the categorical developed class. Forest covers 36.19% today, while 6.00% is marked as forest loss in the comparison. These figures should not be added or subtracted to create a single development or forest-change rate.
The same discipline improves comparisons with another county. Match 2025 agriculture with 2025 agriculture, wetland percentage with wetland percentage, mean imperviousness with mean imperviousness, and the same 1985–2025 difference categories with one another. Matching the year and map type makes a school assignment or regional report much easier to explain.
Download the four original Hale County JPG maps
The download archive contains four original JPG files using the same Hale County extent and orientation. A report can introduce the overall land-cover pattern first, use the forest-and-farmland image for the north–south rural contrast, show the small concentrated impervious footprint, and finish with the 1985–2025 endpoint comparison. The consistent frame makes the sequence easy to compare side by side.
Each original JPG is 2480 × 1754 pixels. The package identifies this as the source resolution and does not mark the maps as meeting a higher A3-resolution reference. If the files are printed at a large physical size, test the legend and small labels before final output. Enlarging an image can increase the displayed pixel size but cannot create new geographic detail.
Raster scale and legal purpose limit site-level use
Annual NLCD land cover is raster data. Hale County is divided into grid cells and each cell receives a representative surface class. At roughly 30-meter land-cover resolution, a narrow road, field edge, tree line, stream, or building can share a cell with another surface. A sharp color boundary in the JPG is therefore not the same as a surveyed property boundary.
The current-cover maps summarize 2025 conditions supplied in this package. Construction, crop changes, forestry activity, flooding, or vegetation recovery after that observation year are outside these images. The historical map compares only the 1985 and 2025 endpoints, so changes that occurred and later reversed may be hidden if a cell ends in the same class where it began.
Land cover also differs from legal land use. Agricultural cover does not establish agricultural zoning or ownership, forest does not identify timber rights, developed cover does not grant a building right, and wetland cover does not replace a jurisdictional wetland determination. Property or assessment questions should be checked against current parcel resources, such as Hale County appraisal and GIS records identified by the Alabama Department of Revenue, while permitting and environmental decisions require the appropriate agencies.
Frequently Asked Questions
What is the largest 2025 land-cover class in Hale County?
Forest is the largest class at 36.19%, followed by agriculture at 26.99% and wetlands at 21.68%. The map shows an important spatial contrast: forest is most continuous in the north, agriculture expands in the south, and wetlands are especially extensive in the west and along branching interior corridors.
Why is developed cover 4.91% while mean imperviousness is only 0.69%?
They measure different things. Developed land is a categorical cover class that can include lawns, trees, soil, and other permeable surfaces. Imperviousness estimates the hard-surface fraction from pavement and rooftops. Hale County’s mean imperviousness is 0.69%, and only 0.13% of the county is at least 50% impervious.
Does the 30.36% class-difference value mean 30.36% of Hale County was physically transformed?
Not necessarily. It means that 30.36% of mapped cells have different classes in the 1985 and 2025 endpoint comparison. The map warns that classification variation may be included. Some cells may reflect real change, while others can differ because of mixed pixels, image conditions, or classification methods.
Map File Information
The ZIP contains four original Hale County JPG maps: 2025 land cover, forest and farmland, impervious surface, and mapped class differences from 1985 to 2025.
- File Type: ZIP containing four JPG images
Related Maps
- Autauga County Alabama Land Cover Map
- Baldwin County Alabama Land Cover Map
- Barbour County Alabama Land Cover Map
Sources and data notes
- MRLC Annual NLCD Data — official access point for Annual NLCD land-cover and developed-surface products.
- USGS Annual NLCD Land Cover Classification — official descriptions of the mapped land-cover classes.
- Alabama Cooperative Extension System: Hale County — county-specific Extension office and local agricultural outreach resource in Greensboro.
- ADEM Black Warrior River Watershed Management Plan — official watershed context that includes Hale County communities.
- Alabama Department of Revenue: County Appraisal and Assessment Records — official directory for Hale County appraisal and GIS resources.
Green Map creates custom-edited map images using open geographic data sources such as geoBoundaries, Natural Earth, OpenStreetMap, and government open data.
These maps are edited visual materials, not raw data files, and are provided for education, documents, presentations, and graphic reference.