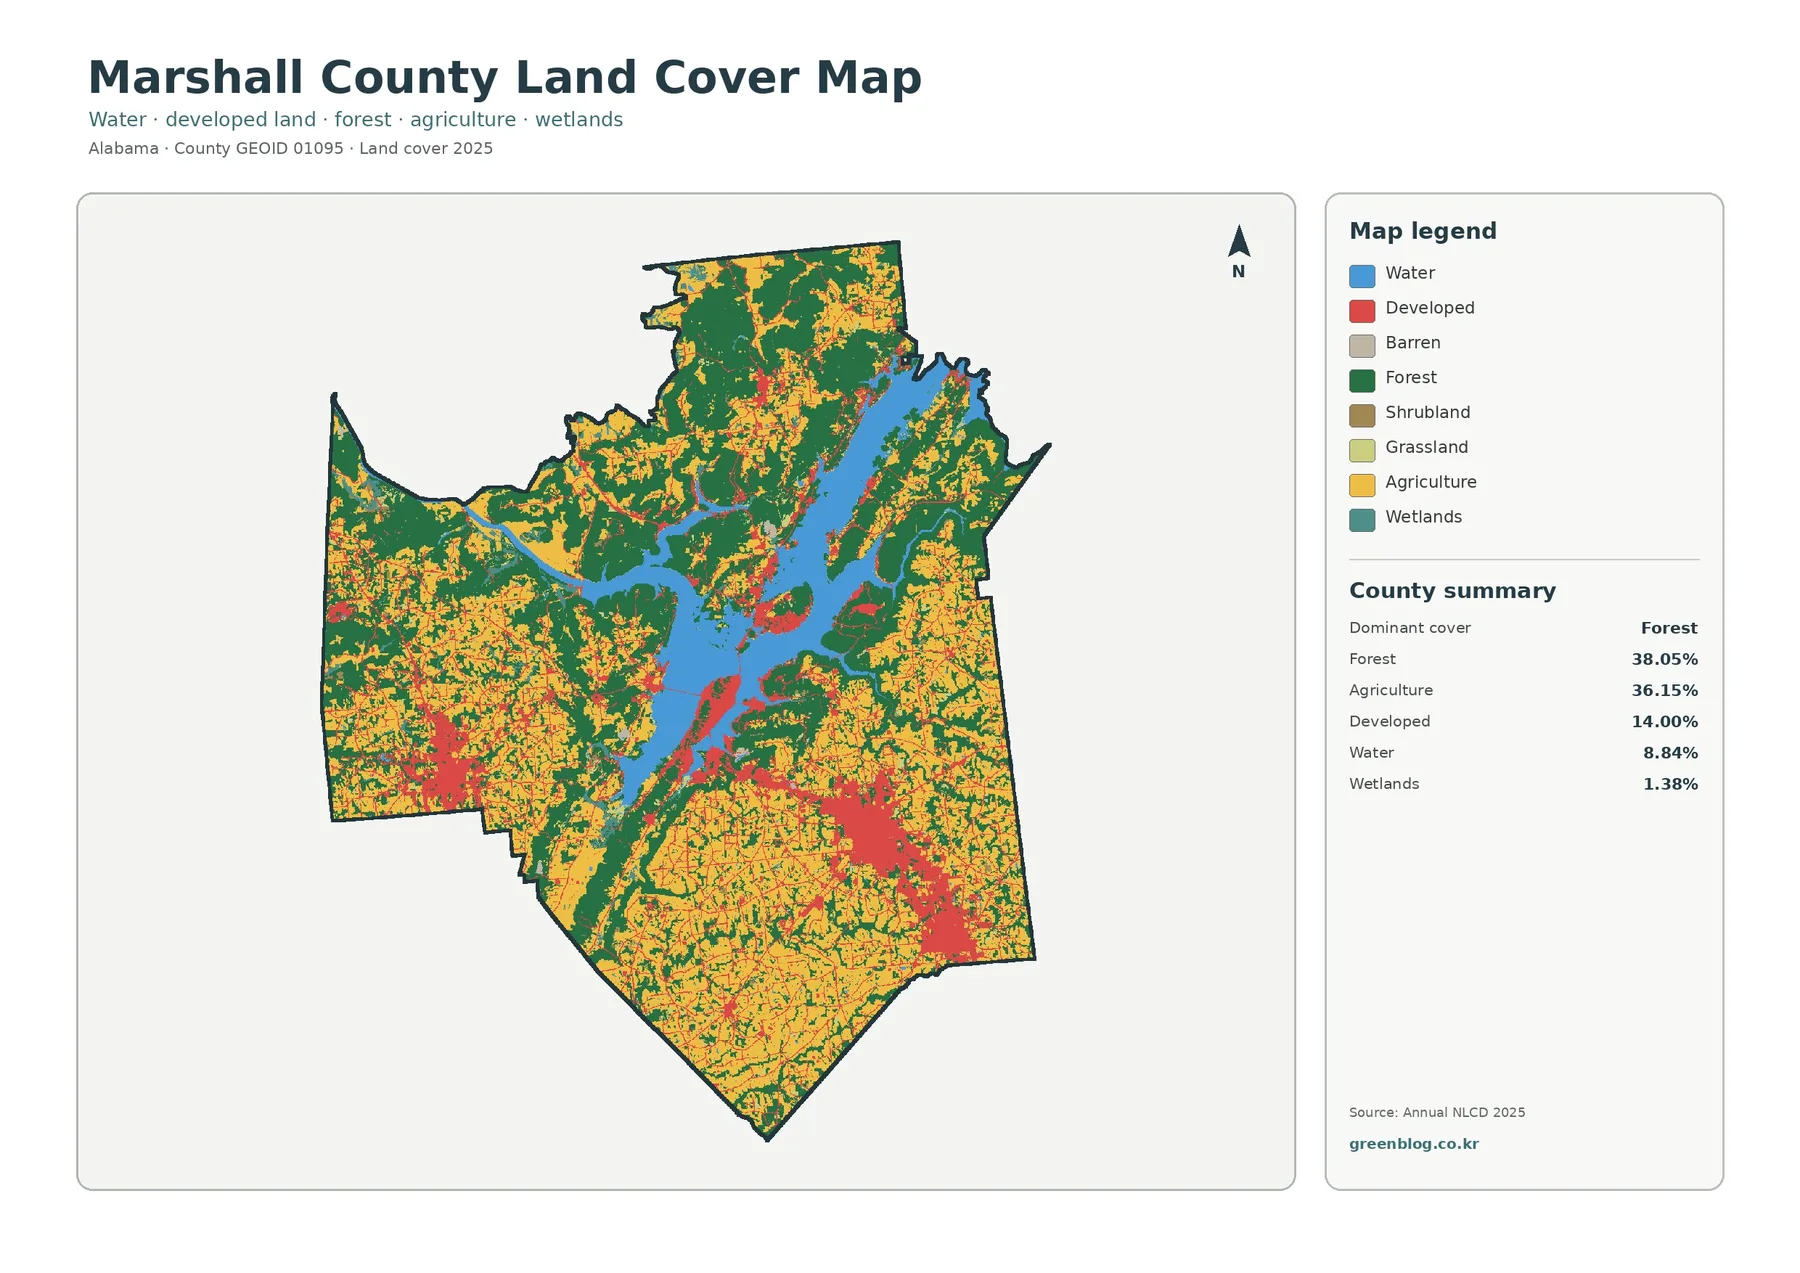
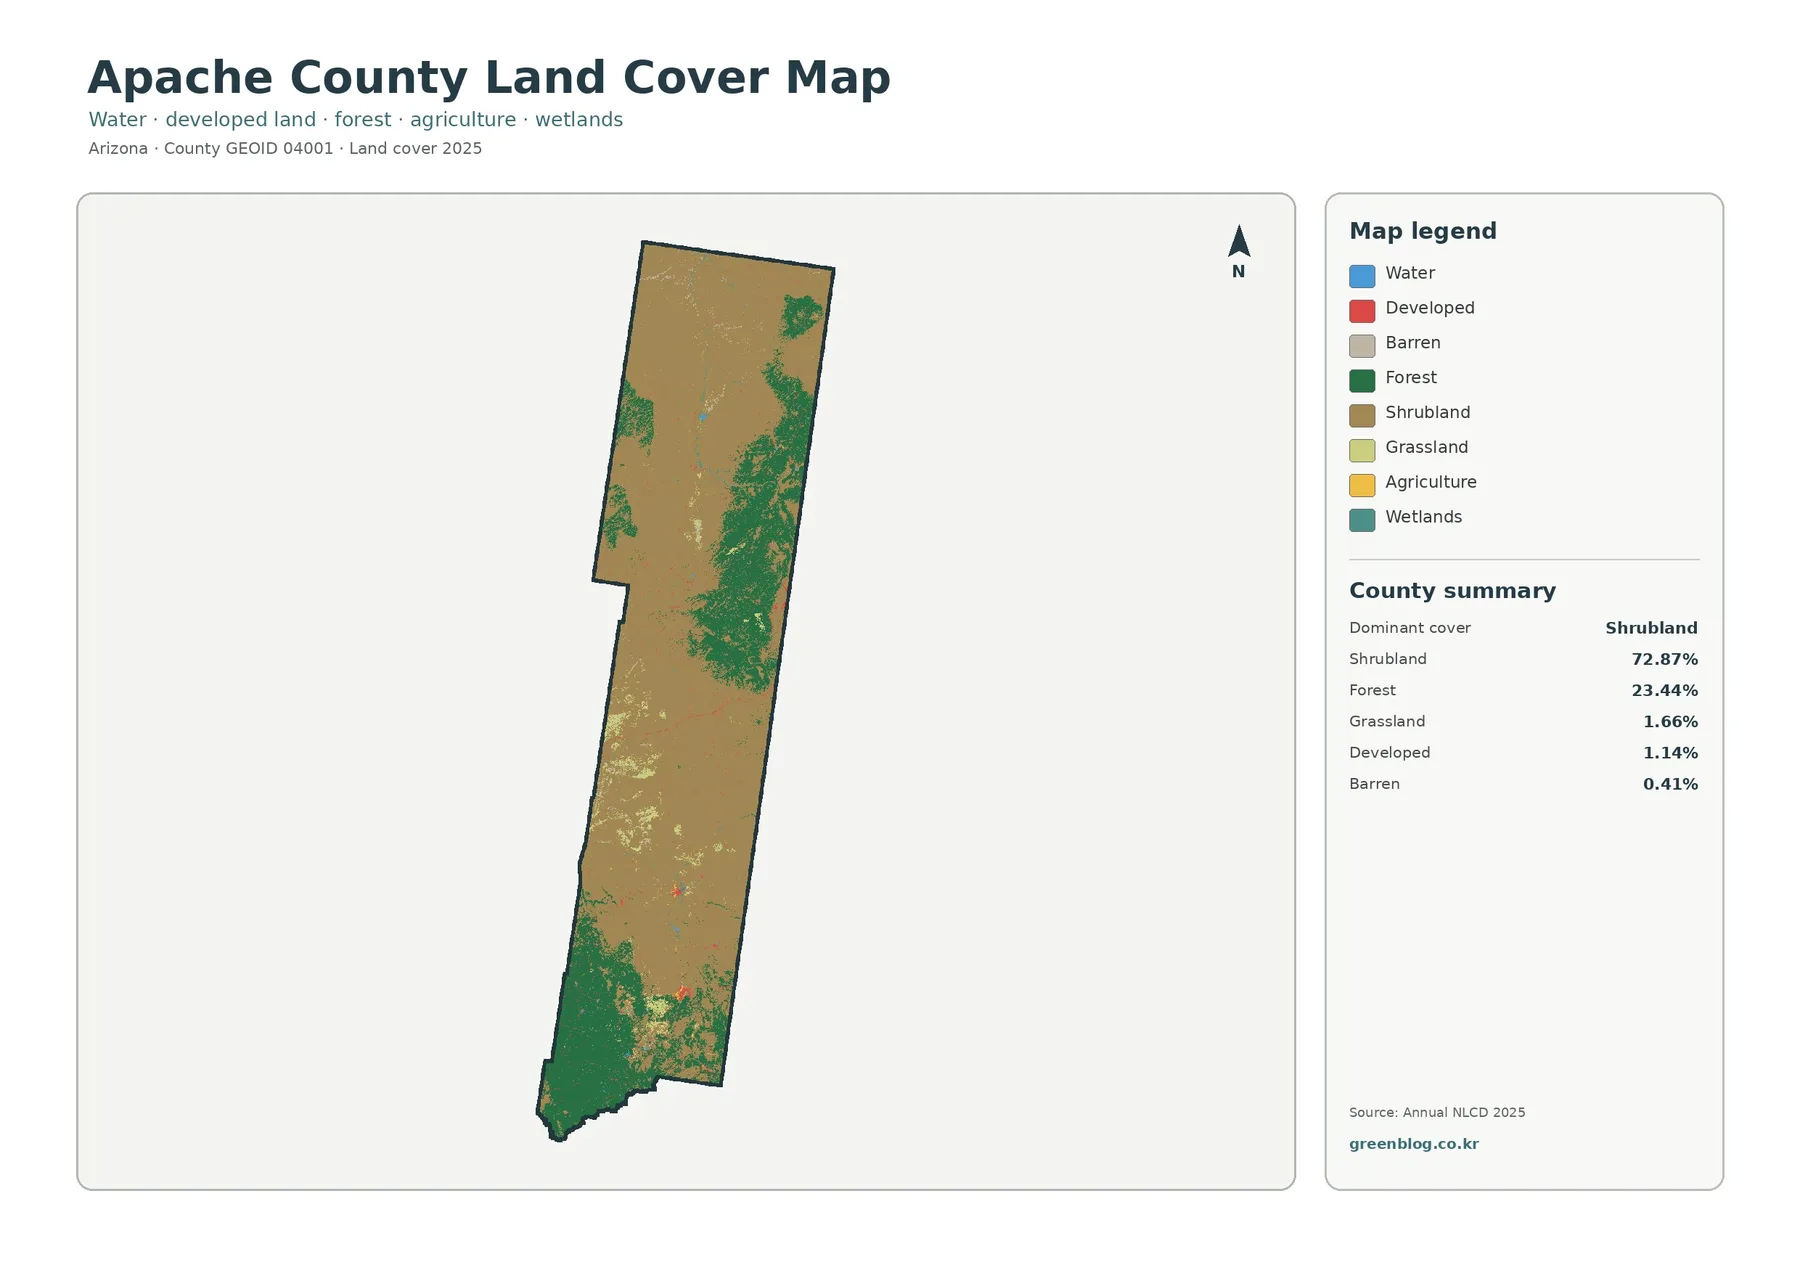
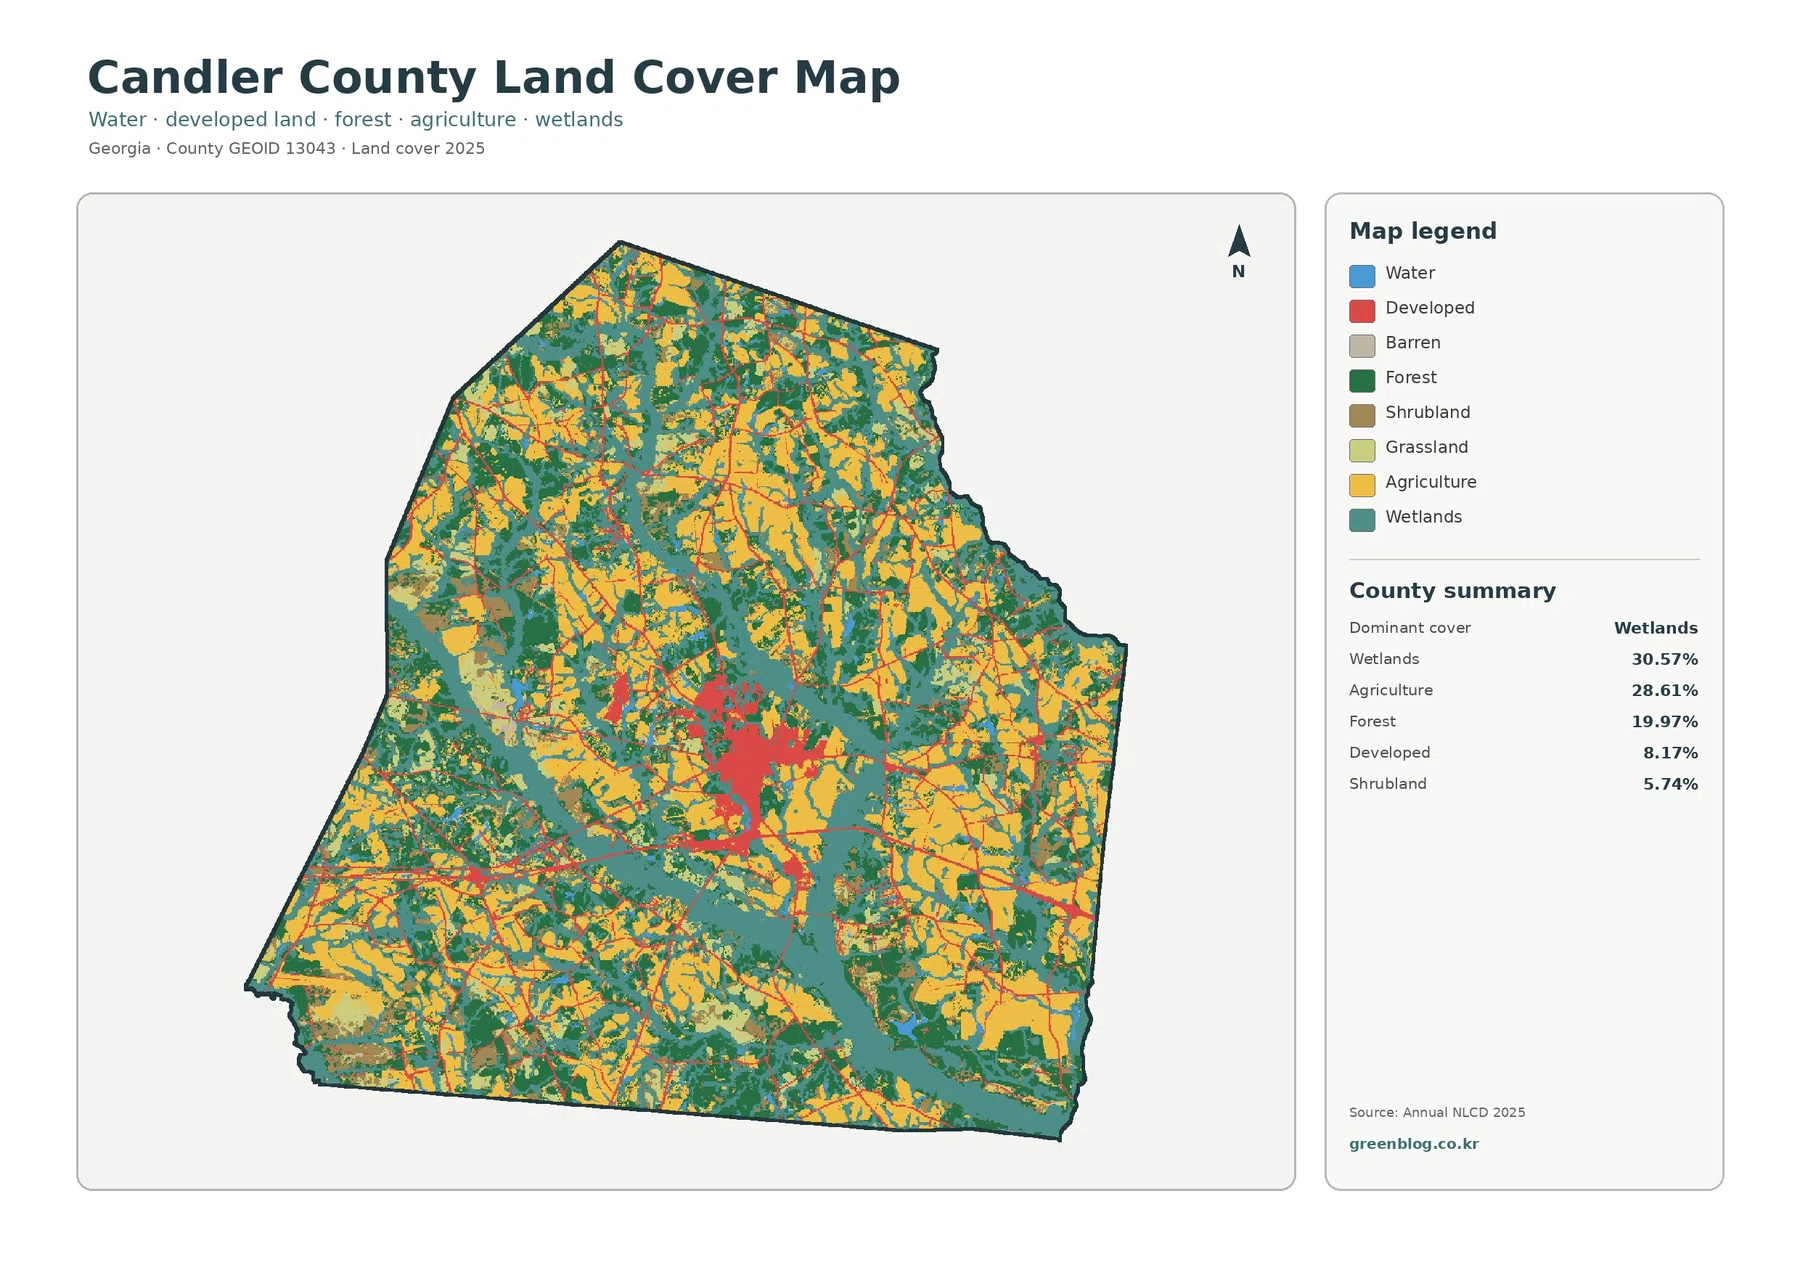
Greene County Alabama Land Cover Map focuses on a county where water-related cover is just as important as woods and fields. In the supplied 2025 summary, wetlands account for 33.28% and forest for 32.76%, with agriculture at 18.52%. The west and south look markedly wetter than the northern half, while developed land appears in only a few compact places rather than spreading across the county.
The page compares current land cover with a forest-and-farmland view, fractional impervious surface, and a 1985–2025 endpoint comparison. The four original JPG maps are packaged in one ZIP for download, so the same Greene County extent can be reused in reports, lessons, presentations, or county-to-county comparisons without relying on browser screenshots.
Table of Contents
Wet ground shapes the west and south more than development does
Wetlands are the largest single 2025 class in Greene County at 33.28%. Their color spreads across much of the western half, widens toward the southwest, and remains extensive along the southern side. Instead of one compact blue-green block, the pattern branches and bends through wooded and agricultural areas. That shape is one reason the county looks very different from a place where open water is confined to a reservoir or a single large river channel.
Forest is almost equal in area at 32.76%, but it is distributed differently. Dark green is broader across the north and east, with additional wooded patches through the center. In some places large forest blocks touch wetlands directly; elsewhere fields separate them. The near-equal percentages therefore describe two surface classes that occupy different parts of the county rather than two colors mixed evenly everywhere.
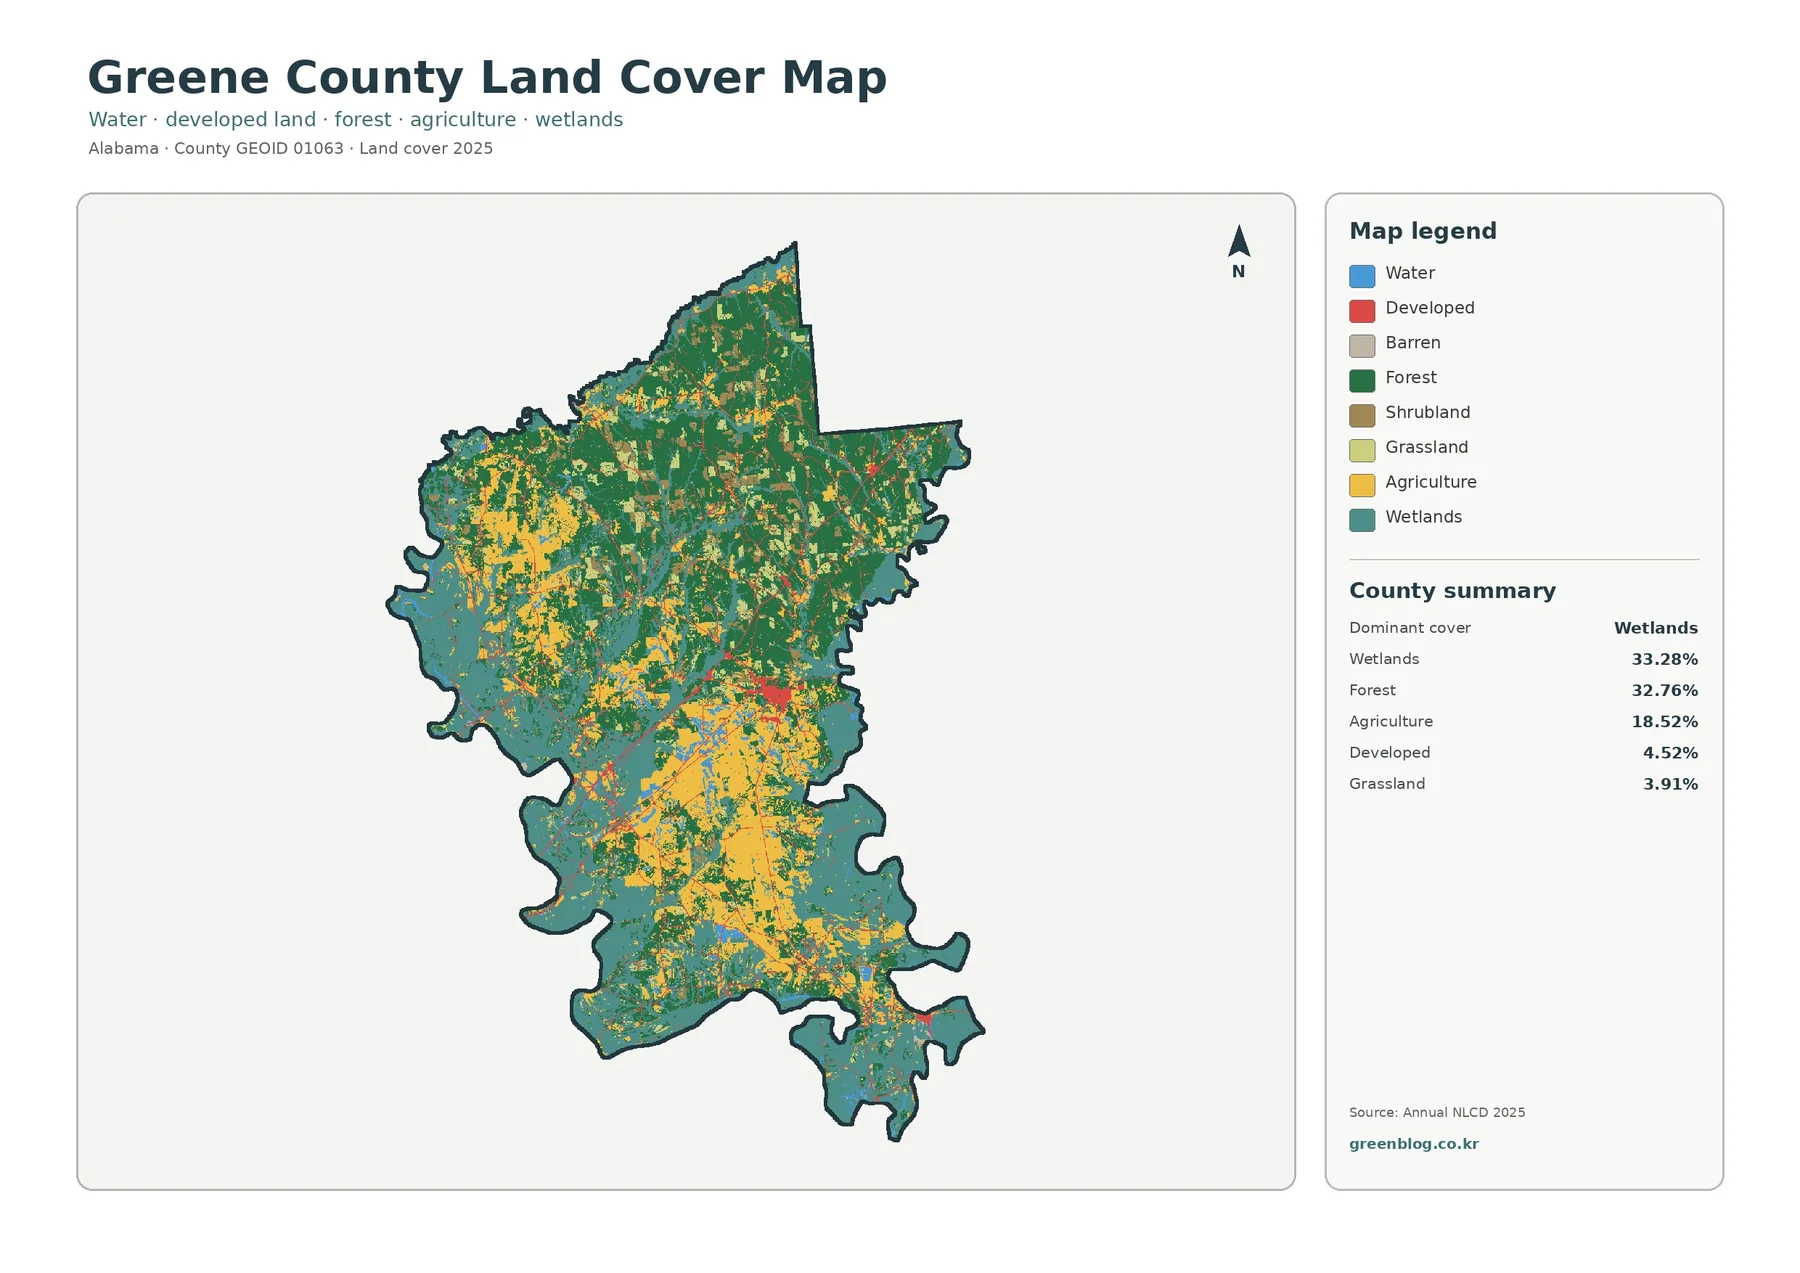
Agriculture contributes another 18.52%. Several larger field groups appear in the northwest and central interior, and agricultural cover also reaches into the southern half where it is interrupted more often by wetland. Developed land is only 4.52%. The most noticeable developed cluster lies slightly east of the county center, while smaller patches and narrow traces occur elsewhere. A reader can therefore understand Greene County more accurately by comparing where each class is concentrated instead of looking only at the countywide percentages.
Black Belt fields remain visible between forest and wetland
The Greene County Commission describes the county as part of Alabama’s Black Belt and notes its long agricultural history. That background is visible in the present-day agricultural share, but the 2025 map does not portray a county covered mainly by farms. Wetland and forest together occupy about two thirds of the mapped surface, so the agricultural areas are best understood as openings within a much wetter and more wooded county.
The forest-and-farmland view makes those openings easier to separate. Its summary lists forest at 32.76%, agriculture at 18.52%, wetlands at 33.28%, open water at 3.21%, grassland at 3.91%, and shrubland at 3.72%. Cropland and pasture or hay use separate legend colors, allowing broad agricultural areas to be compared without treating every field-like cell as the same cover type.
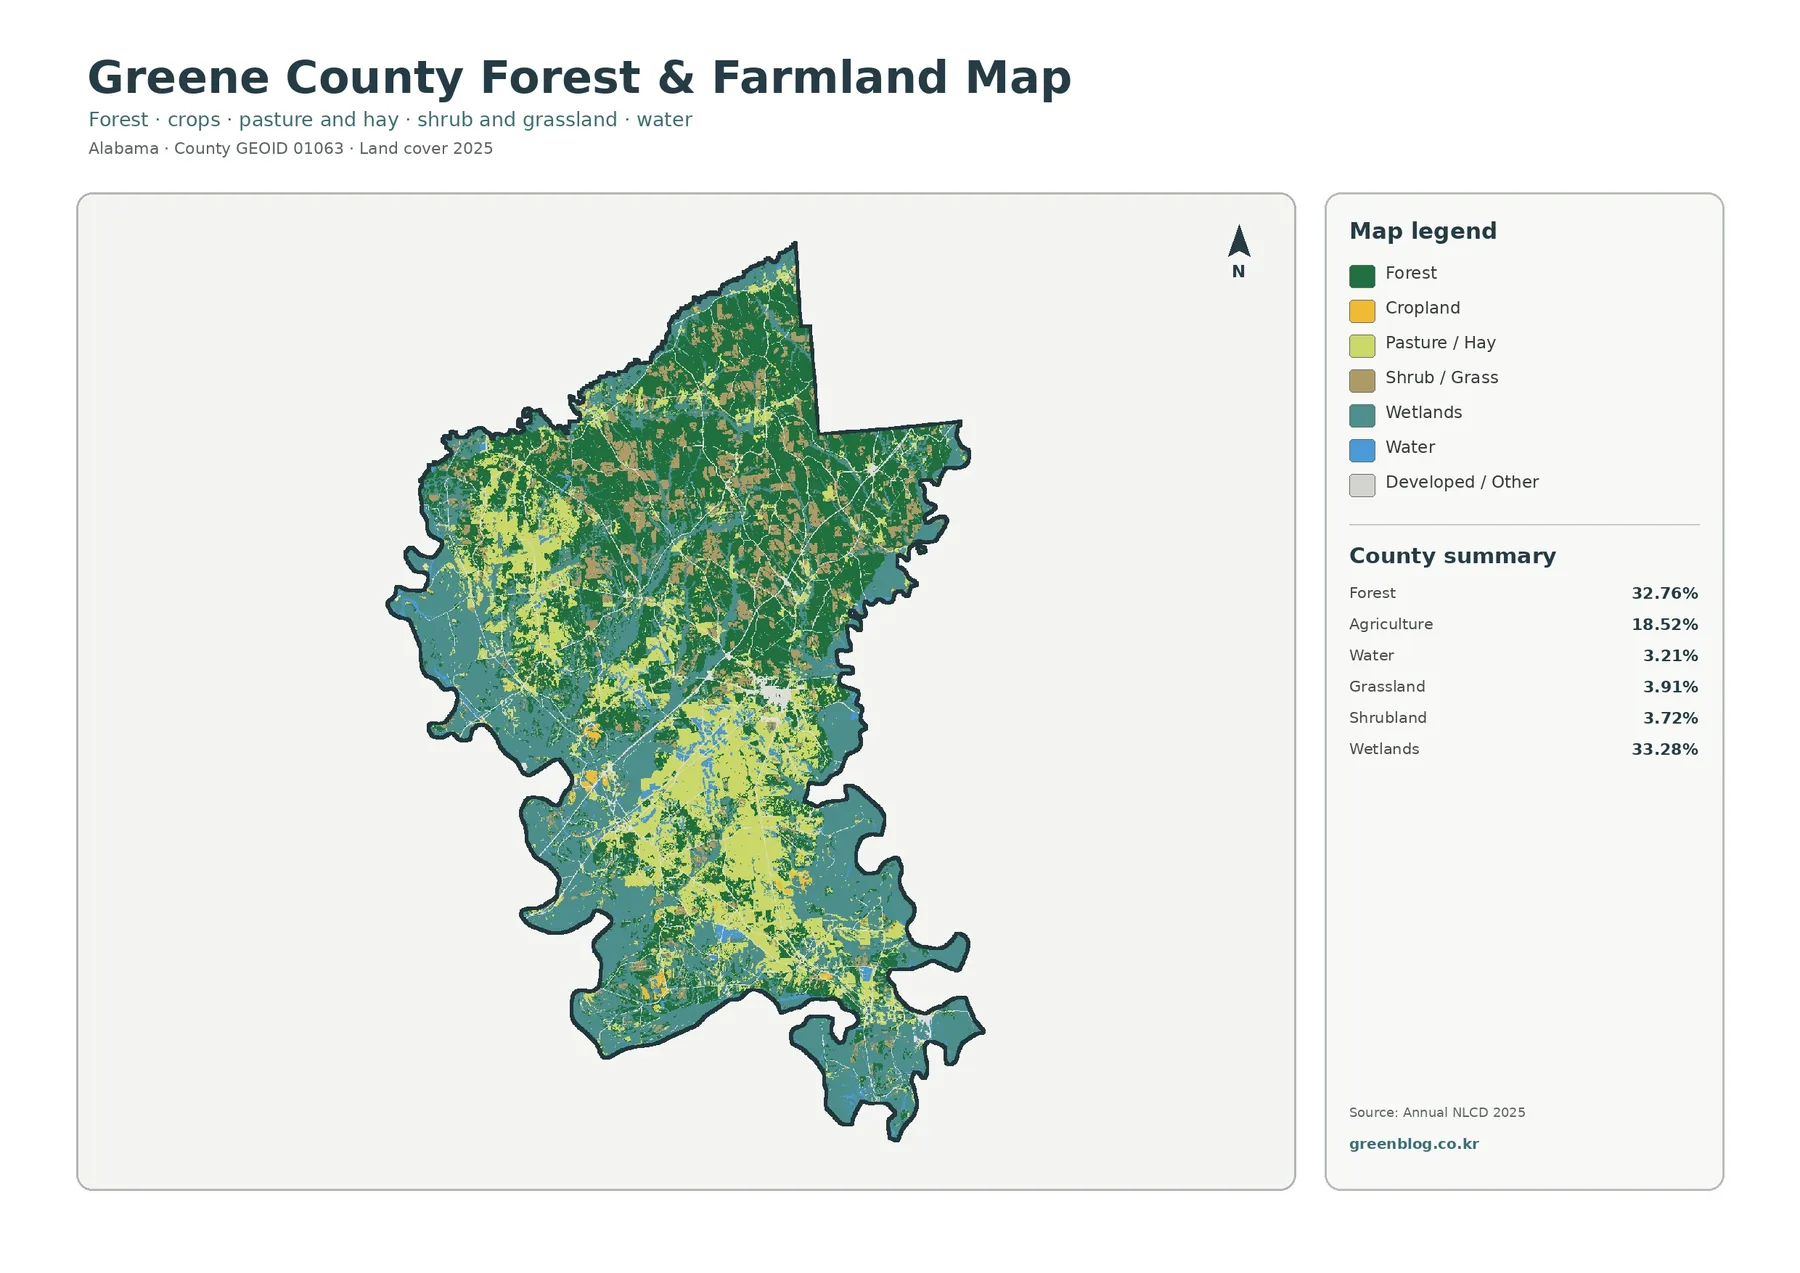
In the northwest, agricultural cover sits beside large forest blocks. Through the central interior, fields become more fragmented as forest and wetland reappear between them. Farther south, wetland occupies more of the landscape and agricultural patches become less continuous. This difference within a single county is important for classroom or regional work because the same 18.52% agricultural total represents several distinct local arrangements.
A land-cover class should not be confused with a property record. Cropland and pasture colors do not identify an owner, operator, crop, tax status, or zoning district. Forest color does not tell whether a tract is public, private, protected, or managed for timber. Alabama Cooperative Extension’s Greene County office is a more appropriate source for farm, forestry, wildlife, and aquatic-resource questions that go beyond what a satellite classification can show.
River geography gives the wetland pattern local meaning
Greene County’s official information page refers to the Warrior and Tombigbee rivers, and the county hazard-mitigation plan discusses major river and flood conditions. Those sources provide local context for a 2025 map in which wetland is the largest class and open water accounts for 3.21% in the forest-and-farmland summary. The extensive wetland color is therefore consistent with a county strongly influenced by river and floodplain environments.
Individual waterways are not labeled in the supplied thematic images, so a particular blue-green ribbon should not be named from color alone. A hydrography or topographic layer is needed for that. What the land-cover set supports directly is a broader observation: water-related cover is especially extensive in the west, southwest, and south, and it continues inland along branching paths between forest and fields.
The same caution applies to regulatory questions. A wetland-class raster cell is not a jurisdictional wetland boundary, and it does not establish a permit requirement. Site-level determinations can require current hydrology, soils, vegetation, survey information, and agency procedures. For a county overview, however, the 33.28% wetland share is a strong and useful characteristic because it distinguishes Greene County from a simple forest-and-farm landscape.
Hard surfaces remain concentrated in a few small centers
Fractional impervious surface measures the share of each cell covered by hard materials such as pavement and rooftops. Greene County’s mean imperviousness is 0.70%, while only 0.17% of the county is mapped at 50% or greater imperviousness. Those numbers are far below the 4.52% developed land-cover share because developed cells can still contain lawns, trees, soil, and other permeable surfaces.
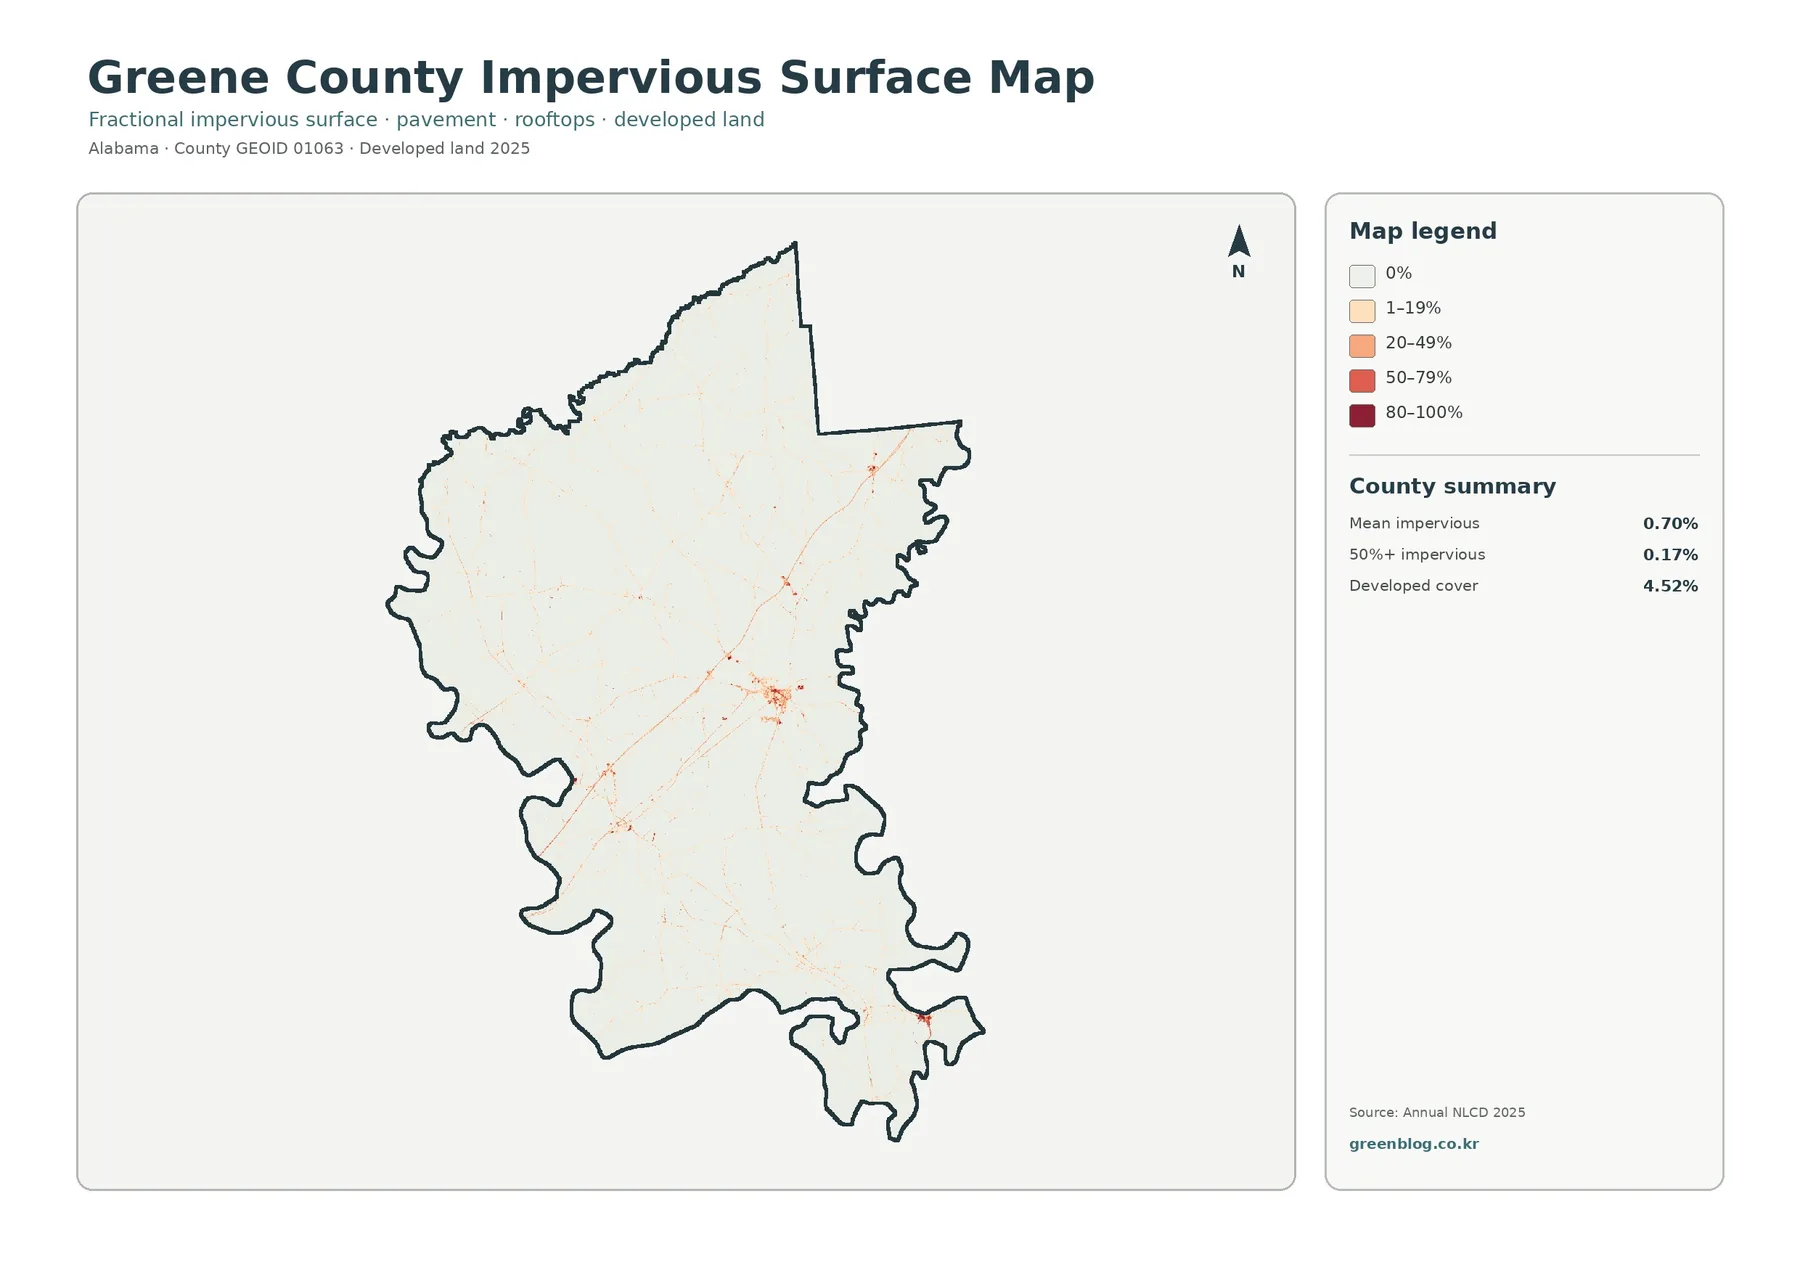
Most of the county is nearly white in the impervious view. The clearest dark concentration appears just east of center, with another small but distinct point toward the southeastern edge. Thin lines and scattered spots connect lesser concentrations. This distribution is more informative than the 0.70% average alone because it shows that the countywide hard-surface footprint is small but not evenly distributed.
Comparing this image with the general land-cover view also clarifies why “developed” and “impervious” are not interchangeable. A red developed cell can represent low-density settlement with substantial vegetation, whereas a darker impervious cell indicates a larger hard-surface fraction. The distinction matters when the maps are used to discuss settlement intensity or stormwater at a broad scale. The raster does not show storm drains, culverts, levees, runoff direction, or individual building footprints.
The 1985 and 2025 endpoints differ across many scattered cells
The change product compares the mapped class assigned to each cell in 1985 with the class assigned in 2025. Greene County’s supplied summary reports differences across 28.77% of the county. The named components are 0.77% to developed, 6.65% forest loss, 5.88% agricultural loss, and 14.30% other class difference. A wetland-difference color also appears in the legend, but no separate countywide percentage is supplied for it.
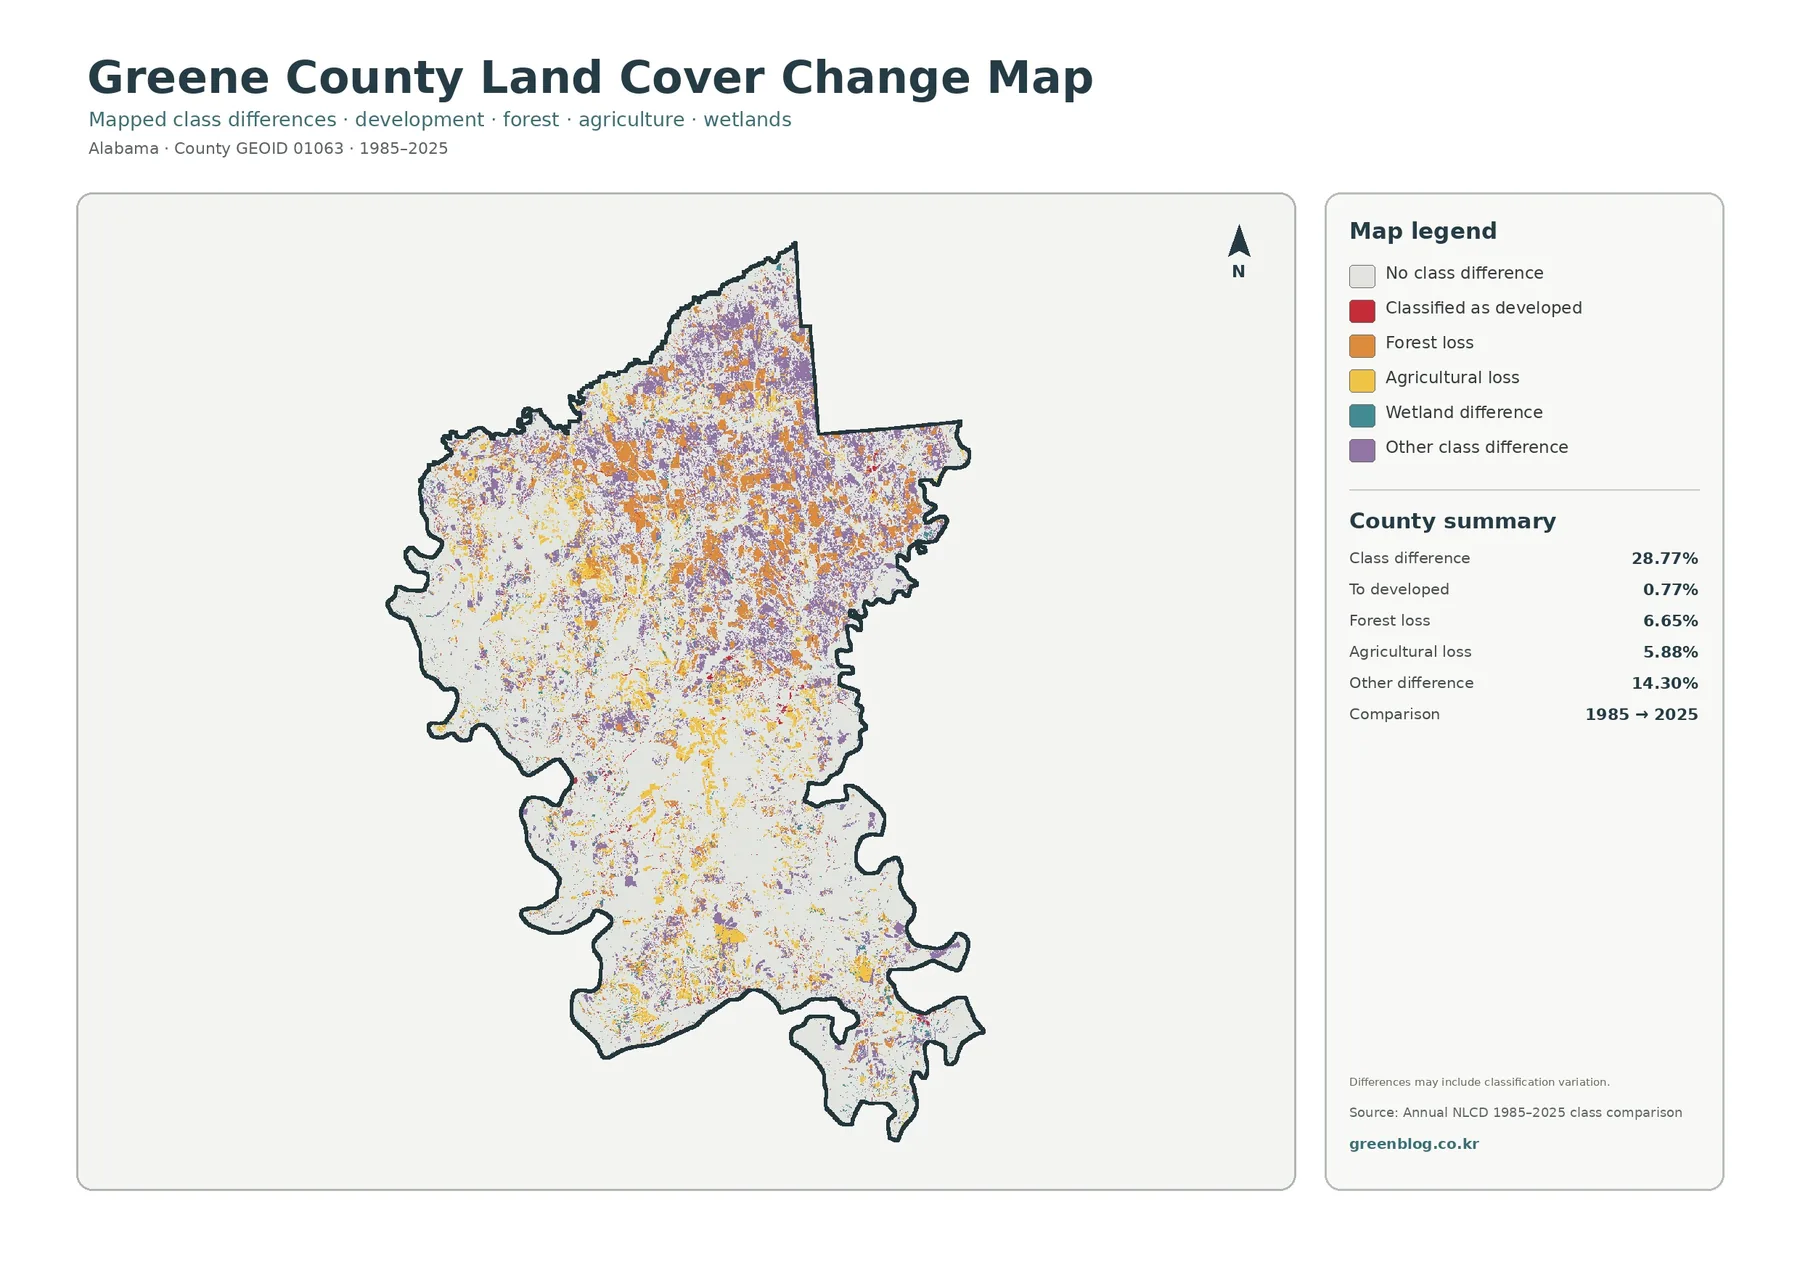
Orange, yellow, and purple cells are most numerous in the northern half, although smaller groups continue southward. Red to-developed cells are much less common and occur mainly near current developed areas or along narrow traces. The map therefore does not suggest that urban expansion dominates the endpoint differences. Forest loss, agricultural loss, and the broad “other difference” category account for much more of the highlighted area.
A different endpoint class should be treated as a flag for further checking, not as a complete history of what happened on the ground. Mixed pixels can contain trees, fields, roads, or wet ground in one 30-meter-class cell. Seasonal conditions, image quality, sensor differences, and classification methods can also change the assigned label. Real clearing, regrowth, farming changes, development, or wetland transitions may be present, but the two endpoints do not identify their cause or exact date.
For a historical project, the most informative follow-up is to inspect intermediate Annual NLCD years or historical aerial imagery in the areas where the difference colors cluster. Local forestry, agricultural, or planning records can then help distinguish a true land-cover transition from a classification change. This keeps the comparison useful without turning the 28.77% figure into a stronger claim than the source supports.
The percentages answer different questions and should stay separate
The four-map set works best when each percentage is tied to the measurement that produced it. Current developed cover is 4.52%, but only 0.77% is labeled to developed in the 1985–2025 endpoint comparison. Mean imperviousness is 0.70%, a third value that estimates hard-surface fraction. Likewise, forest covers 32.76% in 2025 while 6.65% is marked as forest loss in the endpoint comparison. None of these pairs should be subtracted to create a simple growth or loss rate.
The same rule helps when Greene County is compared with another county. Match 2025 wetland percentage with another 2025 wetland percentage, impervious mean with impervious mean, and the same 1985–2025 difference categories with one another. That approach makes a regional comparison clearer because each map is answering the same question on both sides.
Download the original Greene County JPG map set
The downloadable archive contains the four original Greene County JPG images at 2480 × 1754 pixels each. Their extent and orientation match, so a report or lesson can move from the overall 2025 cover pattern to rural cover, hard-surface concentration, and endpoint class differences without changing the county frame. The browser WebP images are previews; the ZIP supplies the original JPG files included with the package.
These images are well suited to reference graphics, presentation slides, worksheets, and comparative county profiles. The package identifies 2480 × 1754 as the original source resolution and does not mark the files as meeting a higher A3-resolution reference. Enlarging a JPG can increase its displayed size, but it cannot add geographic detail that was absent from the source.
A county raster cannot replace parcel or field data
Annual NLCD land cover is raster data: the county is divided into grid cells and each cell receives a representative class. At roughly 30-meter land-cover resolution, one cell can contain a narrow road, a field edge, trees, a small stream, or several surface types at once. A sharp color boundary in the image is therefore not a surveyed property line.
The current-cover maps summarize 2025 conditions. Construction, forestry activity, crop changes, flooding, or vegetation recovery after that observation year are outside the image. The historical product compares only 1985 and 2025 endpoints. A place that changed several times and later returned to its original class can appear unchanged, while a different endpoint class does not reveal when the transition occurred.
Land cover is also different from zoning, ownership, or legal land use. Agricultural color does not prove agricultural zoning; forest does not identify timber rights; developed cover does not establish a building right; and wetland cover does not replace a jurisdictional determination. Property, permitting, engineering, floodplain, and regulatory decisions need the appropriate current parcel, survey, agency, or field information.
Frequently Asked Questions
What is the largest land-cover class in Greene County?
Wetlands are the largest 2025 class in the supplied summary at 33.28%, narrowly ahead of forest at 32.76%. Agriculture covers 18.52%, developed land 4.52%, and grassland 3.91%. The map shows that wetlands are especially extensive in the west and south, while forest is more widespread in the north and east.
Why is developed cover 4.52% while mean imperviousness is only 0.70%?
They measure different things. Developed land is a categorical land-cover class and can contain lawns, trees, and other permeable ground. Imperviousness estimates the fraction of hard surface such as pavement and rooftops. Greene County’s mean impervious value is 0.70%, and only 0.17% of the county is at least 50% impervious.
Does 28.77% class difference mean that 28.77% of the county was physically transformed?
Not necessarily. It means that 28.77% of mapped cells have different classes in the 1985 and 2025 endpoint comparison. The map warns that classification variation may be included. Some differences may represent real land-cover change, while others can reflect mixed pixels, imagery conditions, or classification methods.
Map File Information
The ZIP contains four original Greene County JPG maps: 2025 land cover, forest and farmland, impervious surface, and mapped class differences from 1985 to 2025.
- File Type: ZIP containing four JPG images
Related Maps
- Autauga County Alabama Land Cover Map
- Baldwin County Alabama Land Cover Map
- Barbour County Alabama Land Cover Map
Sources and data notes
- MRLC Annual NLCD Data — official access point for Annual NLCD land-cover and developed-surface products.
- USGS Annual NLCD Land Cover Classification — official descriptions of the mapped land-cover classes.
- Greene County Commission: Information — county source for Eutaw, Black Belt agriculture, and the Warrior–Tombigbee river setting.
- Alabama Cooperative Extension System: Greene County — county office and specialists covering agriculture, forestry, wildlife, and aquatic resources.
- Greene County Multi-Hazard Mitigation Plan — county-specific river and flood context.
Green Map creates custom-edited map images using open geographic data sources such as geoBoundaries, Natural Earth, OpenStreetMap, and government open data.
These maps are edited visual materials, not raw data files, and are provided for education, documents, presentations, and graphic reference.