The Allegany County New York Land Cover Map set focuses on a rural landscape where forest covers most uplands while farms and small developed areas follow narrower valleys. Four views separate the broad 2025 land-cover pattern, forest and farmland, impervious and developed surfaces, and mapped differences from 1985 to 2025, making it easier to compare places that look similar on a single general map.
The four original JPG maps are available together in one download near the end of this page. Use the WebP previews for quick browsing, then save the JPG set for printing, classroom work, presentations, watershed discussions, or other projects that need a clearer county-scale reference.
Table of Contents
What stands out across Allegany County
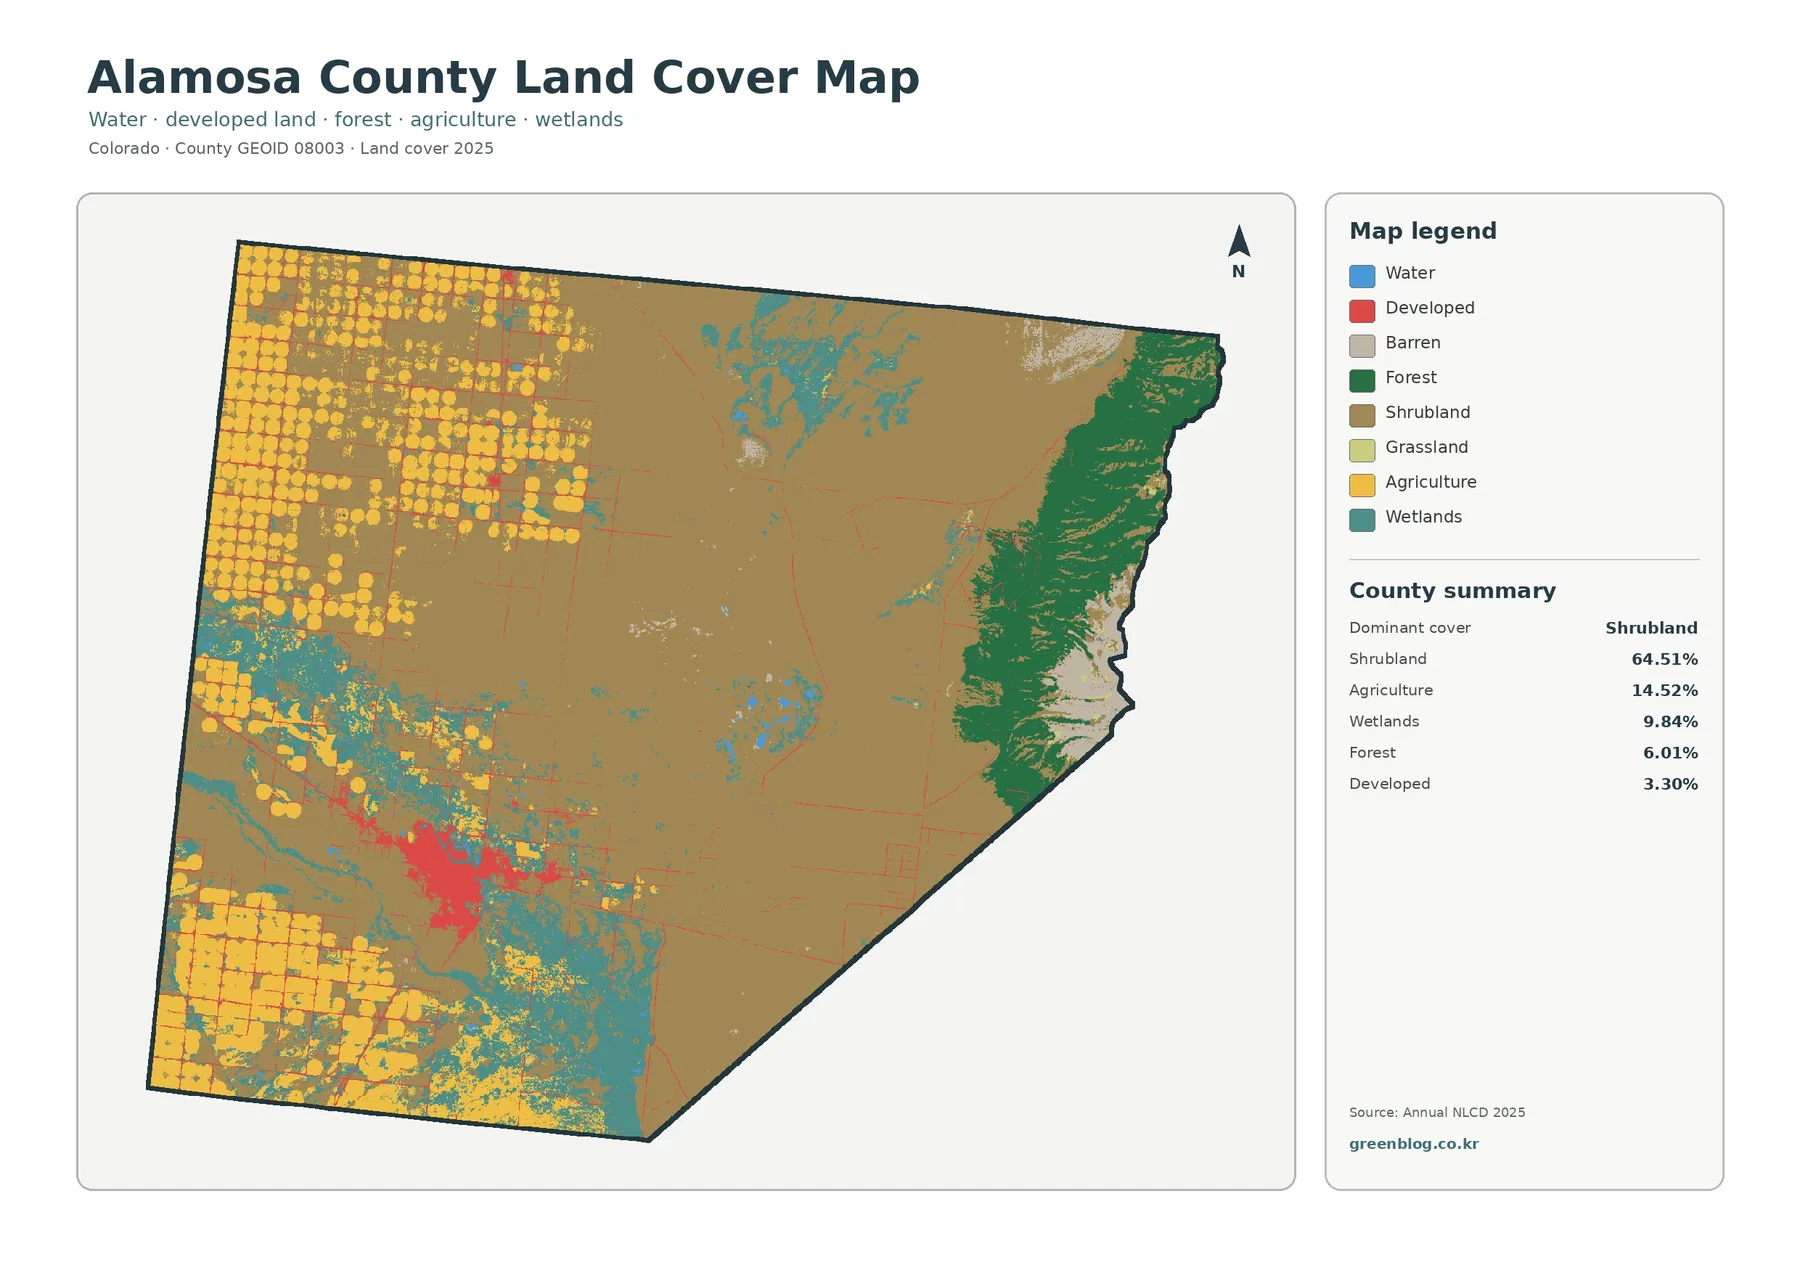
Forest is the dominant mapped cover in the supplied 2025 summary, accounting for 66.65% of the county. Agriculture follows at 23.32%, while developed cover is 7.52%. Wetlands make up 1.56% and water 0.33% in the same summary. Those percentages give a useful starting point, but the arrangement of the classes tells more about the county than the totals alone.
Agricultural cover does not form one broad plain. Instead, it appears in branching bands and irregular openings inside a much larger wooded landscape. Small developed areas often sit along those same lower corridors, especially where roads and settlements come together. The result is a county that reads as forested uplands surrounding working valleys rather than as an evenly mixed patchwork.
Land cover describes what is physically covering the ground in the classification, not who owns the land or what local zoning allows. A parcel may be legally residential, agricultural, or commercial while its mapped surface still includes trees, grass, pavement, buildings, or water. Keep that distinction in mind before using the maps for any parcel-level question.
Use the full land-cover map as the county overview
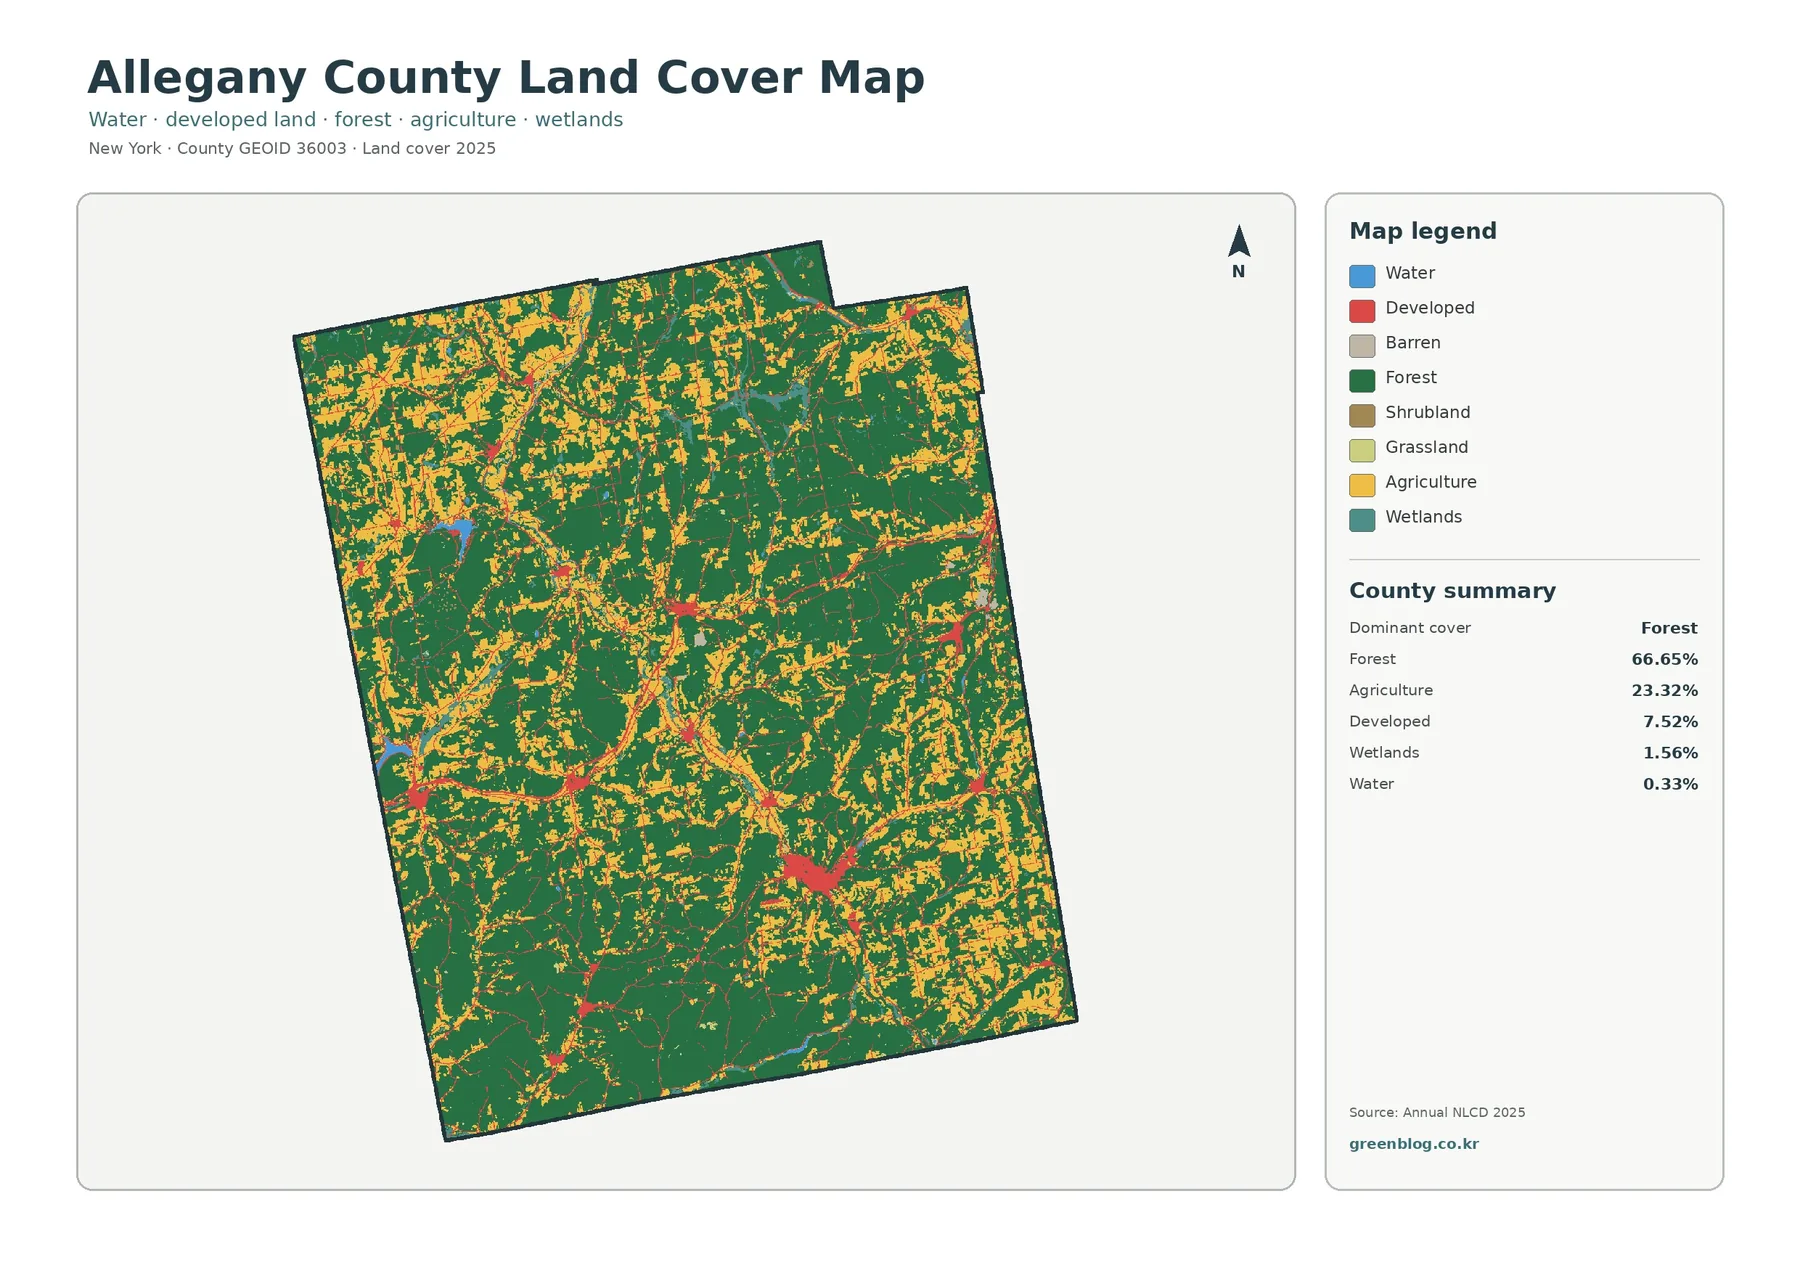
The complete map is the best place to establish the countywide pattern. Large forest areas dominate the view, while agricultural colors break through them along winding and branching corridors. Developed cover is much less extensive and appears in compact spots or narrow connections rather than as a continuous metropolitan footprint.
Water and wetlands occupy smaller shares, but they help orient the wetter parts of the landscape and add context to nearby forest and agriculture. At this scale, a narrow stream or small wetland may be simplified by the raster cells, so the map should be used to locate broad relationships rather than to draw a regulatory wetland edge or exact stream bank.
The full legend also prevents a common reading mistake. An open-looking area is not automatically farmland, and a developed class does not mean every square foot is paved. By checking the legend first, a reader can separate agriculture, forest, developed cover, water, wetlands, and smaller classes before moving to the more focused maps.
Forest and farmland make the valley pattern easier to see
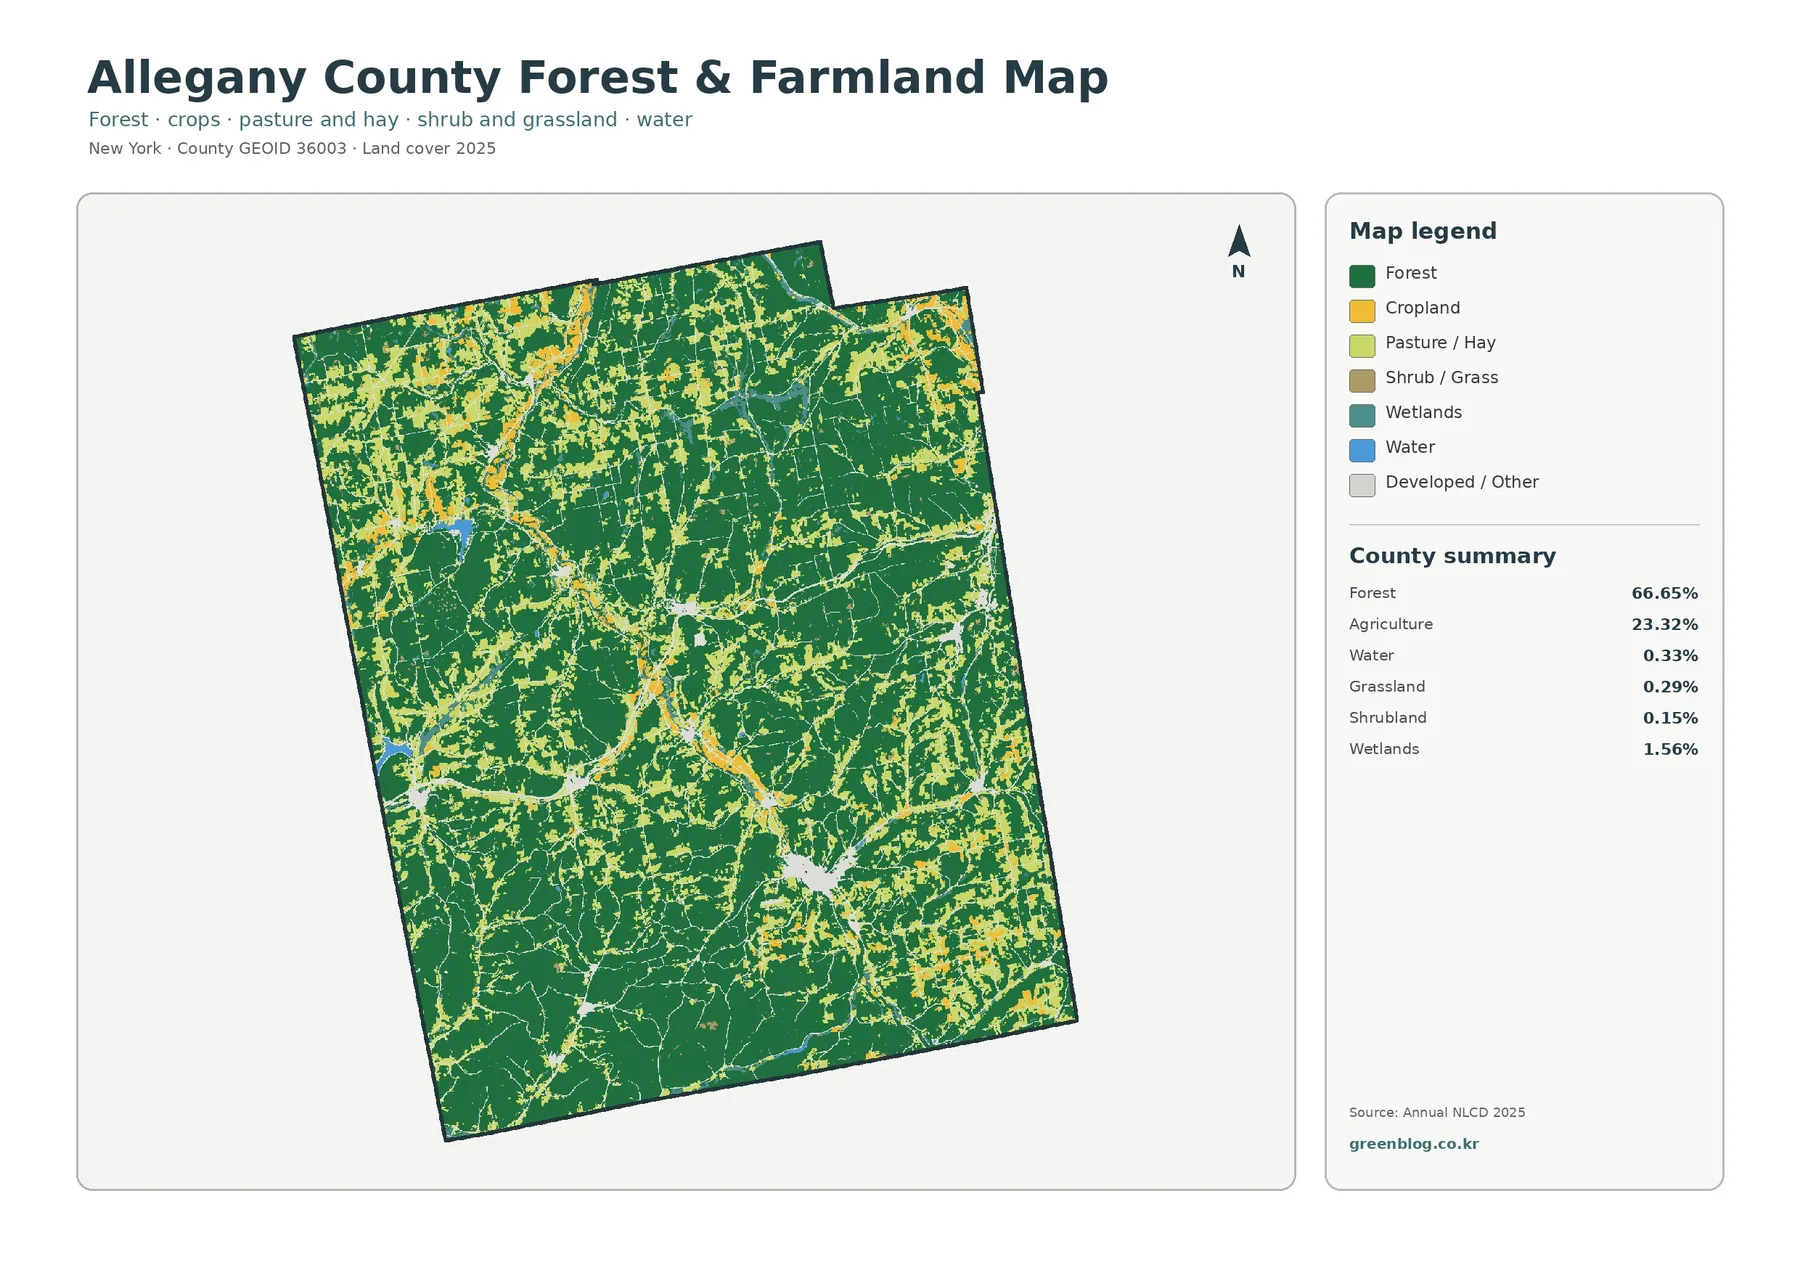
Removing most of the competing classes brings the forest-farm relationship into sharper focus. Agricultural land appears as long openings, forks, and scattered patches within connected wooded terrain. Some valleys contain wider stretches of open land, while others narrow quickly as forest approaches from both sides.
That variation is useful for studying rural landscape character. A classroom lesson can compare broad farm openings with smaller fragmented fields; a habitat discussion can look at the long edge where woods and fields meet; a watershed project can identify valleys where agriculture occupies a larger share of the visible land cover. The map does not explain why each field is where it is, but it clearly shows where farming and forest occur together.
Because agricultural areas are spread through several valleys, countywide percentages alone can be misleading. Two places may contribute to the same agriculture total while having very different local patterns. Looking at the shape and continuity of the openings helps distinguish a broad working valley from a narrow corridor or isolated field group.
Impervious surfaces reveal a small but concentrated built footprint
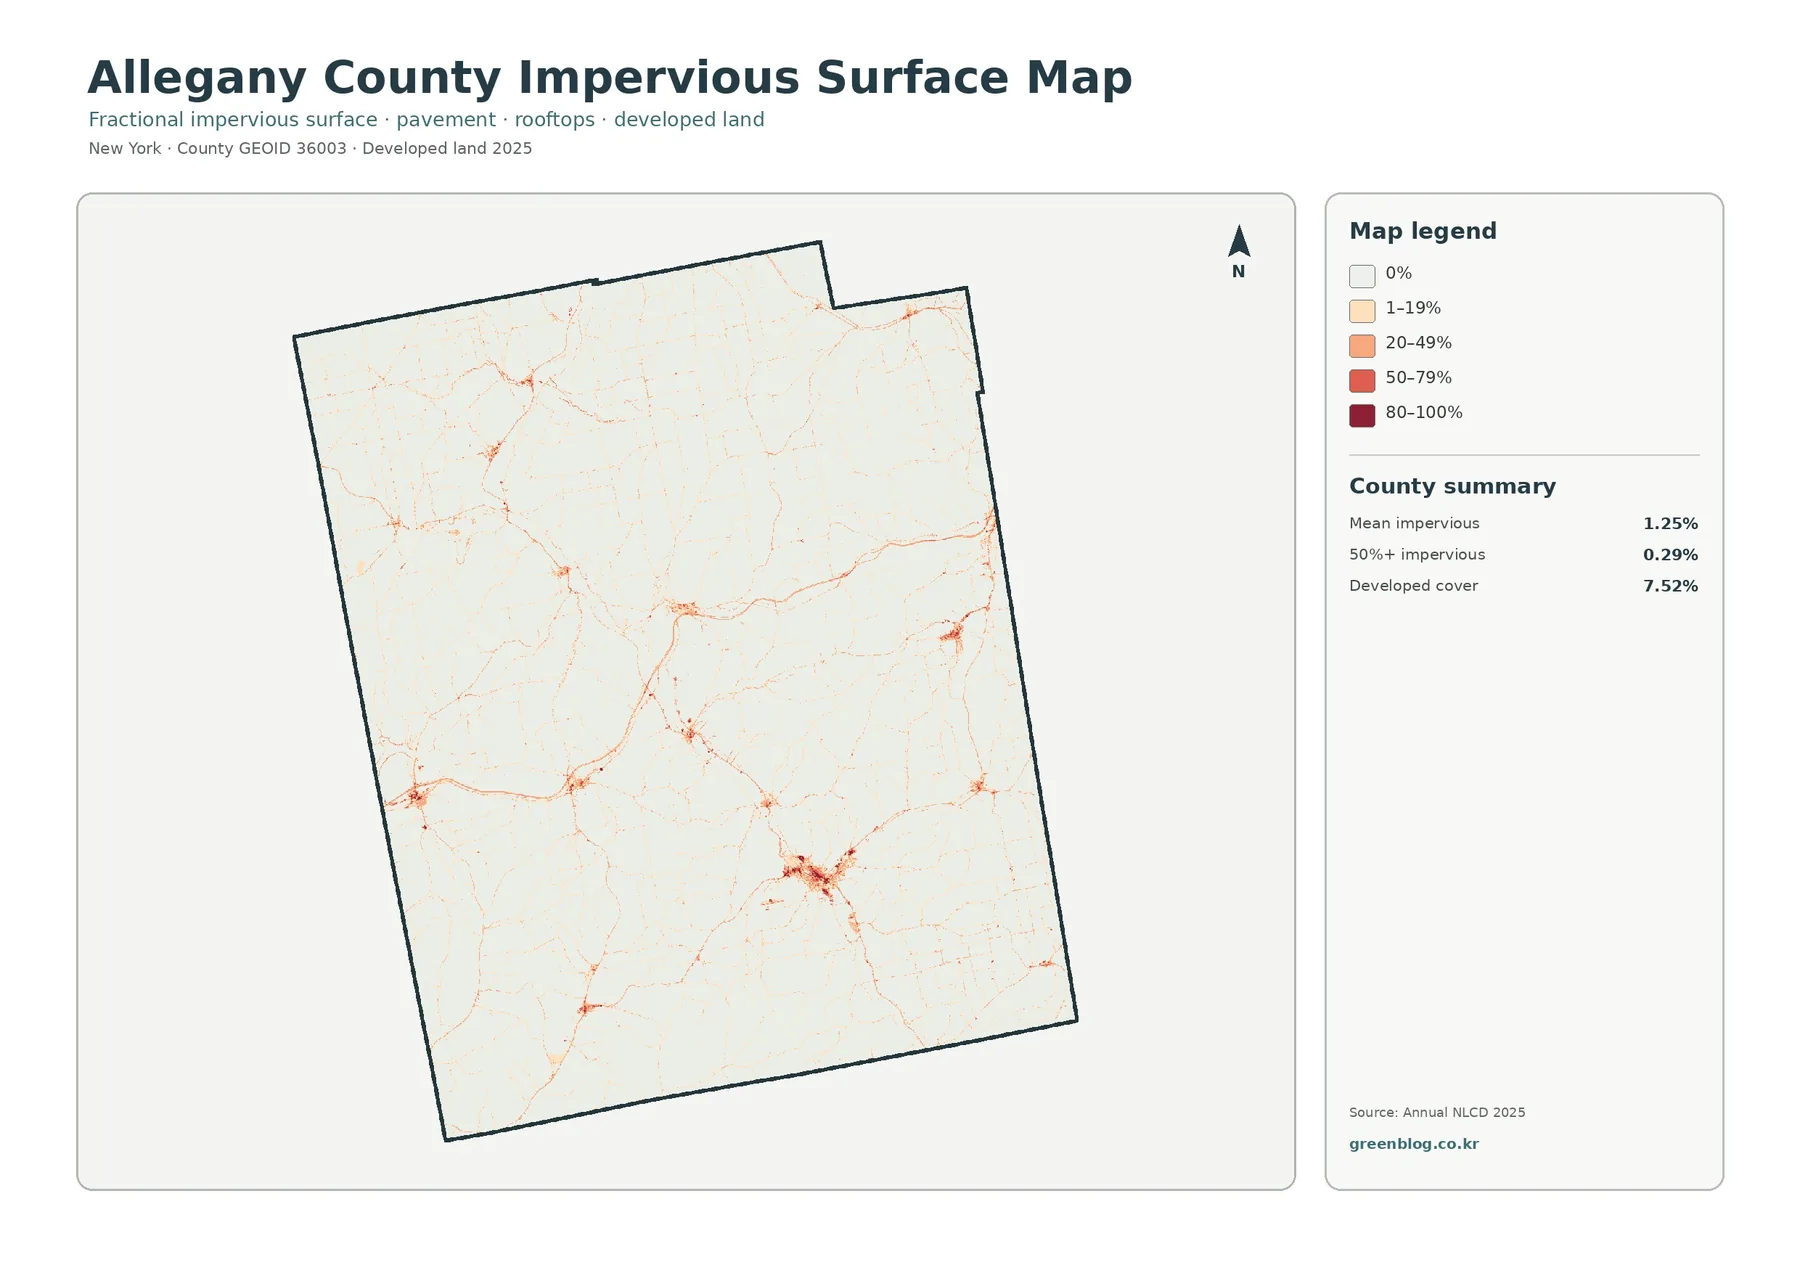
The impervious view is visually much lighter than the forest and farmland maps. The supplied summary reports mean imperviousness of 1.25%, with 0.29% of cells at or above 50% impervious surface. Developed cover is higher at 7.52%, which is expected because the developed land-cover classes can include lawns, trees, and other vegetation around buildings and roads.
Impervious surface means hard cover such as rooftops, pavement, and parking areas that water cannot easily soak through. That is different from developed land as a broader land-cover category. Reading both together helps separate a village or roadside developed area from the smaller portion that is actually dominated by hard surfaces.
In Allegany County, stronger impervious values tend to be compact or linear rather than widespread. Small settlement centers, road junctions, and connecting routes become easier to pick out against the rural background. Comparing the same locations with the forest-farm map can help answer whether an open corridor is primarily agricultural or whether the built footprint is becoming more noticeable.
The 1985–2025 change map points to places worth checking
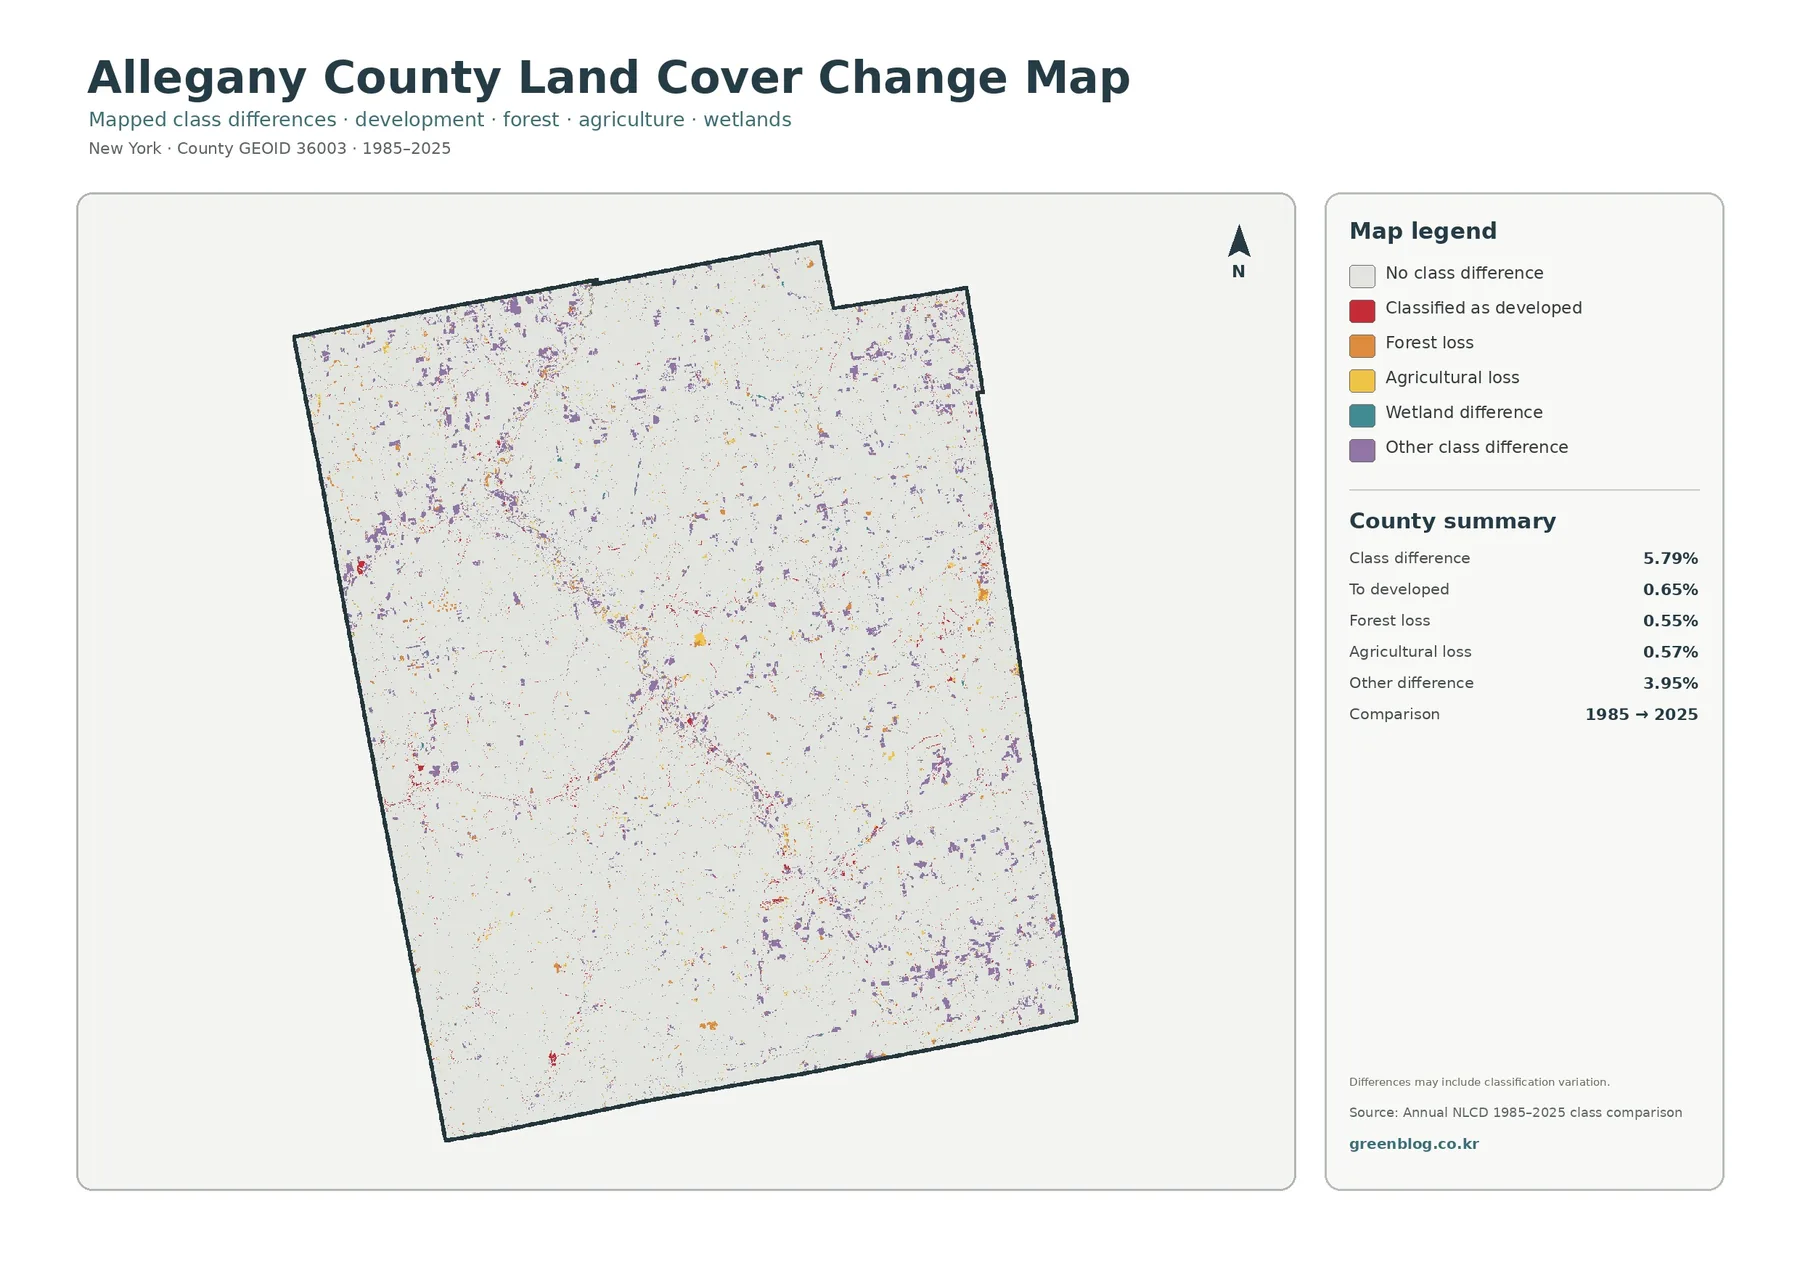
Change mapping serves a different purpose from the three current-condition views. The supplied summary lists 5.79% as total classification difference, including 0.65% mapped as change to developed cover, 0.55% forest loss, 0.57% agriculture loss, and 3.95% other differences. A colored change cell therefore means the classification differed between the compared dates; it does not automatically prove new construction or permanent conversion.
Across the county, changed cells appear as scattered points and small patches rather than one large continuous zone. Some occur near valleys and settlement areas, but many possible explanations exist. Harvest and forest regrowth, shifts in agricultural cover, actual road or building expansion, mixed pixels, imagery differences, and classification changes can all contribute to what appears on a comparison map.
Use this layer as a locator. After identifying a cluster, check aerial photography, another year of land-cover data, or county planning information to understand what happened at that site. This step is especially important before describing a change as development, forest clearing, or agricultural abandonment.
A simple workflow for comparing all four maps
Start with the complete map and choose a valley, settlement area, or forested section that interests you. Move to the forest-and-farmland view to see whether the open land is part of a larger agricultural corridor or only a small break in the woods. Then check imperviousness to see how much of the same area is associated with hard surfaces and developed cover. The change map can be used last to see whether any mapped classification differences overlap that location.
This sequence works well for presentations because each map answers a more focused question without forcing every class onto one page. The complete map explains the countywide setting, the forest-farm view emphasizes rural land cover, the impervious view isolates the built footprint, and the change layer identifies places that may deserve a closer look.
The set can also support environmental education, introductory watershed study, habitat comparisons, local geography projects, and planning-context discussions. It should not be used as a substitute for a parcel survey, zoning map, wetland determination, or legal land-use record. Those tasks require more detailed and authoritative local information.
Raster scale and classification limits
Annual NLCD products are useful because they apply a consistent classification across large areas, but every raster cell represents a piece of ground with one primary mapped class. A real location can contain trees, a driveway, grass, and a building inside the same cell. At county scale, that can simplify boundaries or hide narrow features.
Small streams, thin roads, individual buildings, and tiny wetlands are particularly easy to generalize. Change results also depend on the observation years and classification process. For that reason, these maps are strongest as county-scale references and comparison tools. When a decision depends on exact boundaries or recent site conditions, follow up with current aerial imagery, field information, or the appropriate county and state records.
Download the four Allegany County JPG maps
The download contains four original JPG files: the complete land-cover map, the forest-and-farmland map, the impervious-and-developed map, and the 1985–2025 land-cover change map. The files remain at the source resolution supplied with this package rather than being enlarged or re-encoded as artificial high-resolution images.
Choose the complete map for a general county overview, the forest-farm version for rural landscape comparisons, the impervious map for built-surface patterns, and the change map when you want to locate areas that differ between the two mapped periods. Keeping the four files together makes it easy to switch between them while working on the same place.
Frequently Asked Questions
What land cover dominates Allegany County?
Forest is the largest class in the supplied 2025 summary at 66.65%. The map also shows forest spread broadly across the county, with agricultural openings following multiple valleys inside the wooded terrain.
Why is developed cover higher than the impervious percentage?
Developed land cover can include vegetation around homes, roads, and other built settings. Impervious surface is narrower: it measures hard surfaces such as pavement and rooftops. A developed raster cell can therefore contain only a modest share of impervious material.
Does every change cell represent new development?
No. The change layer includes several kinds of classification difference, including forest loss, agriculture loss, change to developed cover, and other differences. Aerial imagery or additional years of data are needed to determine the cause at a specific location.
Map File Information
This ZIP contains the four original Allegany County JPG maps. It is the convenient version for saving, printing, classroom work, presentations, and map-based projects.
- Included Files: 4 original JPG land cover map files shown in this article
- File Type: JPG files in a ZIP archive
- Intended Use: Printing, education, presentations, and map-based projects
Related Maps
- Albany County Land Cover Map
- Bronx County New York Land Cover Map
- Broome County New York Land Cover Map
Sources and references
- MRLC Annual NLCD Data — Official access to Annual NLCD land-cover and related raster products.
- USGS Annual NLCD Land Cover Classification — Descriptions of the mapped land-cover classes and how the classification is organized.
- Allegany County Planning Reports — County planning material covering local land, agriculture, forest, and natural-resource topics.
- U.S. Census Bureau TIGER/Line Shapefiles — Official geographic boundary files commonly used in county mapping.
Green Map creates custom-edited map images using open geographic data sources such as geoBoundaries, Natural Earth, OpenStreetMap, and government open data. These maps are edited visual materials, not raw data files, and are provided for education, documents, presentations, and graphic reference.