Oregon’s 2024 ACS estimates show a strong concentration in the northwest. Portland is the state’s largest census place at 641,165 residents, while Multnomah County has 801,477 residents and the highest county-average density at about 1,859.5 people per square mile. Salem and Eugene each have roughly 179,000 residents, and Bend is the largest major place in central Oregon at 103,390.
The 2024 ACS 5-year estimates place Oregon’s population at 4,254,293 across about 95,997 square miles of land, for a statewide average near 44 people per square mile. That average masks an enormous internal range: Multnomah County exceeds 1,800 people per square mile, while Harney, Wheeler, Lake, Grant, and Gilliam counties are all below two people per square mile.
The comparisons below keep five measures separate: census-tract density, census-place population, county population, county-average density, and county population change from 2010 to 2020. Current population and density use 2024 ACS 5-year estimates, while historical growth uses the 2010 and 2020 decennial censuses.
Table of Contents
Portland anchors Oregon’s largest population concentration
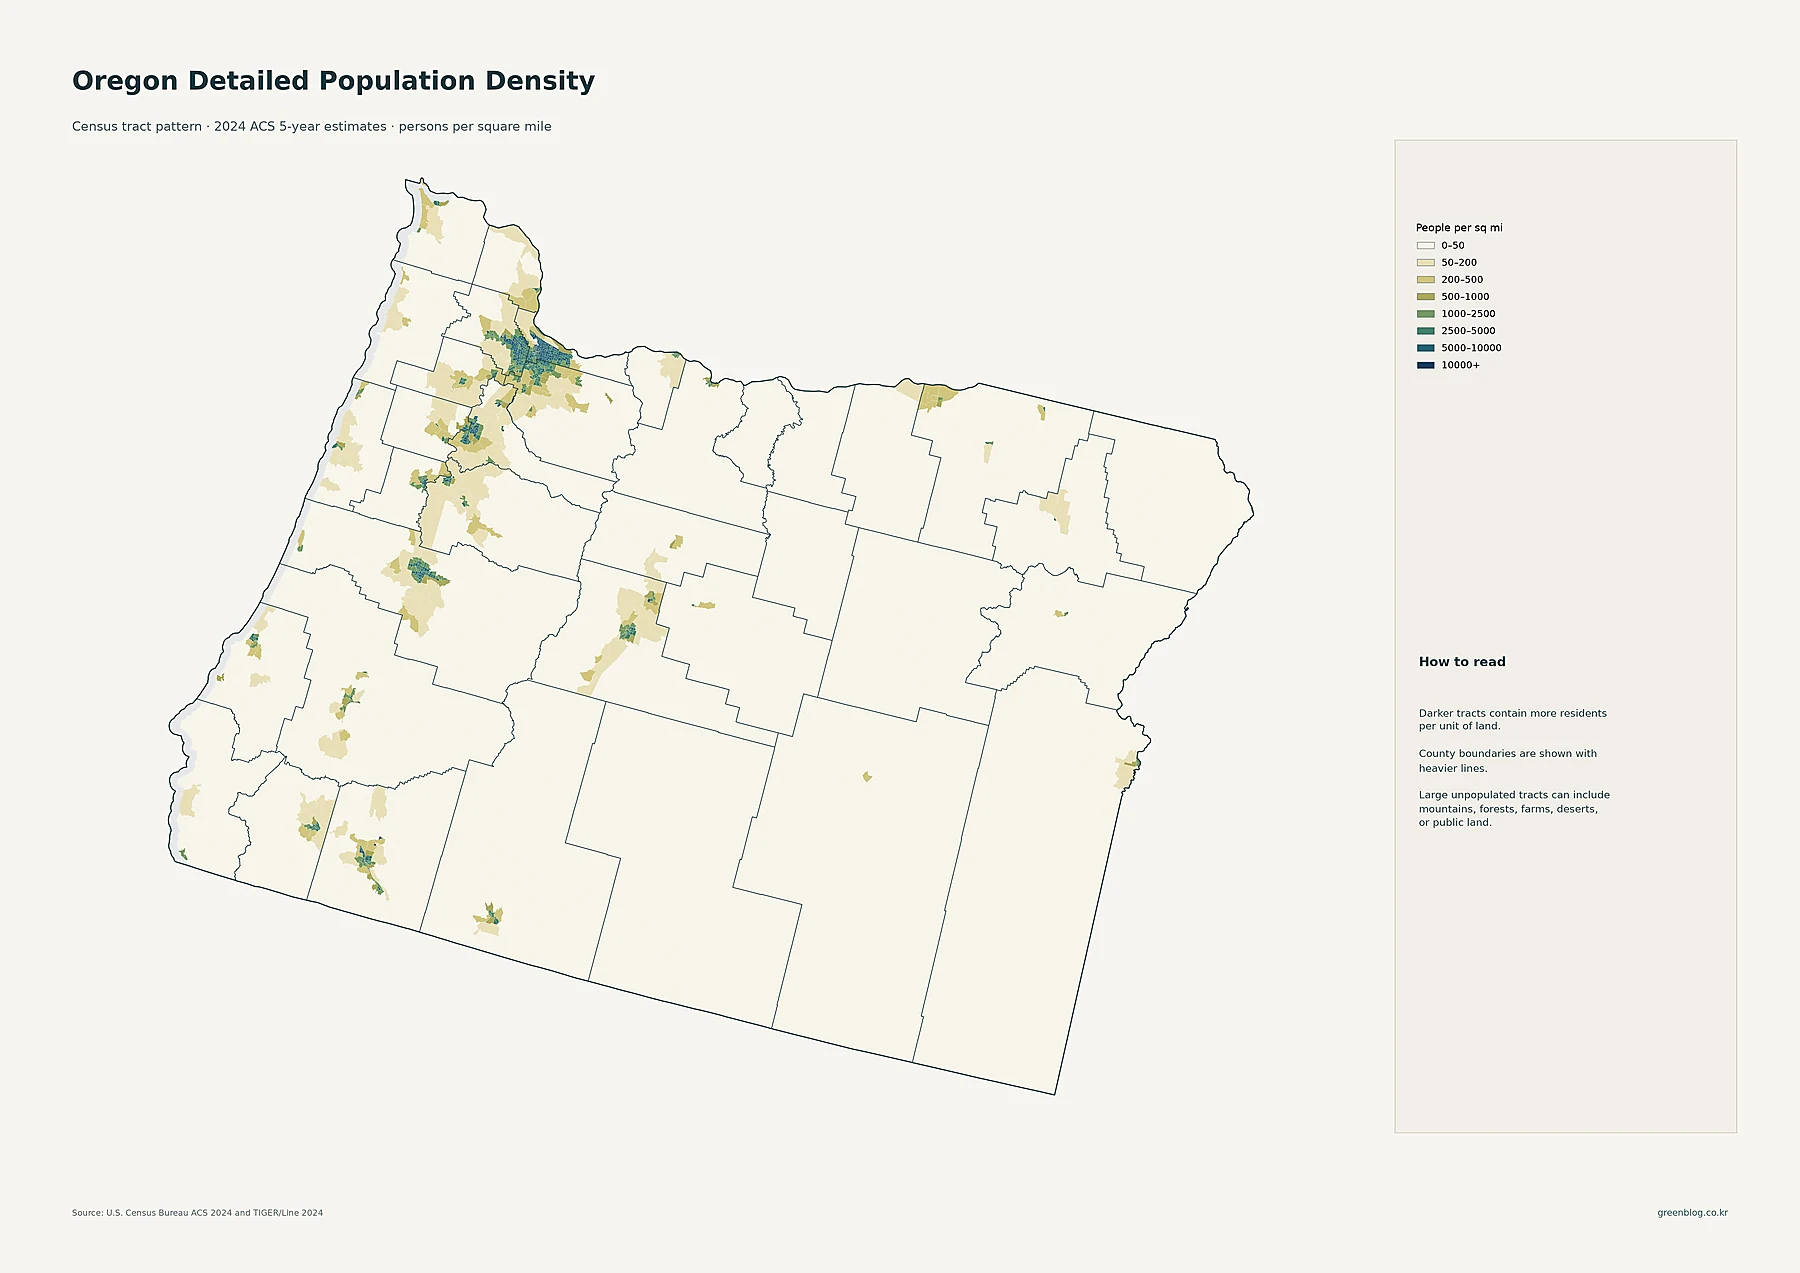
Portland has 641,165 residents, and nearby Gresham has 112,378, Hillsboro 108,231, Beaverton 97,812, Aloha 52,389, and Tigard 56,011. At the county level, Multnomah has 801,477 residents, Washington 603,947, and Clackamas 423,975. Those totals place the Portland area well ahead of any other population center in the state.
South of Portland, Eugene has 179,591 residents and Salem 178,865. Medford has 86,315, Springfield 61,499, Corvallis 59,960, and Albany 56,839. These place totals show that Oregon has several substantial western population centers even though none approaches Portland in size.
Central Oregon has a different scale. Bend has 103,390 residents and Deschutes County 206,334, while Deschutes County averages about 68.4 people per square mile. Farther east, county averages fall sharply: Harney is about 0.74 people per square mile, Wheeler 0.87, Lake 1.02, Grant 1.59, and Gilliam 1.64.
Portland’s place population is far larger than any other Oregon city
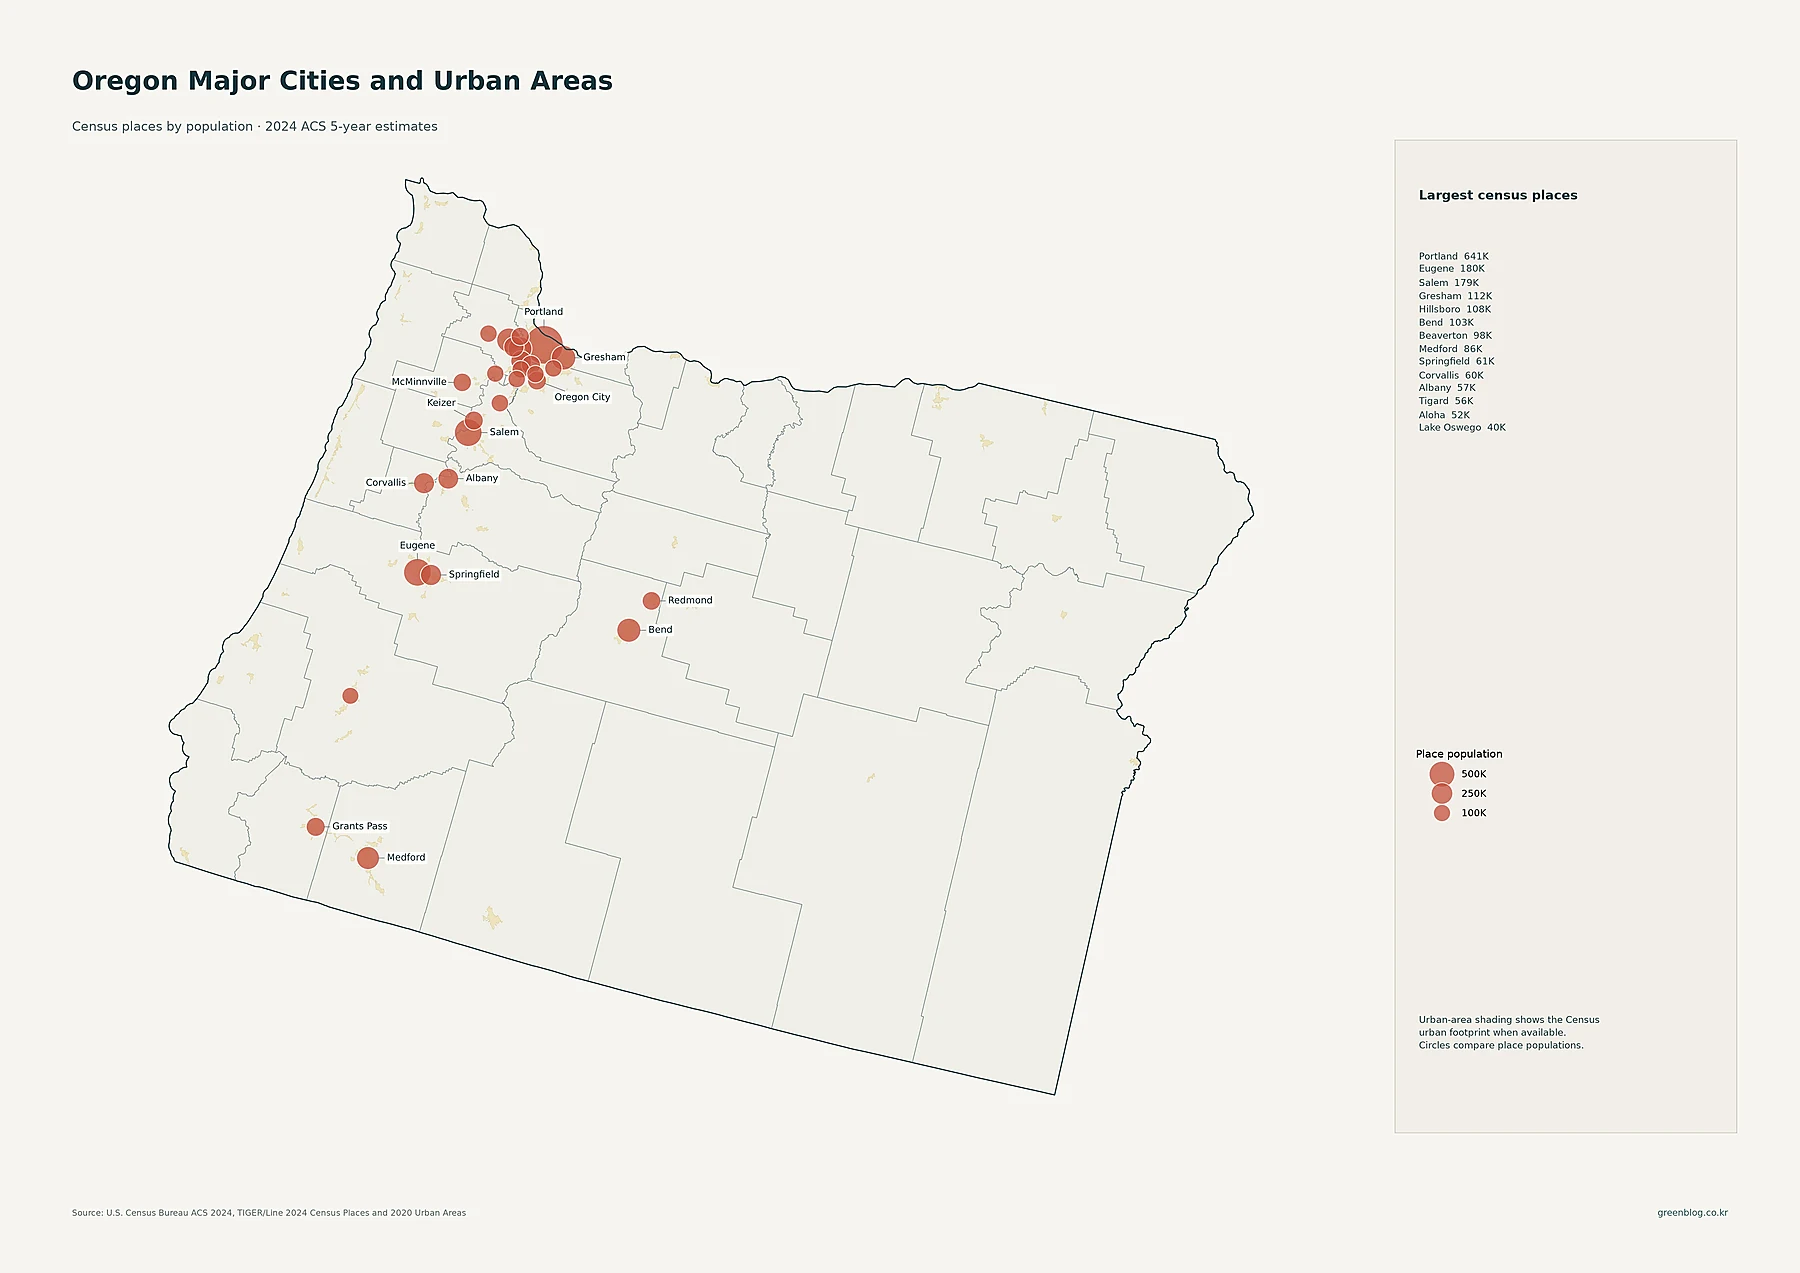
Portland has 641,165 residents in the 2024 ACS 5-year census-place estimates. Eugene is second at 179,591 and Salem is almost identical at 178,865. Gresham has 112,378 residents, Hillsboro 108,231, Bend 103,390, Beaverton 97,812, and Medford 86,315. Springfield has 61,499, Corvallis 59,960, Albany 56,839, Tigard 56,011, and Aloha 52,389. Lake Oswego, Grants Pass, Keizer, Oregon City, Redmond, and McMinnville form the next tier.
These are total place population figures, not density figures. Portland’s 641,165 residents make it the clear place-population leader, but density requires land area and must be evaluated separately. The ranking also shows that several of Oregon’s largest places are in or near the Portland area, while Eugene, Salem, Bend, and Medford anchor other parts of the state.
Bend is a useful example of why total population and density should remain separate measures. Its 103,390 residents place it among Oregon’s larger cities, while Deschutes County averages about 68.4 people per square mile, far below Multnomah County’s roughly 1,859.5.
Multnomah and Washington counties account for the two largest county populations
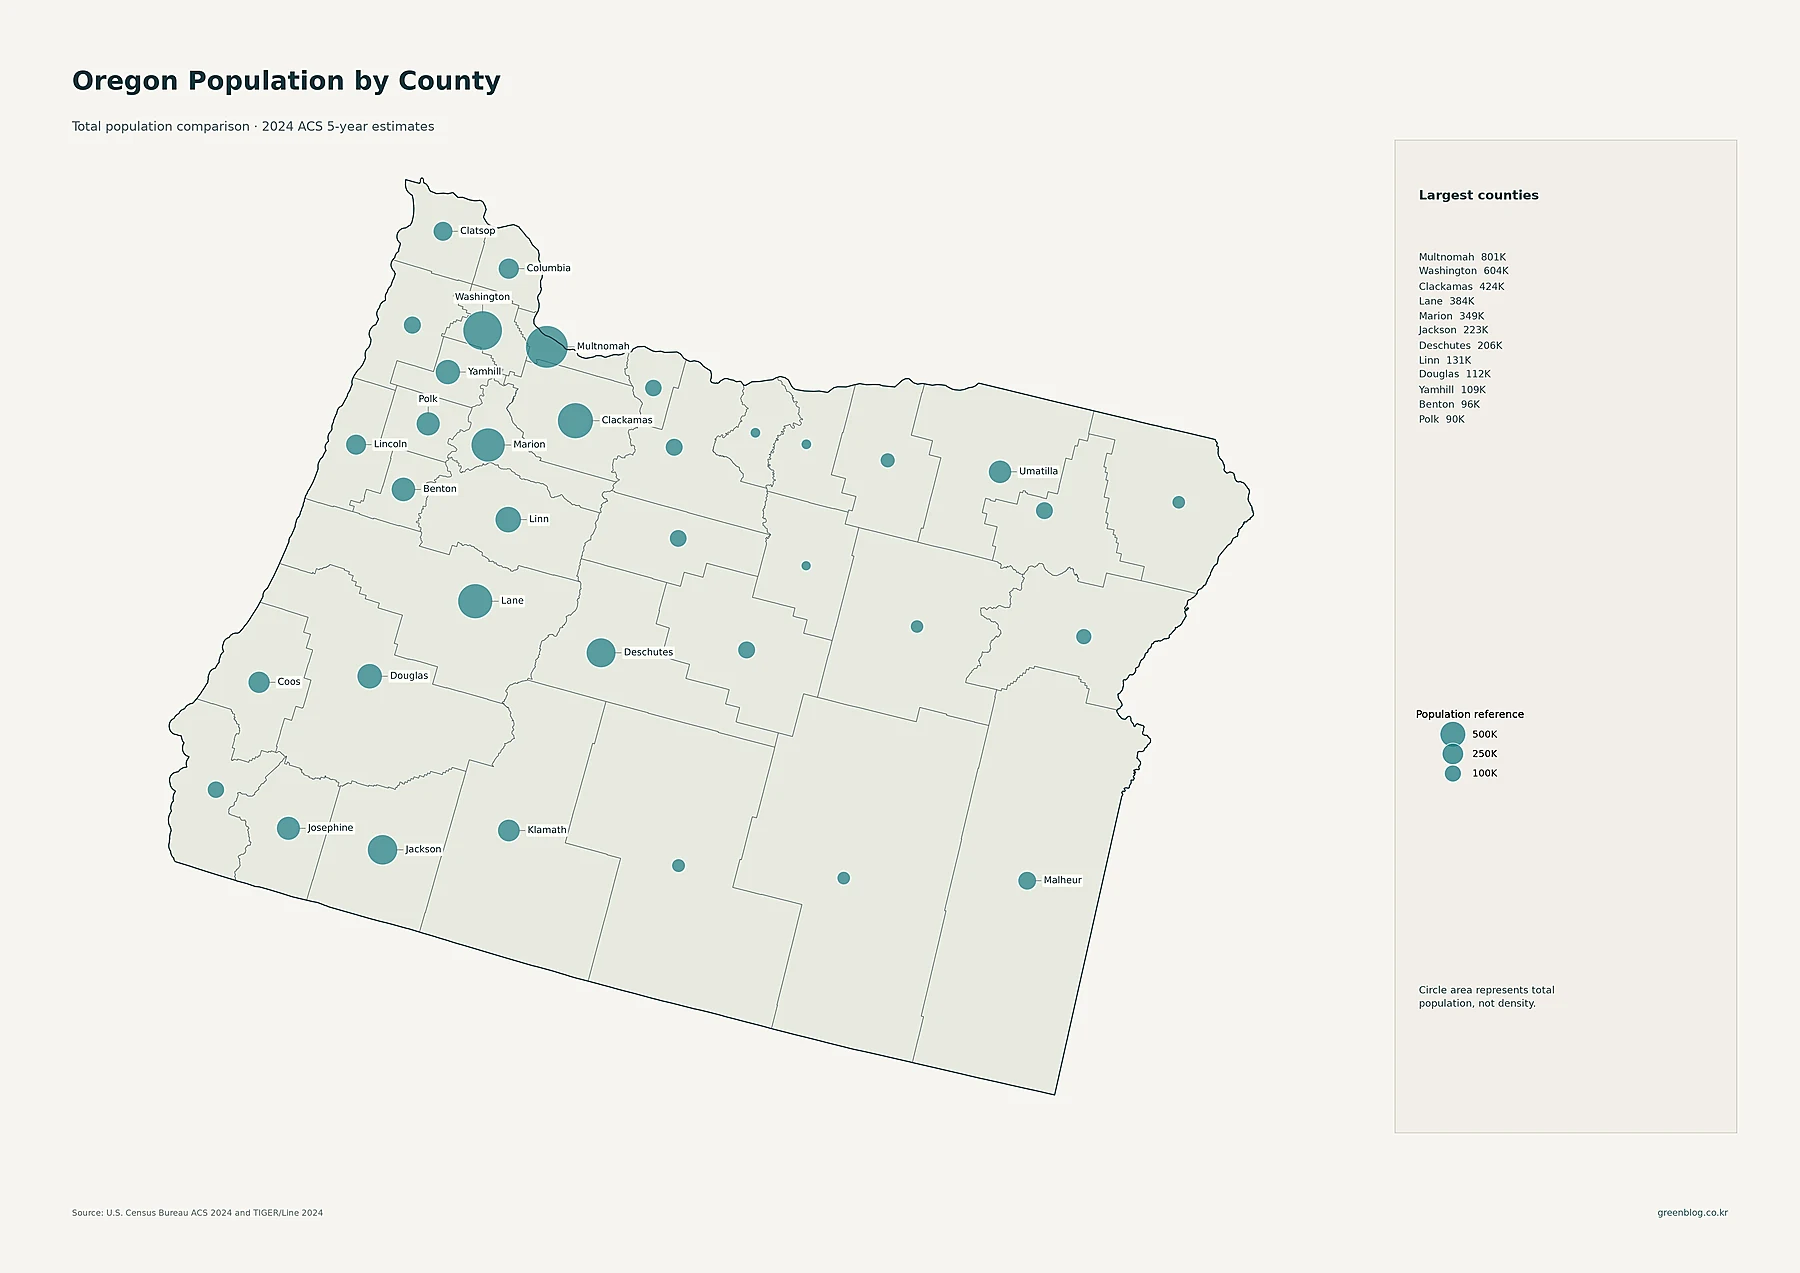
Multnomah County has 801,477 residents, the largest county population in the 2024 ACS 5-year estimates. Washington County follows with 603,947, and Clackamas County has 423,975. Lane County has 384,207 residents, Marion 349,244, Jackson 222,645, and Deschutes 206,334.
Linn County has 130,706 residents, Douglas 112,072, Yamhill 108,734, Benton 96,303, Polk 89,662, and Josephine 88,179. At the opposite end, Wheeler County has only 1,485 residents, Sherman 1,938, and Gilliam 1,971. The county totals therefore span from more than 800,000 residents to fewer than 2,000.
A large county population does not imply high density because density also depends on land area. Deschutes County, for example, has more than 200,000 residents but averages about 68.4 people per square mile, while Multnomah County averages roughly 1,859.5.
Multnomah is by far the densest county, while several eastern counties average fewer than two people per square mile
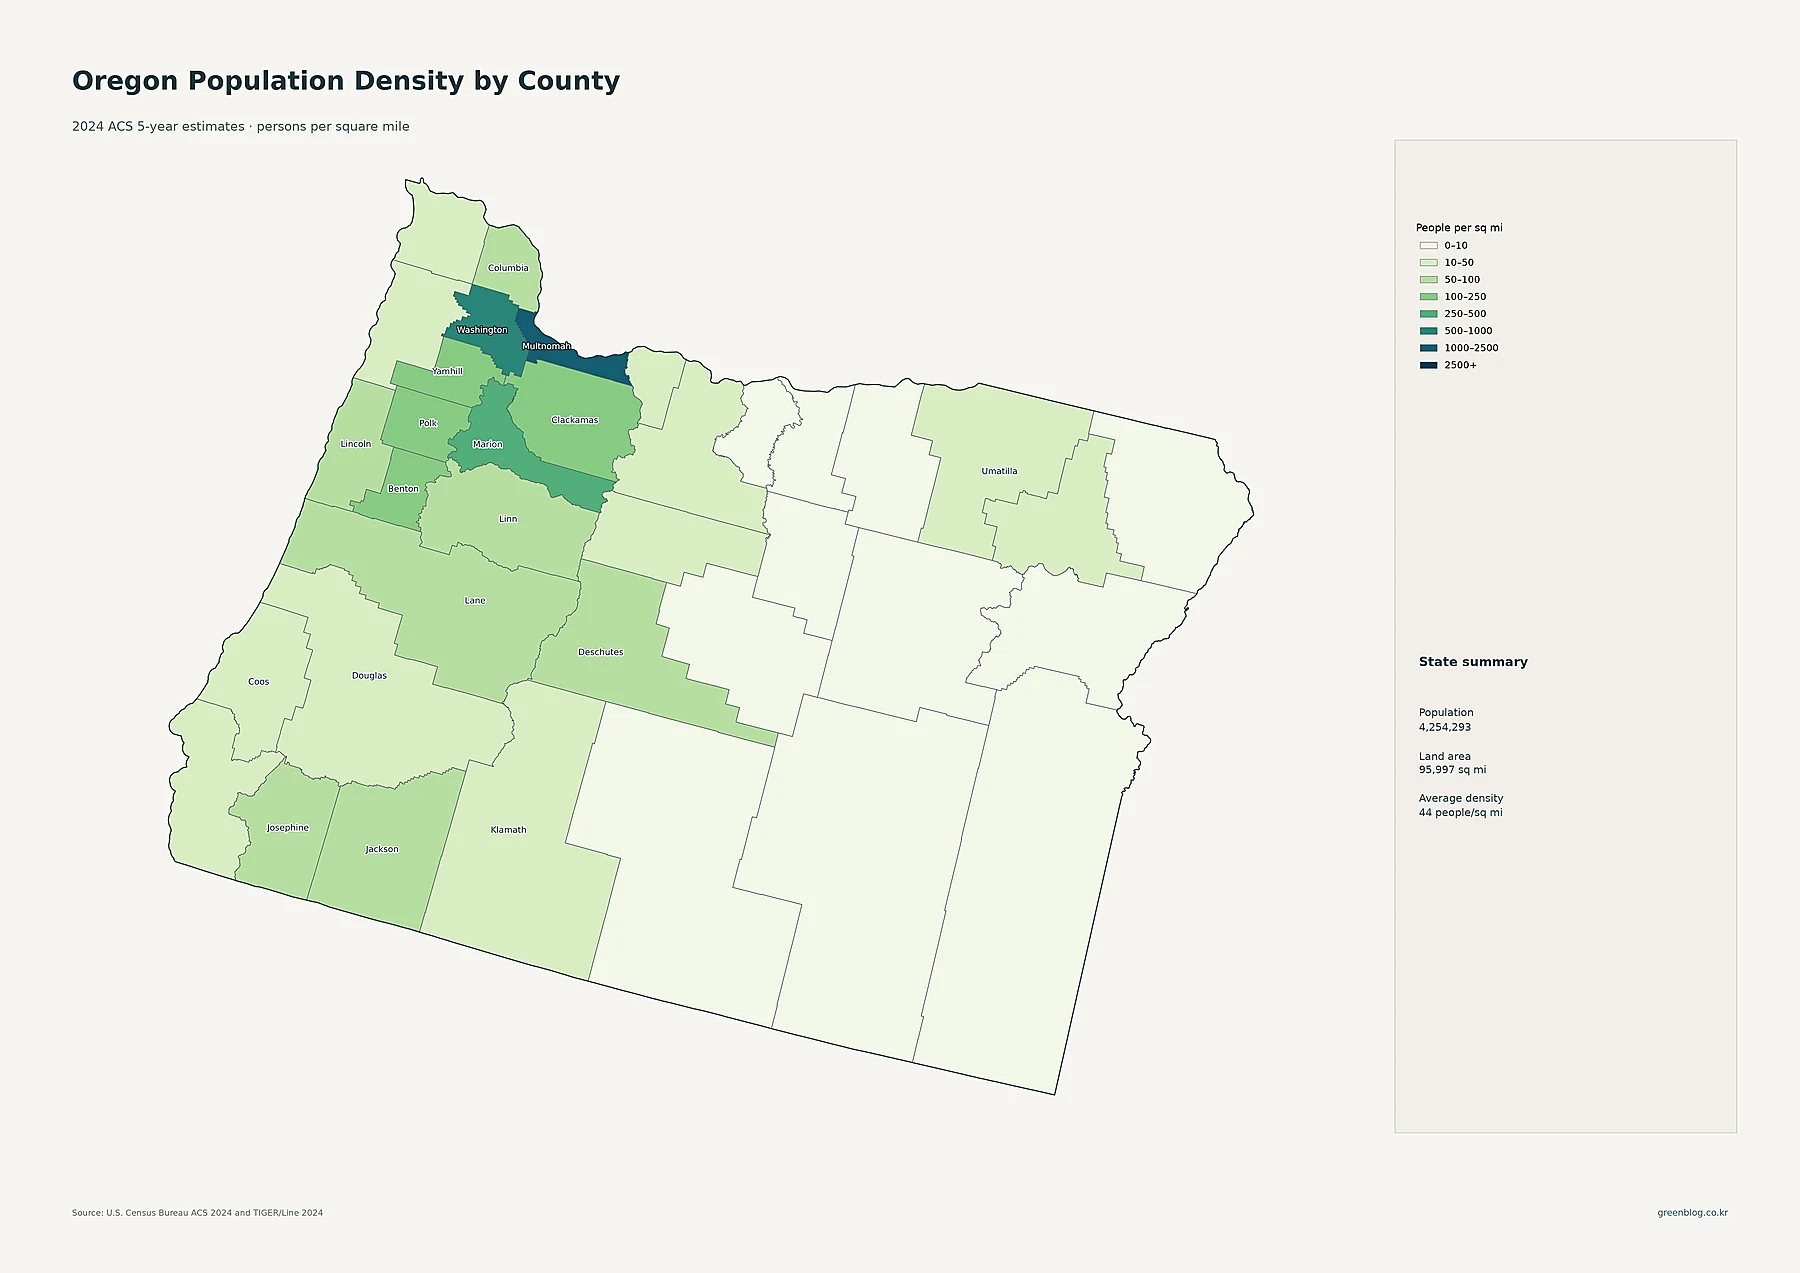
Multnomah County has the highest average density at about 1,859.5 people per square mile. Washington County is second at about 833.9. Marion averages about 295.8, Clackamas 226.6, Yamhill 151.9, Benton 142.6, and Polk 121.0. Lane is about 84.4, Columbia 81.2, Jackson 80.0, and Deschutes 68.4 people per square mile.
The sparsest county averages are dramatically lower. Harney County is about 0.74 people per square mile, Wheeler 0.87, Lake 1.02, Grant 1.59, and Gilliam 1.64. Multnomah’s county-average density is therefore more than two thousand times Harney’s. Oregon’s statewide average of about 44 people per square mile compresses this enormous internal difference into a single number.
| Measure | Leading area | Value |
|---|---|---|
| State population | Oregon | 4,254,293 |
| Largest county population | Multnomah County | 801,477 |
| Highest county density | Multnomah County | about 1,859.5/sq mi |
| Fastest 2010–2020 growth | Deschutes County | +25.7% |
| Largest 2010–2020 decline | Grant County | -2.8% |
Central Oregon led percentage growth during the 2010s
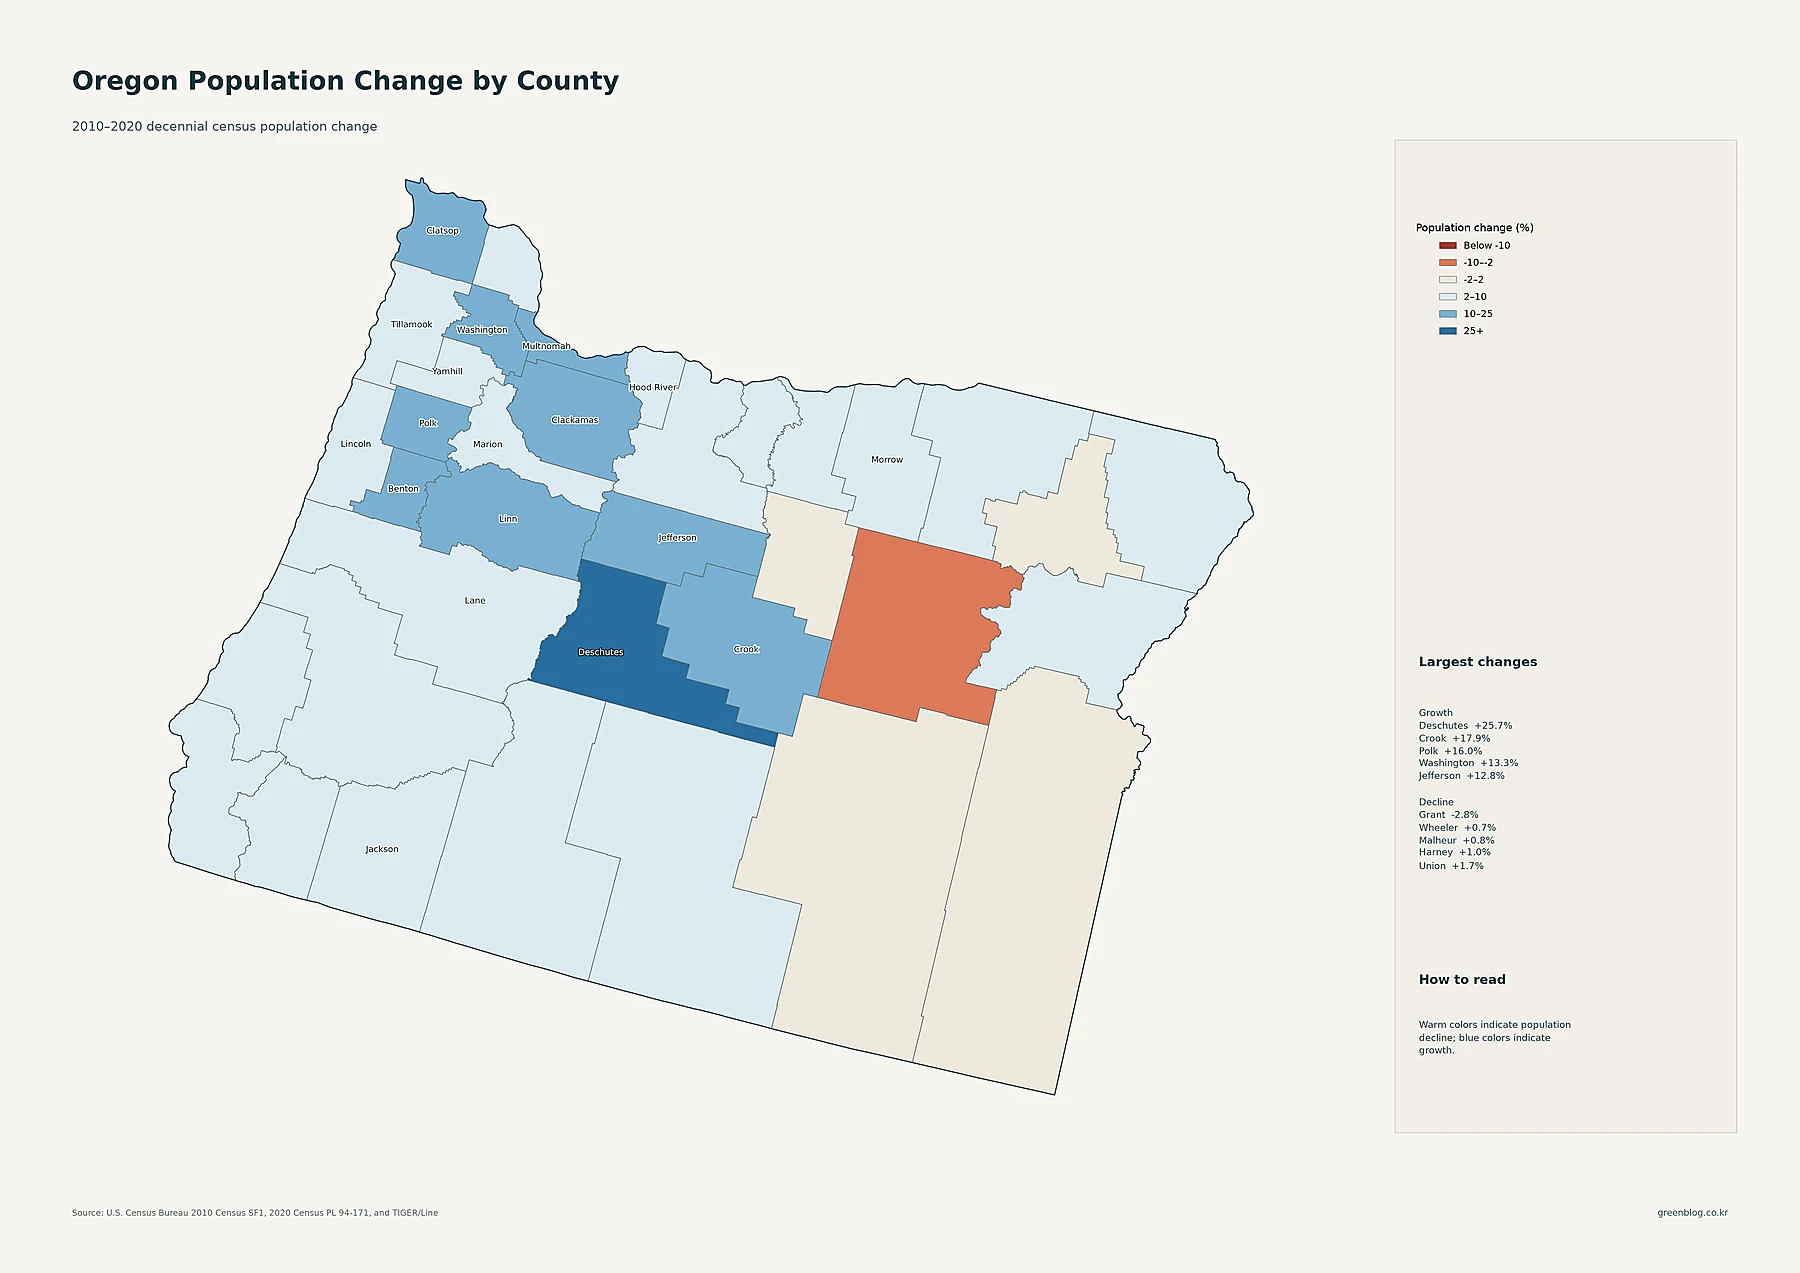
Deschutes County recorded the fastest percentage increase in the 2010–2020 decennial-census comparison. Its population rose from 157,733 in 2010 to 198,253 in 2020, an increase of about 25.7%. Neighboring Crook County grew from 20,978 to 24,738, or 17.9%. Polk County increased 16.0%, Washington 13.3%, Jefferson 12.8%, Clackamas 12.1%, and Benton 11.2%.
Multnomah County also grew substantially, increasing about 10.9%, but its percentage gain was well below Deschutes and Crook. Oregon’s current population center and its fastest-growing county during the 2010s are therefore different. Portland remains the state’s largest census place, while central Oregon recorded the strongest county growth rates in this comparison.
Grant County is the clearest decline, falling from 7,445 residents in 2010 to 7,233 in 2020, or about -2.8%. Wheeler grew only 0.7%, Malheur 0.8%, Harney 1.0%, and Union 1.7%. Most eastern counties in this comparison did not record major losses, but several changed very little. These percentages belong specifically to the 2010–2020 decennial-census period and should not be described as changes in the 2024 ACS estimate.
Oregon’s current population core and its fastest growth area are not the same place
The strongest conclusion from the data is the difference between concentration and growth. Portland is the largest census place, and Multnomah County leads both county population and county-average density. Washington and Clackamas add major population around that core. Salem, Eugene, Corvallis, Albany, Medford, and other western cities form additional population centers beyond the Portland area.
The historical census comparison points elsewhere for the fastest percentage growth. Deschutes and Crook in central Oregon grew faster than the large Portland-area counties during the 2010s. That is why place totals, county totals, county density, tract density, and historical change should remain separate measures. Together, they distinguish current population scale from decade-long growth.
Download the Oregon population map collection
The ZIP includes detailed census-tract density, major cities and urban areas, county population totals, 2010–2020 county population change, and county population density.
FAQ
Which Oregon county has the largest population?
Multnomah County is the largest in the supplied 2024 ACS 5-year estimates, with 801,477 residents. Washington County has 603,947 and Clackamas County 423,975.
Which Oregon county has the highest population density?
Multnomah County has the highest county-average density at about 1,859.5 people per square mile. Washington County is about 833.9 and Marion County about 295.8 people per square mile.
Which Oregon county grew fastest from 2010 to 2020?
Deschutes County grew about 25.7%, followed by Crook County at 17.9%, Polk County at 16.0%, and Washington County at 13.3%. These percentages compare the 2010 and 2020 decennial censuses.
Related Maps
Sources
- U.S. Census Bureau — American Community Survey (ACS): 2024 5-year population and density estimates
- U.S. Census Bureau — TIGER/Line Shapefiles: 2024 state, county, census tract, place geography and mapped boundaries
- U.S. Census Bureau — Decennial Census: 2010 and 2020 county population comparison
Green Map creates custom-edited map images using open geographic data sources such as geoBoundaries, Natural Earth, OpenStreetMap, and government open data. These maps are edited visual materials, not raw data files, and are provided for education, documents, presentations, and graphic reference.