Daingerfield, Sulphur River, and Southern Hills on a Morris County Texas Map

You can download four high-resolution A3 JPG maps of Morris County, Texas, in one ZIP directly from this page. The package includes a general county map, a ranked city map, a terrain-and-water map, and an elevation map. The supplied maps show Daingerfield, Lone Star, Naples, Omaha, roads labeled 30, 77, 67, 338, 144, 49, 259, and 11, the Sulphur River and White Oak Creek in the north, several Boggy and Village creek valleys through the interior, southern reservoirs, and an actual elevation range of about 70 to 187 meters.

Morris County is long from north to south, and the most useful first impression is the contrast between the Naples–Omaha area in the north and Daingerfield–Lone Star farther south. The northern boundary is strongly irregular where the Sulphur River and associated lowlands bend across the county edge. Moving south, the drainage becomes a network of narrow creek valleys, while the elevation map shows progressively stronger relief and the highest hills near the southeastern side.

Daingerfield and Naples provide two useful anchors for the long north-south county

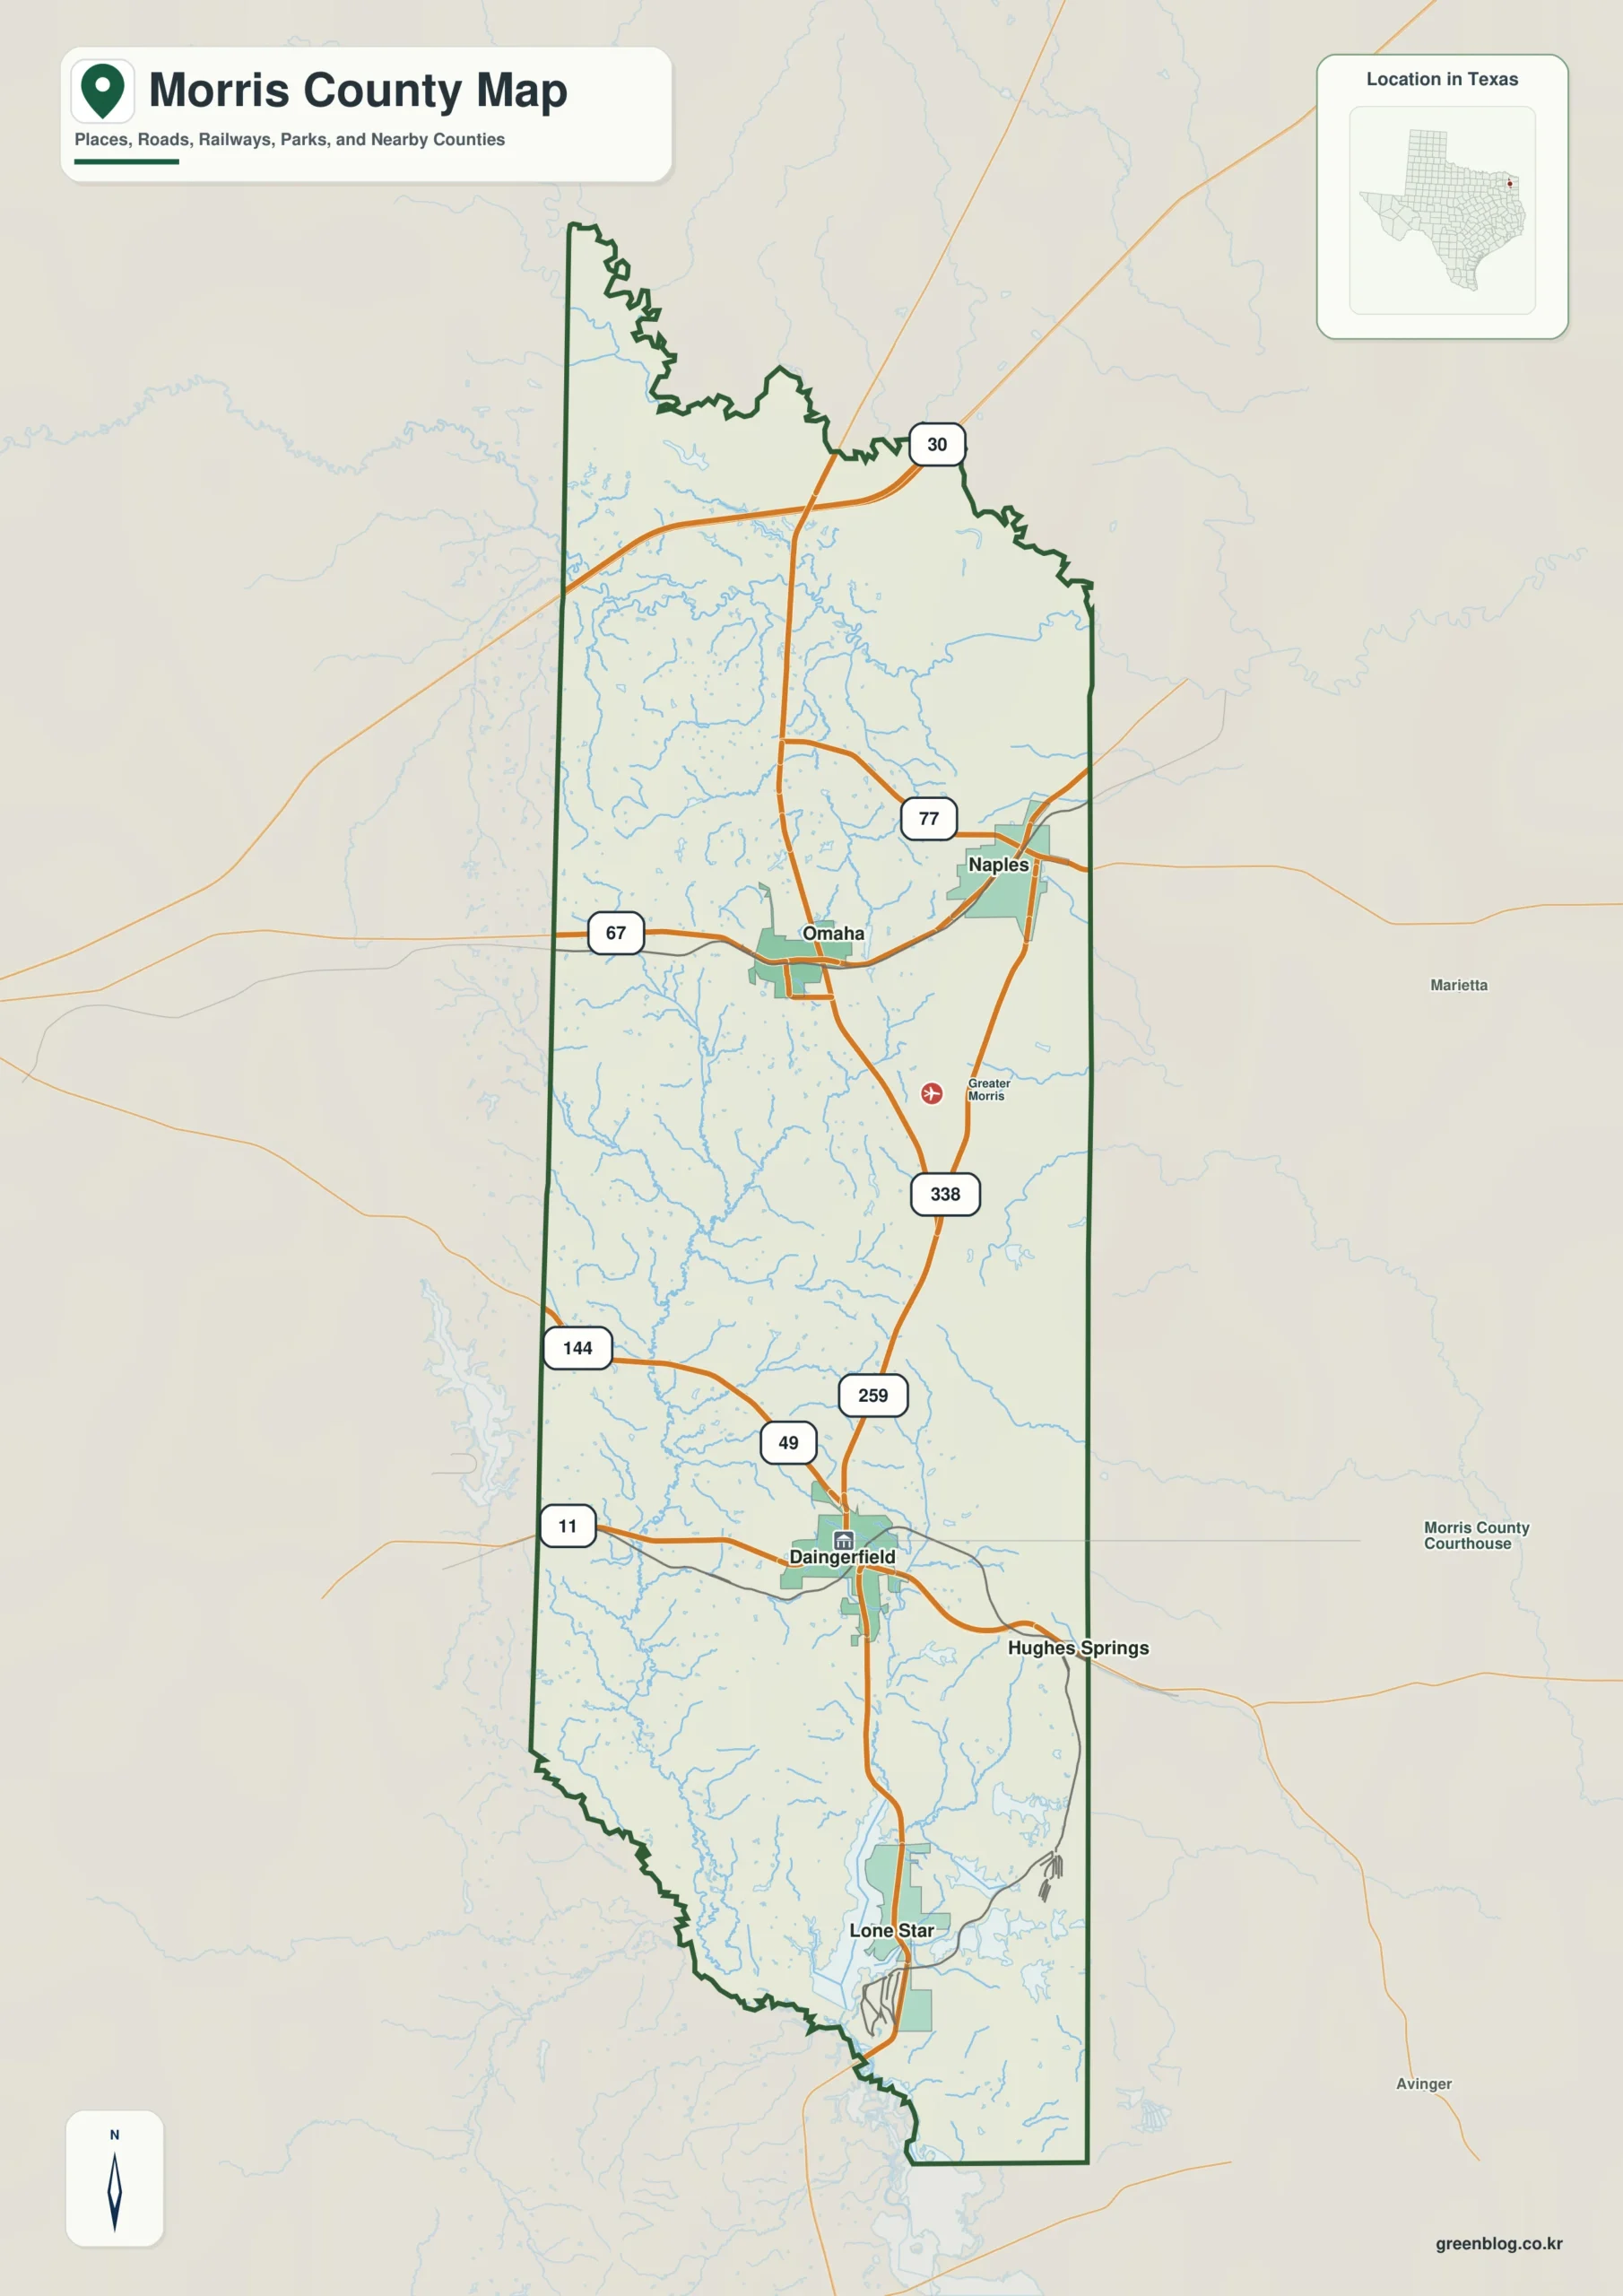
Daingerfield is the strongest settlement label in the southern half. Roads 49 and 259 meet close to the city, while Route 11 crosses the area from west to east and continues toward the Hughes Springs side. Lone Star lies farther south as a separate developed area. This gives the lower county a clear Daingerfield-to-Lone Star settlement pattern rather than one continuous urban strip.

Omaha appears farther north along Route 67, and Naples is northeast of Omaha near Route 77. Route 30 sits close to the northern boundary, Route 338 crosses the eastern interior, and Route 144 provides a central-western road reference. The numbered roads do not form one simple spine; they connect different settlement clusters across a county that narrows and widens around its river and creek boundaries.

The county outline itself is important. Its northern edge is highly irregular around the Sulphur River country, while the middle and lower portions form a much longer, narrower body. That shape makes the Naples–Omaha area feel geographically different from the Daingerfield–Lone Star side even before the elevation map is considered.

Morris County Texas map showing Daingerfield, Lone Star, Naples, Omaha, and roads 30, 77, 67, 338, 144, 49, 259, and 11
General Morris County map showing the northern Naples–Omaha area and southern Daingerfield–Lone Star area with the principal road references

The ranked city map makes the spacing among four communities easier to see

The city map ranks Daingerfield first, Lone Star second, Naples third, and Omaha fourth. The lower index also prints 2,529 for Daingerfield, 1,543 for Lone Star, 1,412 for Naples, and 1,316 for Omaha. The supplied image does not identify a year for those values, so this article treats them only as figures shown by the map rather than confirmed current population counts.

Location is more useful here than ranking. Naples and Omaha sit relatively close together in the upper part of the county. Daingerfield is much farther south, and Lone Star lies below it near the lower end. With the detailed roads removed, the gaps among those settlements become much easier to understand.

Bowie County is labeled north of Morris County, Cass and Red River counties to the east, Marion County to the southeast, and Titus, Camp, and Upshur counties to the west and southwest. Those surrounding names make the narrow north-south orientation easier to place within northeast Texas. The ranked city layer is therefore most useful as a settlement-spacing map rather than as a current population table.

Morris County city map ranking Daingerfield, Lone Star, Naples, and Omaha
Ranked city map showing Daingerfield, Lone Star, Naples, and Omaha at different points along the county’s north-south length

Sulphur River and White Oak Creek define the low northern water landscape

The Sulphur River is the clearest large water reference near the northeastern boundary. Its winding course helps explain the irregular shape of the upper county. White Oak Creek approaches from the west across the northern interior and occupies another broad low corridor before reaching the eastern side.

Dunlap Lake and Brossco Lake are labeled near the White Oak Creek area. Black Creek and Village Creek provide additional named drainage references below it, with Village Creek extending southward through the upper-middle interior. Numerous smaller tributaries branch into these channels, so the northern half contains much more drainage detail than the road map initially suggests.

Boggy Creek and the southern reservoirs organize the lower half

Boggy Creek forms a long central drainage line, and Little Boggy Creek joins from the northwest. Okry Creek is labeled farther east, while Brutons Creek continues through another long eastern-central valley. These waterways divide the middle of Morris County into a series of low corridors separated by small hills.

Ellison Creek Reservoir and Barnes Creek Reservoir are labeled close together in the southern portion. Minor Lake appears farther east in the middle of the county. Welsh Reservoir is visible outside the western boundary as a regional reference, but the article keeps its main description focused on the water features mapped within Morris County.

The terrain-and-water map is intended for geographic reference. It can help locate the Sulphur River, White Oak Creek, Boggy Creek, Village Creek, named lakes, and reservoirs relative to the county boundary, but it is not a flood-hazard map, legal water-boundary product, parcel map, or navigation chart. For roads and settlement access, compare the same area with the general county map.

Morris County water map showing Sulphur River, White Oak Creek, Village Creek, Boggy Creek, Little Boggy Creek, and southern reservoirs
Terrain-and-water map showing the Sulphur River and White Oak Creek in the north, Boggy and Village creek valleys through the center, and southern reservoirs

Low northern river country gives way to higher southeastern hills

The elevation map reports an actual range of about 70 to 187 meters and a mean elevation of about 104 meters. Dark green terrain dominates the northern boundary and the Sulphur River–White Oak Creek area, placing those waterways among the lowest parts of the county. Elevation increases through the center, and the strongest brown relief is concentrated in the southeast.

The middle of the county alternates between small ridges and narrow low valleys. Village Creek and Boggy Creek correspond to green corridors extending through higher yellow and tan terrain. Matching the water and elevation maps shows that the named channels are following real low ground rather than simply crossing a uniform surface.

Relief becomes more pronounced around and south of Daingerfield. Lone Star lies in the lower part of the county where hills and creek valleys are more tightly packed, and the southeastern edge contains the highest large area on the map. Ellison Creek Reservoir and Barnes Creek Reservoir sit within lower drainage terrain surrounded by stronger relief.

The difference between the displayed minimum and maximum elevation is about 117 meters. Morris County is not a mountain landscape, but that range is enough to produce a clear transition from northern river lowlands to southern and southeastern hills. The elevation layer is best used for relative terrain comparison rather than survey-grade or engineering-grade measurement.

Morris County elevation map showing an actual range from about 70 to 187 meters and a mean of 104 meters
Elevation map showing low northern Sulphur River country, central creek valleys, and the higher hills concentrated toward the southeast

Following the county south from Naples reveals the strongest landscape change

Start near Naples and Omaha in the north. The road map shows Routes 77 and 67, but the water map makes the Sulphur River and White Oak Creek the dominant references. The elevation layer confirms that the same broad area is low, with extensive dark-green terrain along the northern boundary and creek valleys.

Continue south through Daingerfield toward Lone Star and the physical pattern changes. Boggy Creek and Brutons Creek remain low corridors, but surrounding hills become more pronounced and the southeastern corner rises to the highest colors on the map. This north-to-south comparison gives Morris County a much more specific geographic identity than the older generic “mapped geography” wording.

A practical reading order is to locate the four cities and principal roads first, match the Sulphur River and central creek system to the same positions, and then compare the elevation map. Small road numbers and creek labels are often easier to inspect in the downloadable high-resolution JPG files than in the browser previews.

Frequently Asked Questions

Which cities are ranked on the Morris County city map?

Daingerfield is ranked first, followed by Lone Star, Naples, and Omaha. The map also prints 2,529, 1,543, 1,412, and 1,316 beside those names, but no year is shown, so this article does not treat those values as confirmed current population counts.

Which water features are the best starting points?

Start with the Sulphur River and White Oak Creek in the north. Village Creek, Boggy Creek, and Little Boggy Creek help locate the central valleys, while Ellison Creek Reservoir and Barnes Creek Reservoir are useful southern references.

What elevation range is shown for Morris County?

The supplied elevation map reports an actual range of about 70 to 187 meters and a mean elevation of about 104 meters. The northern Sulphur River area is generally lower, while elevation rises through the central hills and reaches its strongest relief toward the southeast.

Sources and Reference Data

Map File Information

Download four high-resolution A3 JPG maps of Morris County, Texas, in one ZIP file.

  • Included Files: county map, ranked city map, terrain and water map, elevation map
  • File Type: JPG
Download Map Files

Green Map creates custom-edited map images using open geographic data sources such as geoBoundaries, Natural Earth, OpenStreetMap, and government open data.

These maps are edited visual materials, not raw data files, and are provided for education, documents, presentations, and graphic reference.
Leave a Comment

Your email address will not be published. Required fields are marked *

Scroll to Top