Hays County, Texas combines a fast-growing eastern city corridor with a much hillier western half. San Marcos, Kyle, and Buda form the clearest urban sequence on the supplied county map, while Dripping Springs and Wimberley sit farther west among more broken terrain and a denser network of creeks. You can download the same county, city, water, and elevation maps shown on this page as A3 high-resolution JPG files in one ZIP archive.
The general map makes the east-west contrast easy to recognize. San Marcos anchors the southern part of the county, with Kyle and Buda extending north along the main road corridor. Dripping Springs is separated from that built-up belt near US 290, and Wimberley lies southwest of the county center in a landscape where streams and ridges become much more visible.
The water and elevation maps add another layer to that pattern. Blanco River curves across the southern and southwestern part of the county, while Onion Creek, Bear Creek, Cypress Creek, York Creek, and several smaller branches drain the interior. The elevation map gives an actual range of about 158 to 502 meters, with a mean near 296 meters, and it shows the western uplands standing well above the lower eastern side.
Table of Contents
San Marcos, Kyle, and Buda define the eastern city corridor
San Marcos appears as the largest built-up area in the southern part of the county. Moving north, the developed areas around Kyle and Buda continue along the same general transportation corridor rather than spreading evenly across the county. The Hays County Law Enforcement Center is marked near San Marcos, and the map shows a long band of urban development extending through Kyle toward Buda.
Uhland is marked near the eastern edge, while Mountain City sits north of Kyle. Nearby places outside the county boundary, including Creedmoor and Niederwald, help establish the wider setting. Route markers 21 and 45 also appear on the eastern side, providing useful reference points when you are comparing the county boundary with the larger Austin–San Marcos road network shown around it.
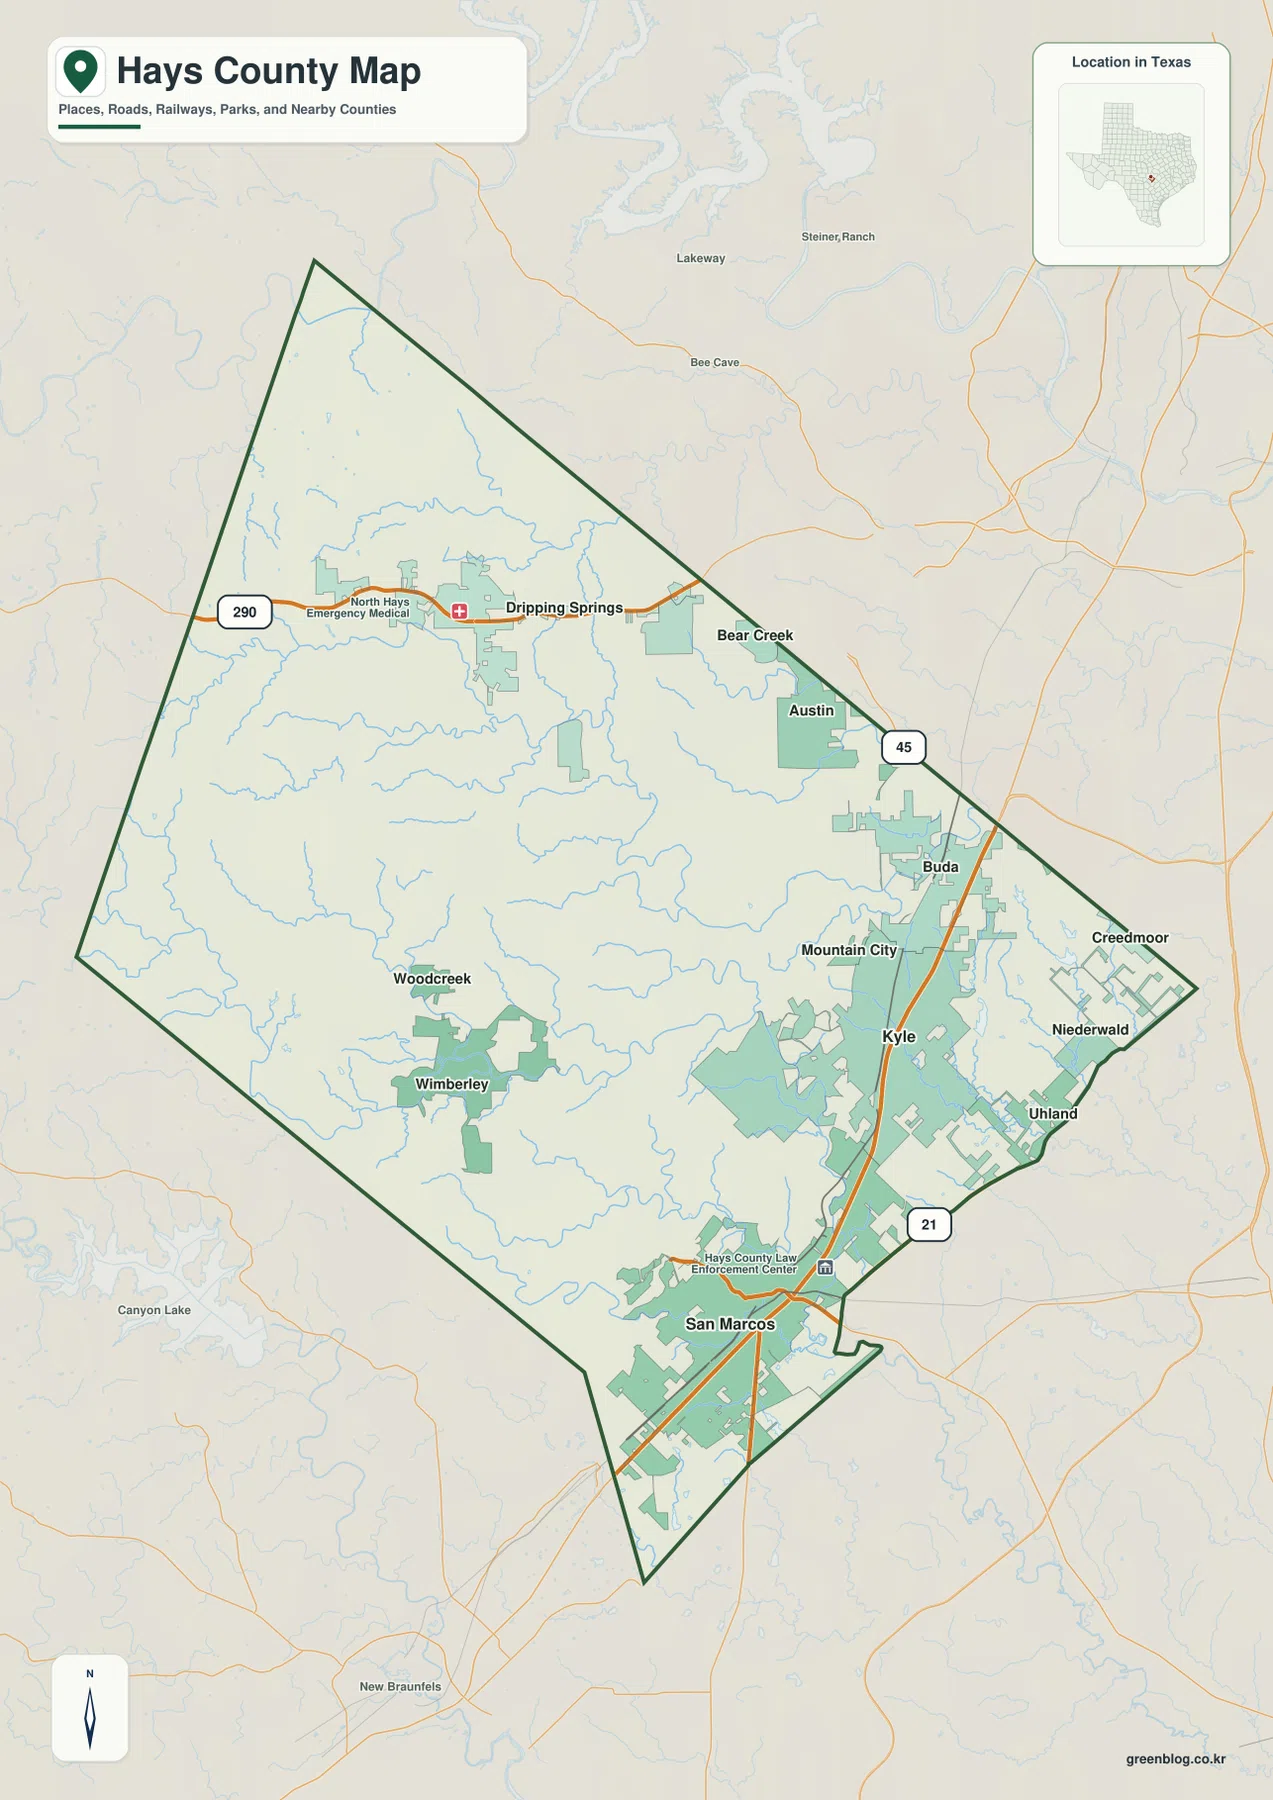
The main north-south road through San Marcos, Kyle, and Buda is also identified in the supplied article material as I-35. US 290 is the clearest westward road reference at Dripping Springs. Together, those routes help explain why the eastern side reads as a connected urban corridor while the western side is more dispersed, with longer gaps between developed areas and more terrain between communities.
Dripping Springs and Wimberley sit in a different landscape
Dripping Springs is shown in the northwestern part of the county along US 290, with Bear Creek to the east. Wimberley lies farther south and west, near Woodcreek and the Blanco River drainage. Neither area looks like a continuation of the dense eastern city belt. Instead, developed patches are separated by larger stretches of ridged and stream-cut land.
This western pattern matters when reading the maps because roads, waterways, and elevation change together. Around Wimberley, the Blanco River and smaller tributaries become important geographic references, while the Dripping Springs area lies closer to the higher western uplands. Locating those communities on the road map first makes the water and elevation maps much easier to interpret.
The city index highlights six major places and a strong east-side concentration
The city-distribution map ranks six major places. San Marcos is number 1 with a value of 70,897, followed by Kyle at 56,823 and Buda at 18,589. All three are positioned on the eastern or southeastern side of the county, reinforcing the same urban concentration visible on the general county map.
Farther west, Dripping Springs is ranked number 4 at 7,405 and Wimberley number 5 at 2,891. Uhland, near the eastern boundary, is number 6 at 2,520. These values are most useful as a relative comparison within the supplied map rather than as a substitute for a current demographic database, but they clearly show how much larger San Marcos and Kyle are than the western communities.
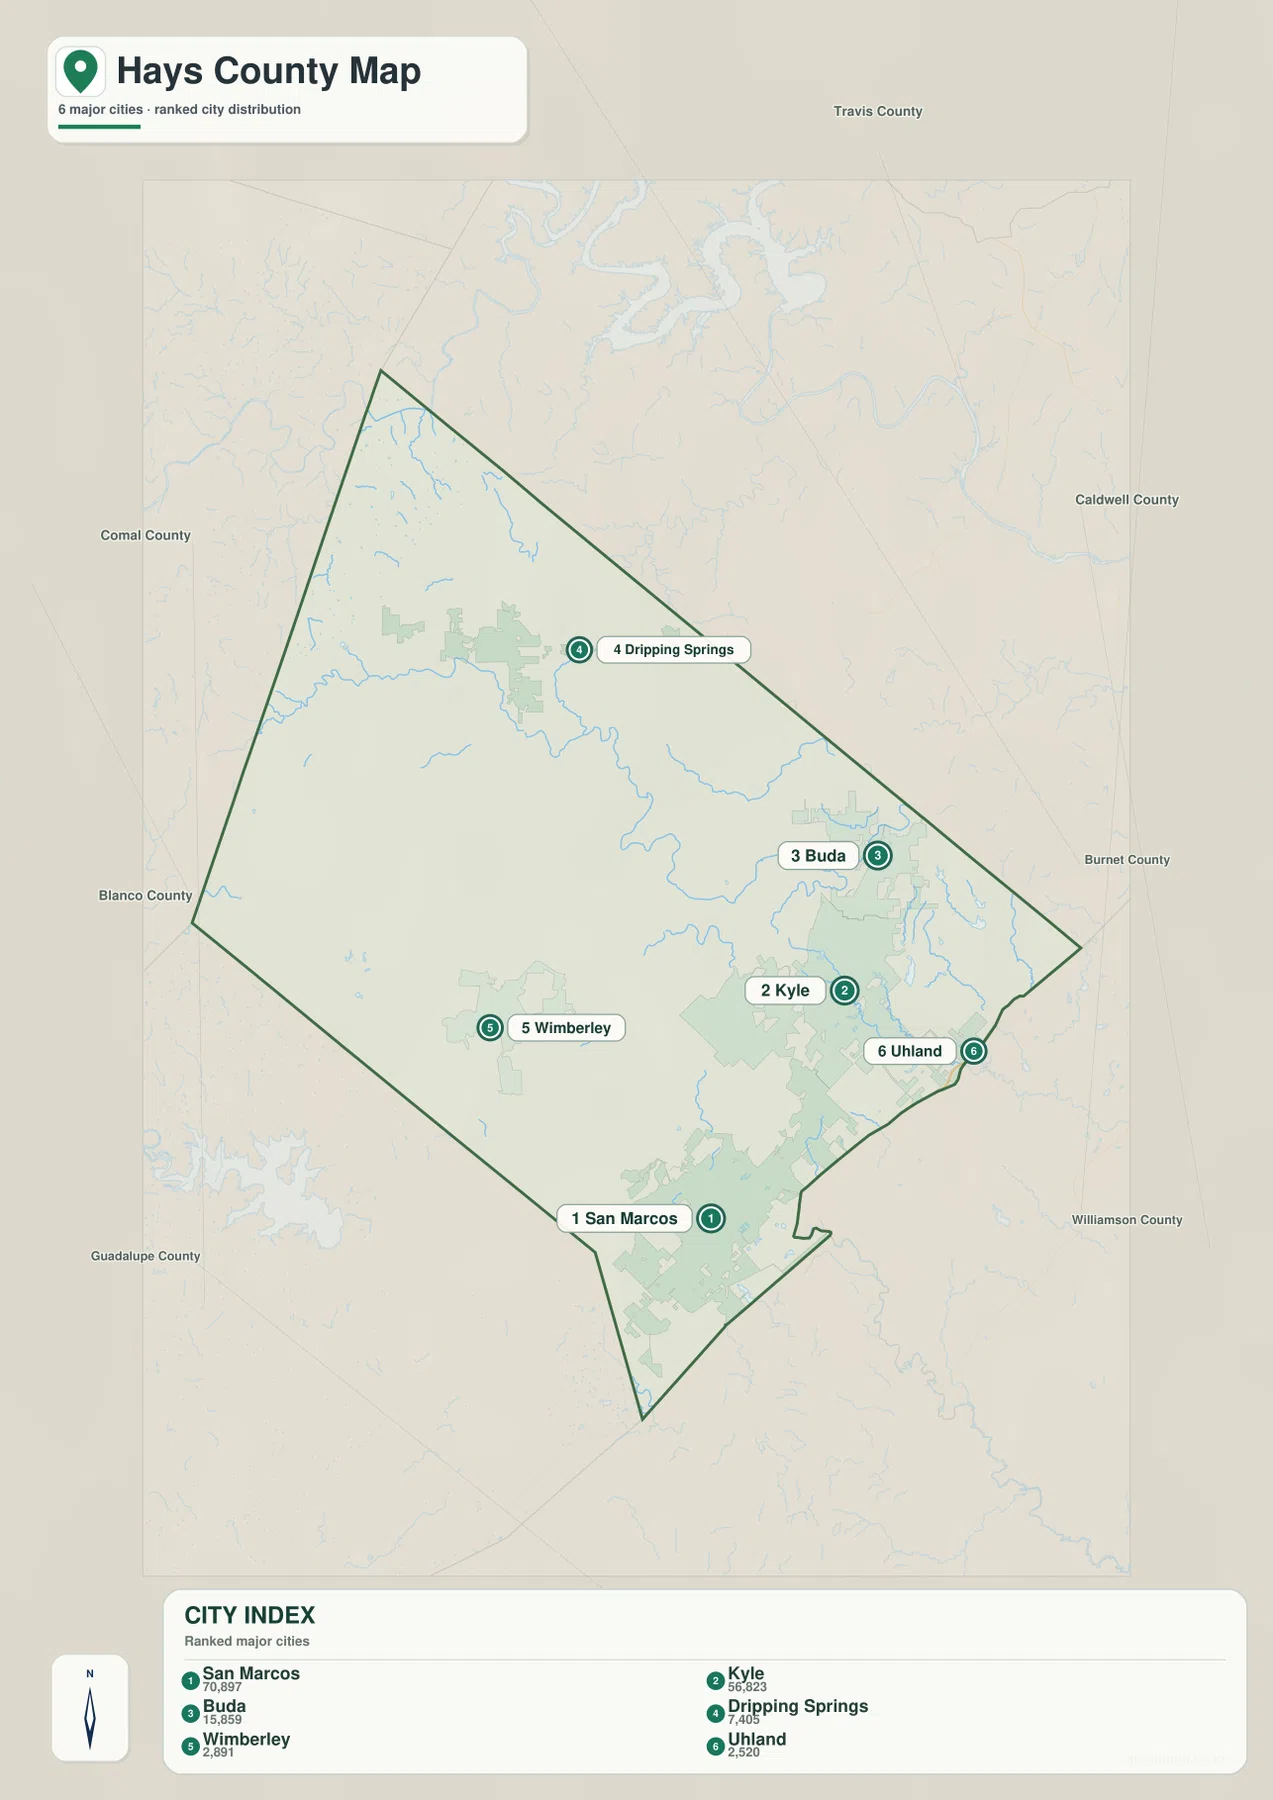
The simplified city map is especially helpful because it removes much of the road detail. You can see the spacing between San Marcos, Kyle, and Buda on the east side, then compare that cluster with Dripping Springs and Wimberley farther west. The surrounding county labels also show the regional position of Hays County without distracting from the six ranked places.
Blanco River and a web of creeks cut across the county
Blanco River is the strongest named water feature on the supplied terrain and water map. It enters from the west and bends across the southern interior, where its valley is easy to recognize in the shaded relief. Cypress Creek joins the broader western drainage pattern, while Purgatory Creek and Stink Creek appear farther south. Spring Lake is marked close to the San Marcos area near the southern part of the county.
The northern and central parts of the county contain a different set of creeks. Millseat Branch runs across the northwest, and Bear Creek, Little Bear Creek, York Creek, and Onion Creek are labeled across the middle and northeast. On the eastern side, Williams Branch, Bunton Branch, and Plum Creek add more fine drainage lines. Rather than forming one simple river system, the map shows many separate valleys crossing the county from the higher west toward lower ground.
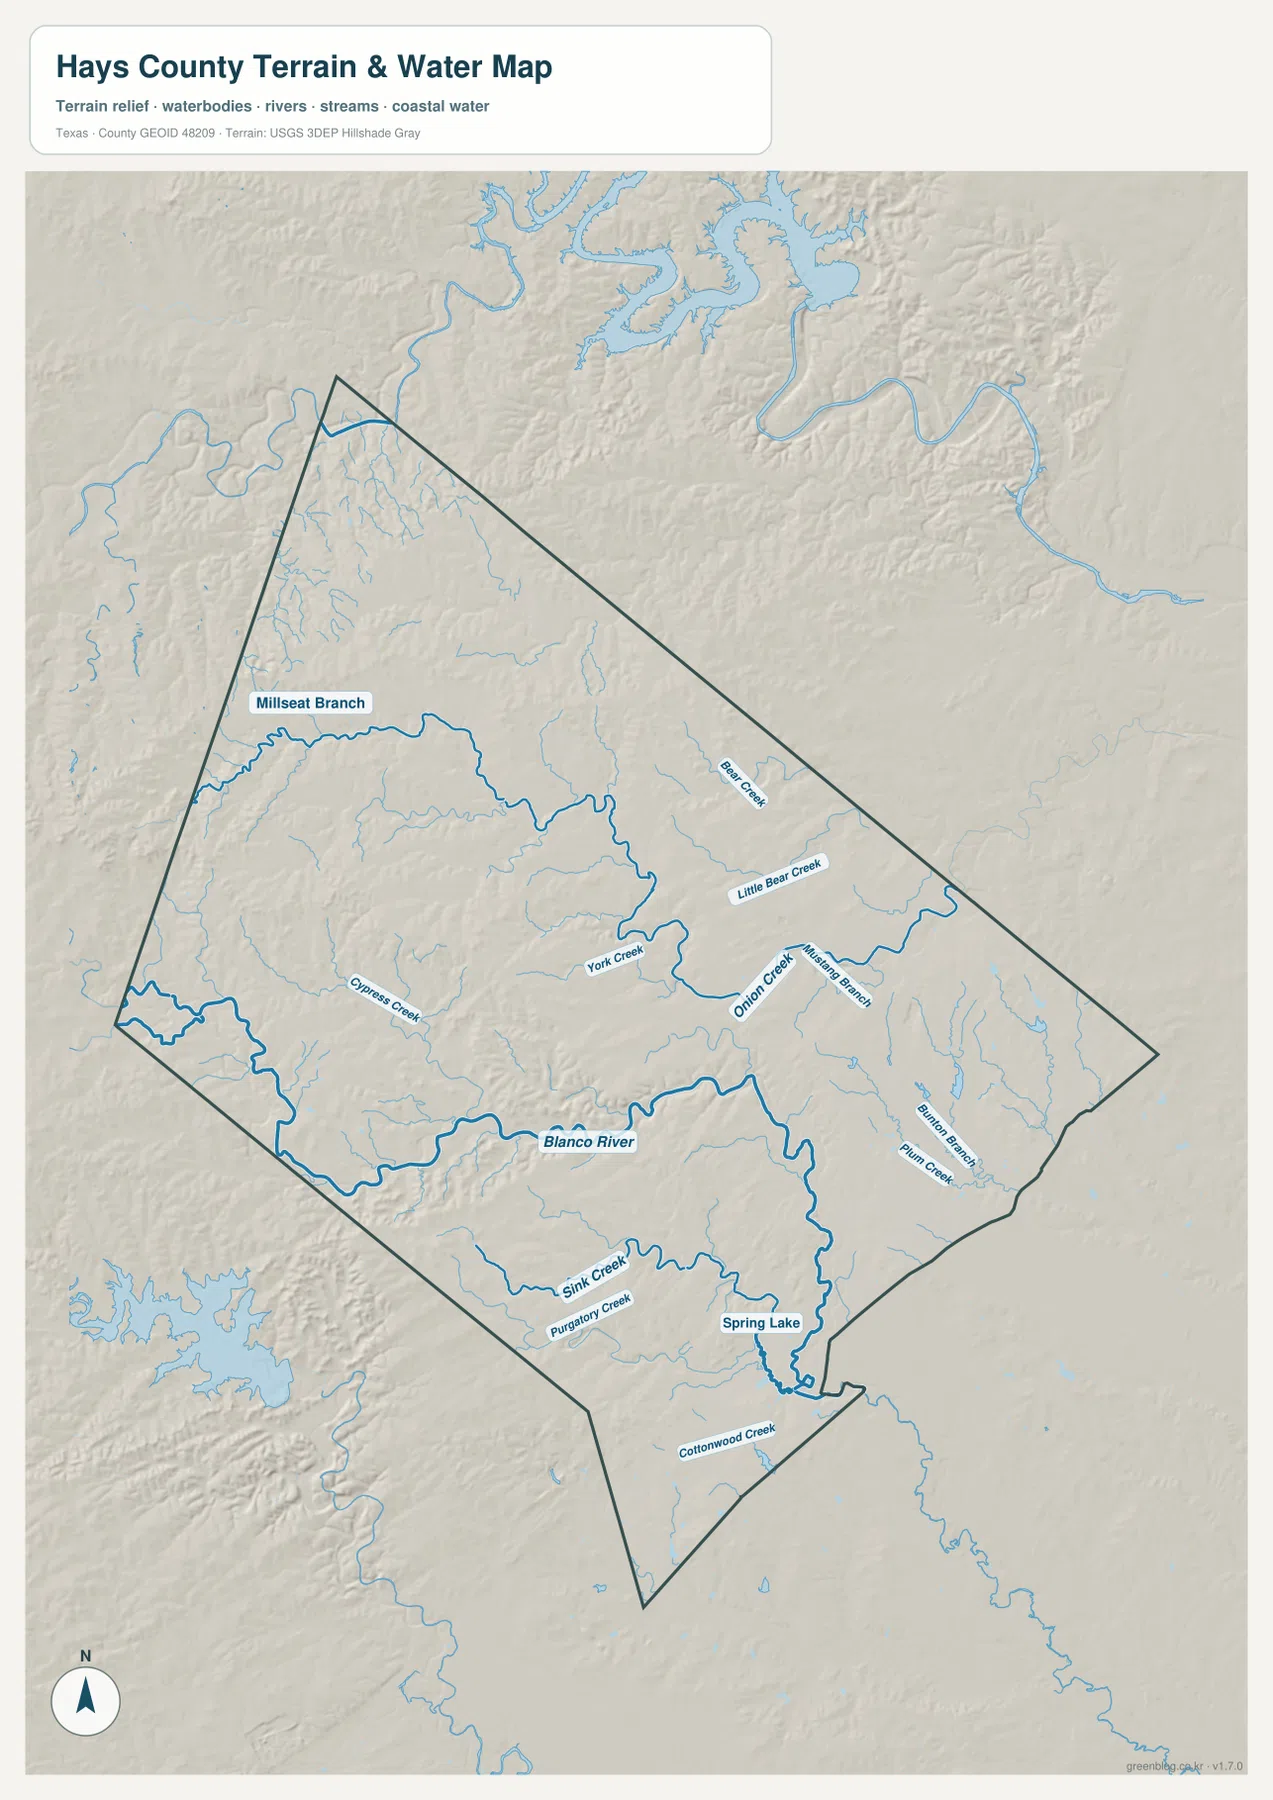
This map is intended for geographic orientation, not for determining flood zones, water depth, navigability, or property rights. Its value is in showing where major watercourses sit relative to the towns and terrain. When paired with the elevation map, the creek valleys become especially easy to recognize because the same routes appear as lower bands cutting through higher ground.
Elevation falls sharply from the western uplands toward the east
The elevation legend gives an actual range of roughly 158 to 502 meters and a mean of about 296 meters. Orange and brown colors dominate much of the west and northwest, indicating the highest terrain in the county. Greens spread across the eastern and southeastern side, where San Marcos, Kyle, and Buda sit at noticeably lower elevations.
The western high country is not a single smooth plateau. Numerous narrow valleys cut through it, creating a dense pattern of ridges and drainage lines. The Blanco River valley and other creeks visible on the water map correspond to lower green corridors on the elevation map. This is one reason Wimberley and the western interior look much more rugged than the eastern urban corridor.
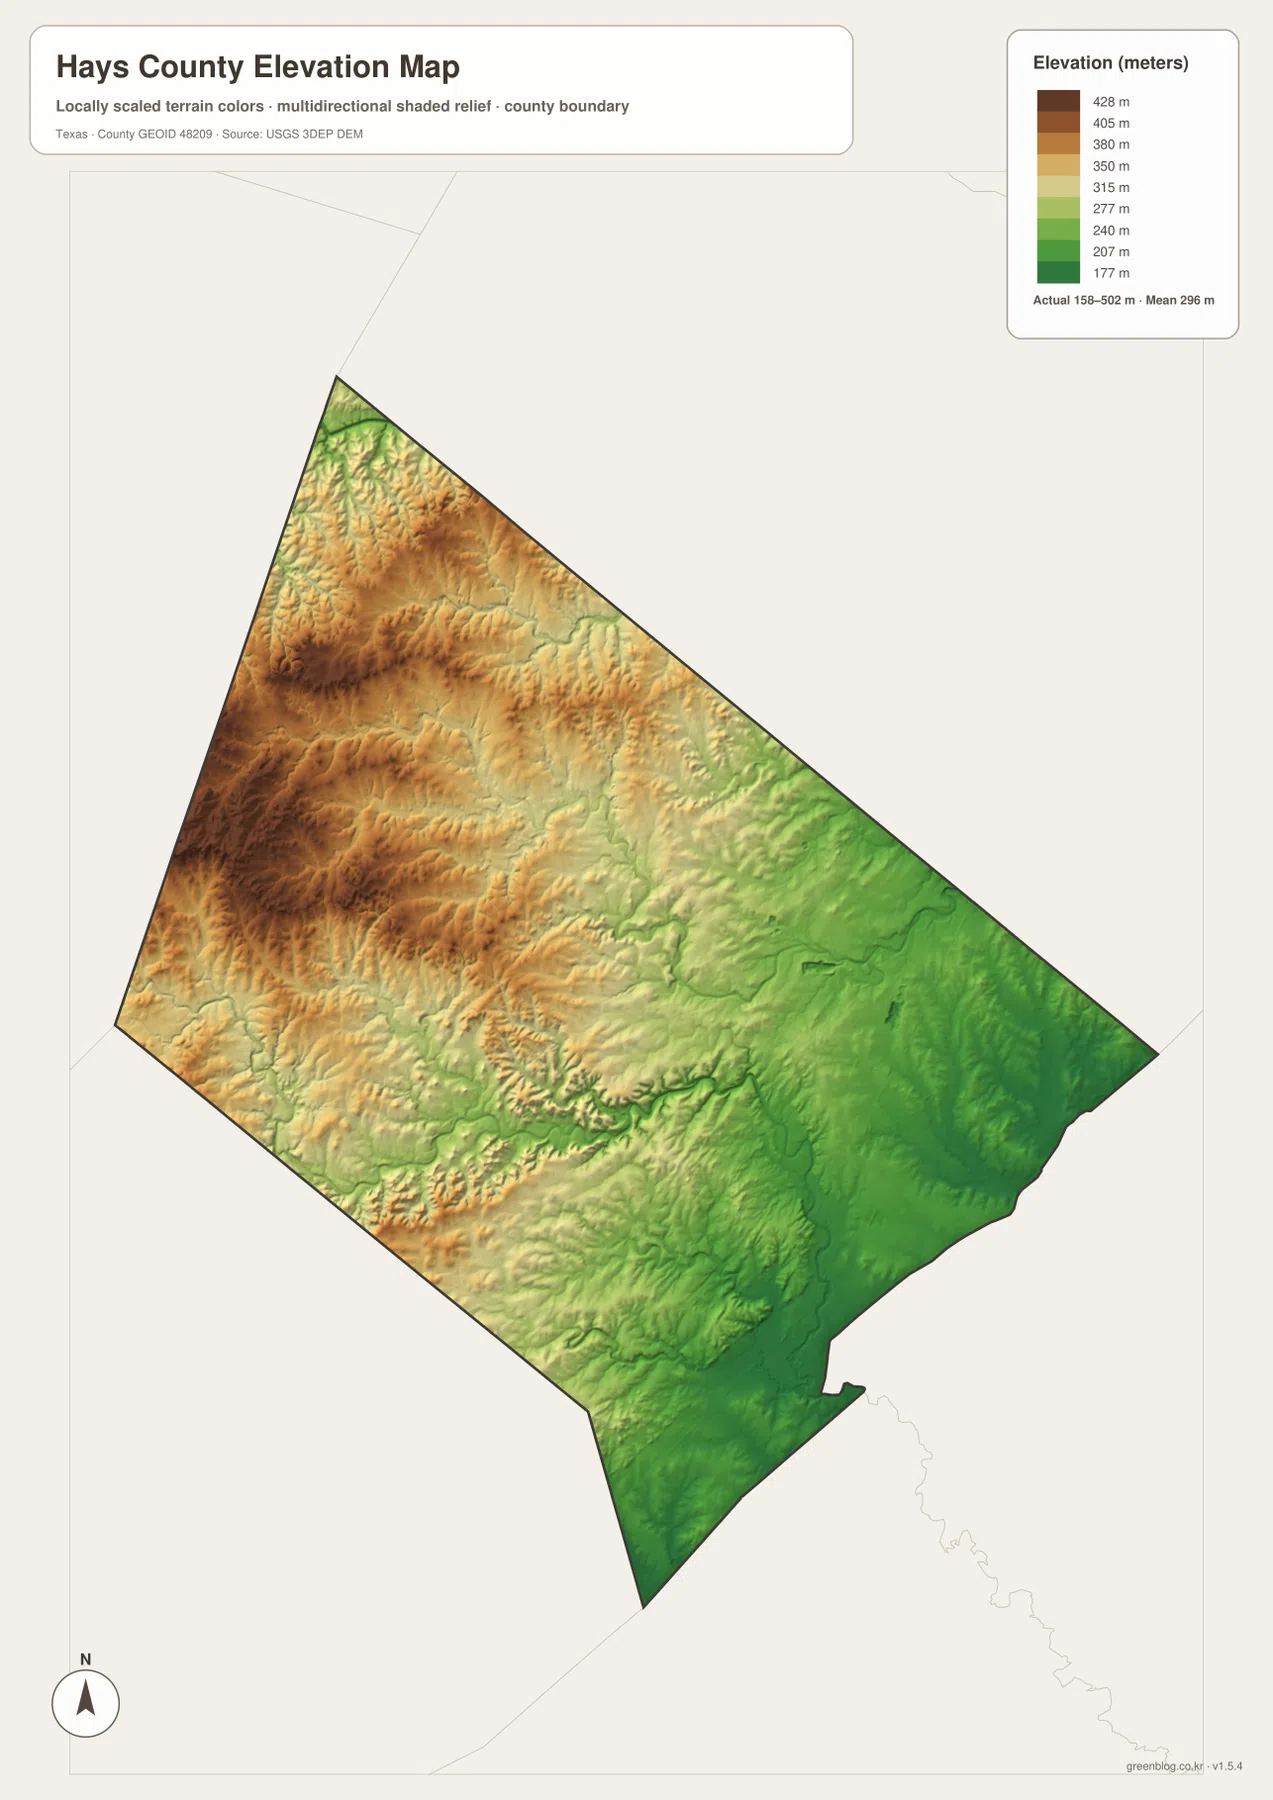
The elevation layer is best used for county-scale comparison. It does not replace a survey or site-specific engineering elevation. For a map reader, however, it gives a clear answer to a basic question: why do the western communities sit among deeply cut hills while the eastern cities occupy a broader, lower surface?
Choosing the right file for roads, cities, water, or relief
Use the general county map when you need place names, road references, developed areas, and the county boundary on one page. The city map is better when the goal is to compare San Marcos, Kyle, Buda, Dripping Springs, Wimberley, and Uhland without a dense road background. For rivers and tributaries, the water map is much clearer, and the elevation map is the best choice for explaining the high western terrain and lower east.
The maps also work well as a sequence. Start with San Marcos or Dripping Springs on the county map, find the same area on the city map, then compare the nearest creeks and elevation colors. That approach turns separate files into a simple geographic lesson about how settlement, roads, water, and terrain fit together in Hays County.
The WebP images in the article are optimized for on-page viewing, while the ZIP contains the larger JPG versions intended for printing, documents, and presentations. Because each topic is stored as a separate image, you can use only the road map, city map, water map, or elevation map you need.
Frequently Asked Questions
Where should I start when reading the Hays County Map?
Start with San Marcos in the south, then follow the eastern corridor north through Kyle and Buda. After that, locate Dripping Springs and Wimberley to the west. Those five places provide a quick framework for understanding the county’s settlement pattern and its strong east-west terrain contrast.
Which file shows Blanco River and the county’s creeks most clearly?
The terrain and water map is the best choice. Blanco River, Onion Creek, Bear Creek, Cypress Creek, Purgatory Creek, Spring Lake, and numerous smaller branches are emphasized there, making their relationship to the terrain much easier to see than on the general road map.
What elevation range is shown for Hays County?
The supplied elevation map gives an actual range of about 158 to 502 meters, with a mean near 296 meters. The western and northwestern areas are much higher, while the eastern and southeastern side around the main city corridor is lower. Site-specific elevations require more detailed survey data.
Sources and Reference Data
County boundaries, roads, and geographic linework can be checked through U.S. Census Bureau TIGER/Line Shapefiles.
Blanco River, creeks, and other hydrography can be referenced through USGS National Hydrography.
Elevation and DEM background information is available from the USGS 3D Elevation Program.
For an interactive view combining terrain, water, and boundaries, see the USGS The National Map Viewer.
Map File Information
The original A3 high-resolution JPG files matching the maps shown on this page are available together in one ZIP archive.
- File Type: JPG
Related Maps
- Travis County Texas map
- Bastrop County Texas map
- Wilson County Texas map
- San Saba County Texas map
- Williamson County Texas map
Green Map creates custom-edited map images using open geographic data sources such as geoBoundaries, Natural Earth, OpenStreetMap, and government open data.
These maps are edited visual materials, not raw data files, and are provided for education, documents, presentations, and graphic reference.