This page uses Georgetown as the central reference for a Williamson County Texas Map, then follows the dense southern city network through Round Rock, Cedar Park, Leander, Hutto, and Taylor. Download the high-resolution A3 JPG map ZIP from the box below when you need printable or editable files; it contains separate county-reference, ranked-city, terrain-and-water, and elevation maps.
Williamson County changes noticeably from the Austin-facing south and southwest to the more open north and east. Georgetown and Round Rock form the main central north-south pair. Cedar Park and Leander sit to the southwest, while Hutto and Taylor extend the developed pattern eastward. Florence, Jarrell, Bartlett, and Granger appear farther north on the full reference map. Beneath that settlement pattern, the terrain rises sharply toward the western hills and drops into lower country around the San Gabriel River and the eastern half.
Table of Contents
Georgetown links the western hills with Round Rock and the eastern corridor
Georgetown is the easiest place to locate first on the county reference map. Route 29 runs west toward Liberty Hill and east toward the Weir and Granger side, giving the county a clear cross-county reference. Round Rock lies immediately south of Georgetown, while Cedar Park and Leander occupy the southwest. Together those cities define the most continuous built-up area on the supplied map.
East of Round Rock, Hutto and Taylor follow the U.S. 79 corridor identified in the existing article. Route 95 crosses the Taylor area from north to south, while route 130 runs through the Georgetown-to-Hutto side. Farther north, Jarrell, Florence, Bartlett, and Granger are separated by larger stretches of open land, making the contrast with the southern urban area easy to see.
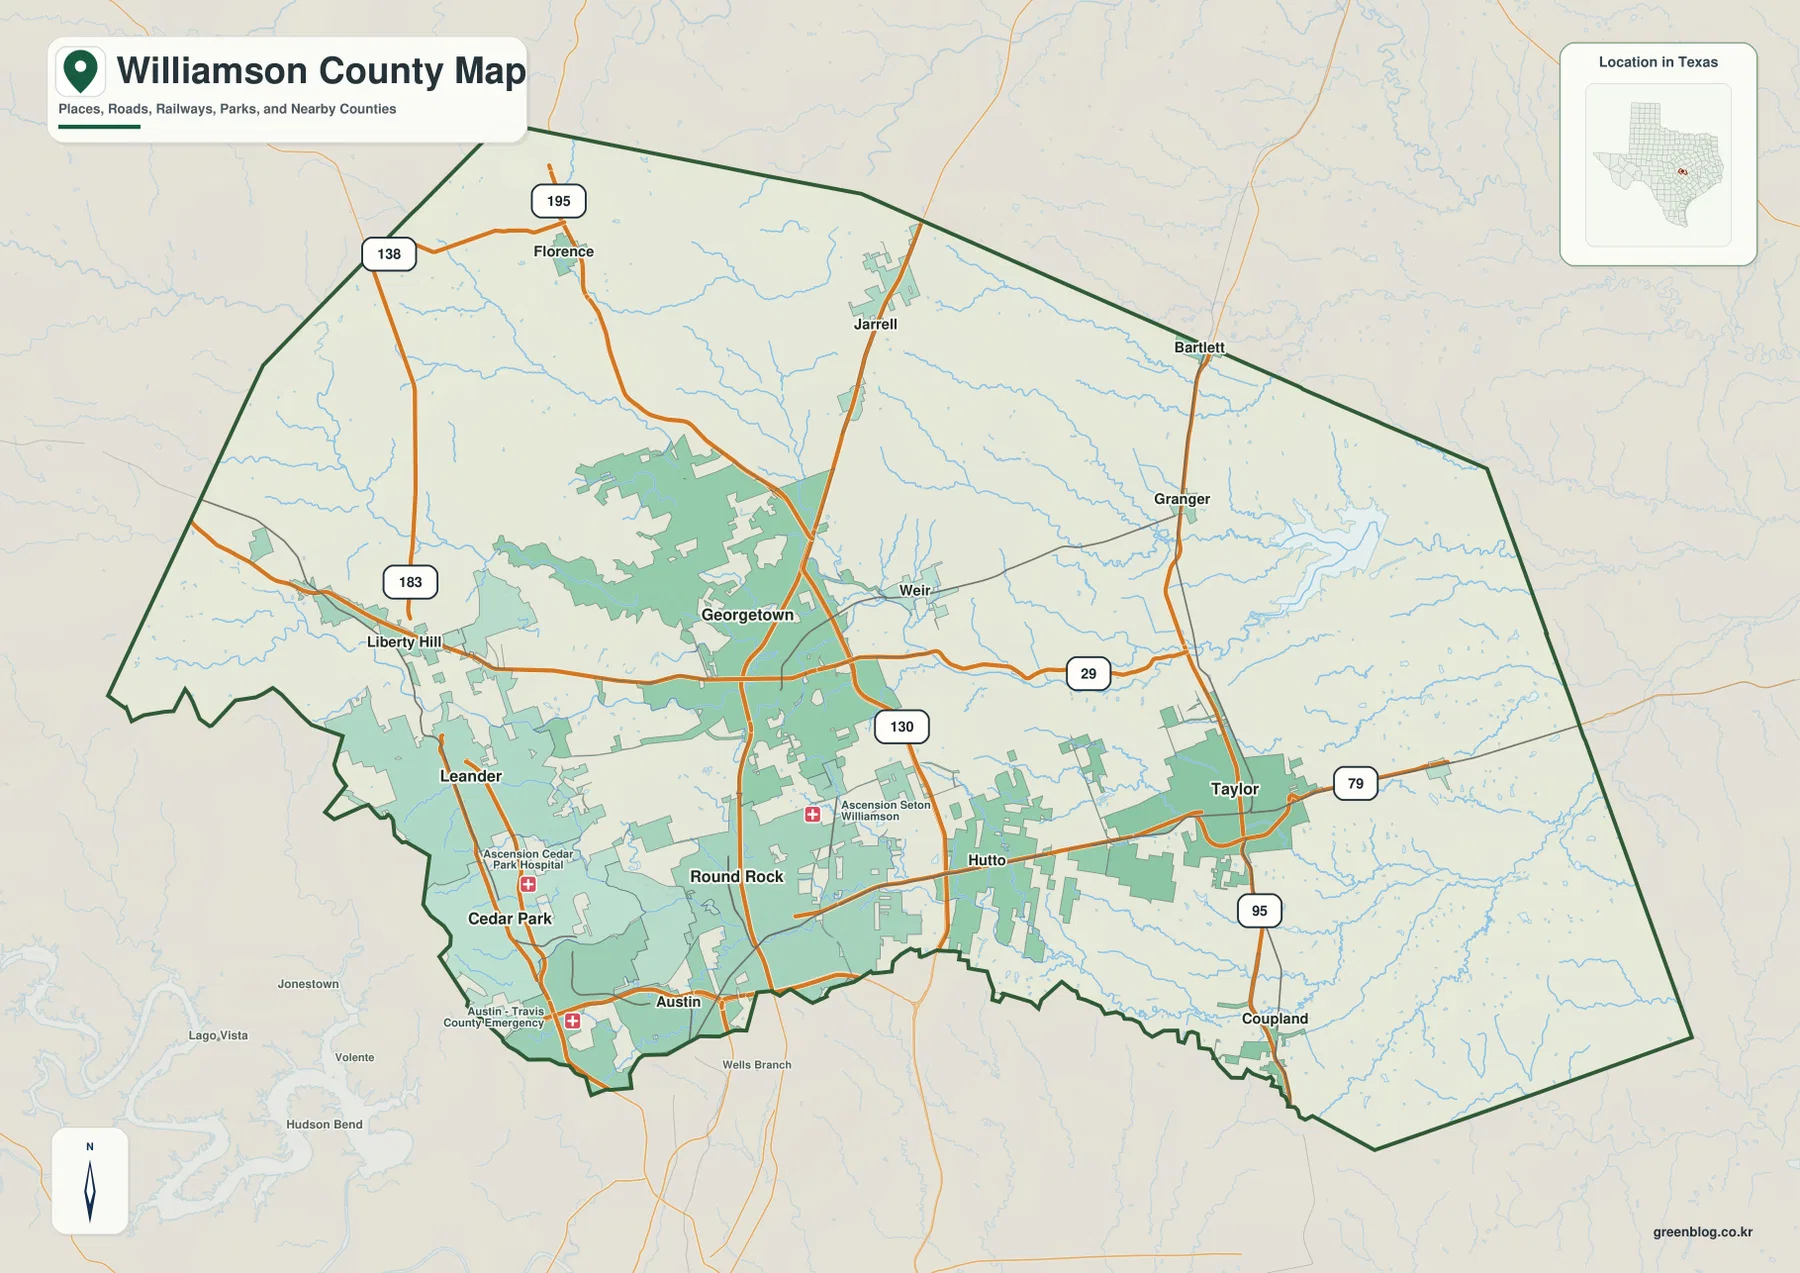
The west around Liberty Hill and Leander looks more dissected by winding roads and streams, while the Taylor and Granger side is broader and lower. North of Georgetown, settlement labels become more widely spaced and the stream network becomes a stronger visual feature. Those differences are not only about development density; they also reflect the much higher western terrain shown on the elevation map.
Round Rock leads the six-city ranking, with Georgetown second
The ranked-city map highlights Round Rock, Georgetown, Cedar Park, Leander, Hutto, and Taylor. Round Rock is number 1 in the south-central part of the county, Georgetown is number 2 to the north, and Cedar Park and Leander are numbers 3 and 4 in the southwest. Hutto ranks fifth east of Round Rock, and Taylor is number 6 farther east.
The CITY INDEX prints map values of 127,786 for Round Rock, 85,999 for Georgetown, 78,301 for Cedar Park, 74,067 for Leander, 35,483 for Hutto, and 17,136 for Taylor. These figures explain the ranking and relative symbol display used in the supplied graphic and should not be treated as guaranteed current population estimates. For geographic use, the key point is that the six largest mapped places are concentrated in the southern half and extend in two different directions: southwest toward Cedar Park and Leander, and east toward Hutto and Taylor.
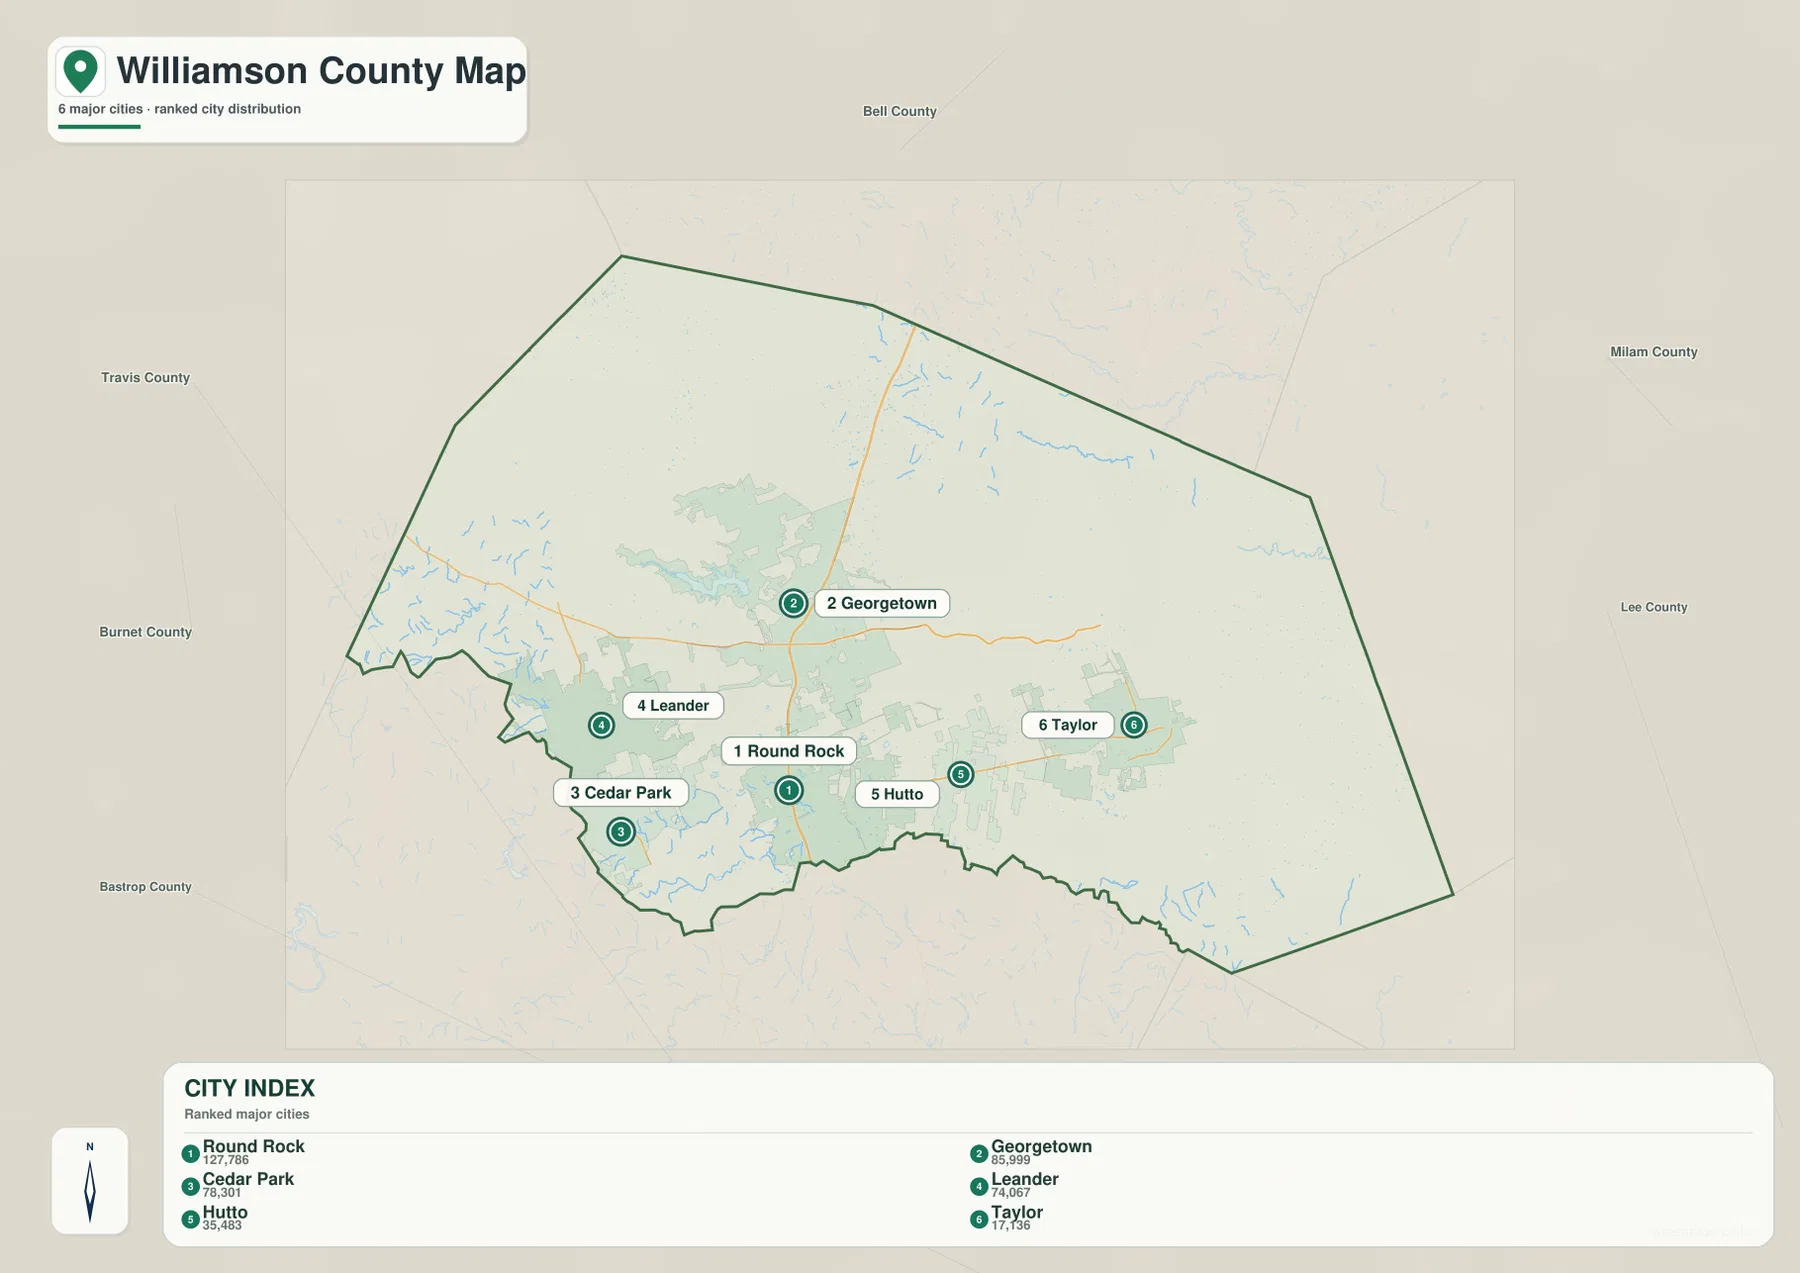
The neighboring county labels add useful context. Travis County lies to the south, Burnet County is west, Bell County is north, and Milam and Lee counties are on the eastern side. That frame explains why the Round Rock–Cedar Park–Leander side is closely tied to the southern metropolitan edge while the Taylor and Granger side opens into a broader eastern landscape.
Lake Georgetown joins the North and South Forks of the San Gabriel system
The western water map is organized around North Fork San Gabriel River, South Fork San Gabriel River, and Lake Georgetown. Both forks descend through the higher western hills, and the lake forms one of the clearest water landmarks west of Georgetown. Downstream, the San Gabriel River continues east across lower terrain, creating a strong natural connection between the rugged west and the broad eastern half.
Farther northeast, Willis Creek and Long Branch form long separate drainage corridors before reaching the San Gabriel side. Long Branch is especially visible near the northeastern boundary, while Willis Creek runs through the interior. The broad spacing of these channels matches the lower, more open relief seen east of Georgetown.
Mustang Creek is labeled in the east-central interior, and Dry Brushy Creek forms a prominent southeastern drainage line. Lake Greenbelt, City Lake, and Railroad Lake are clustered nearby. Meadow Lake appears farther southwest of that group, while Muir Lake and Smith Lake provide smaller water references on the Cedar Park–Leander side. These features make the water map useful for distinguishing the many lower valleys hidden beneath the urban and road network.
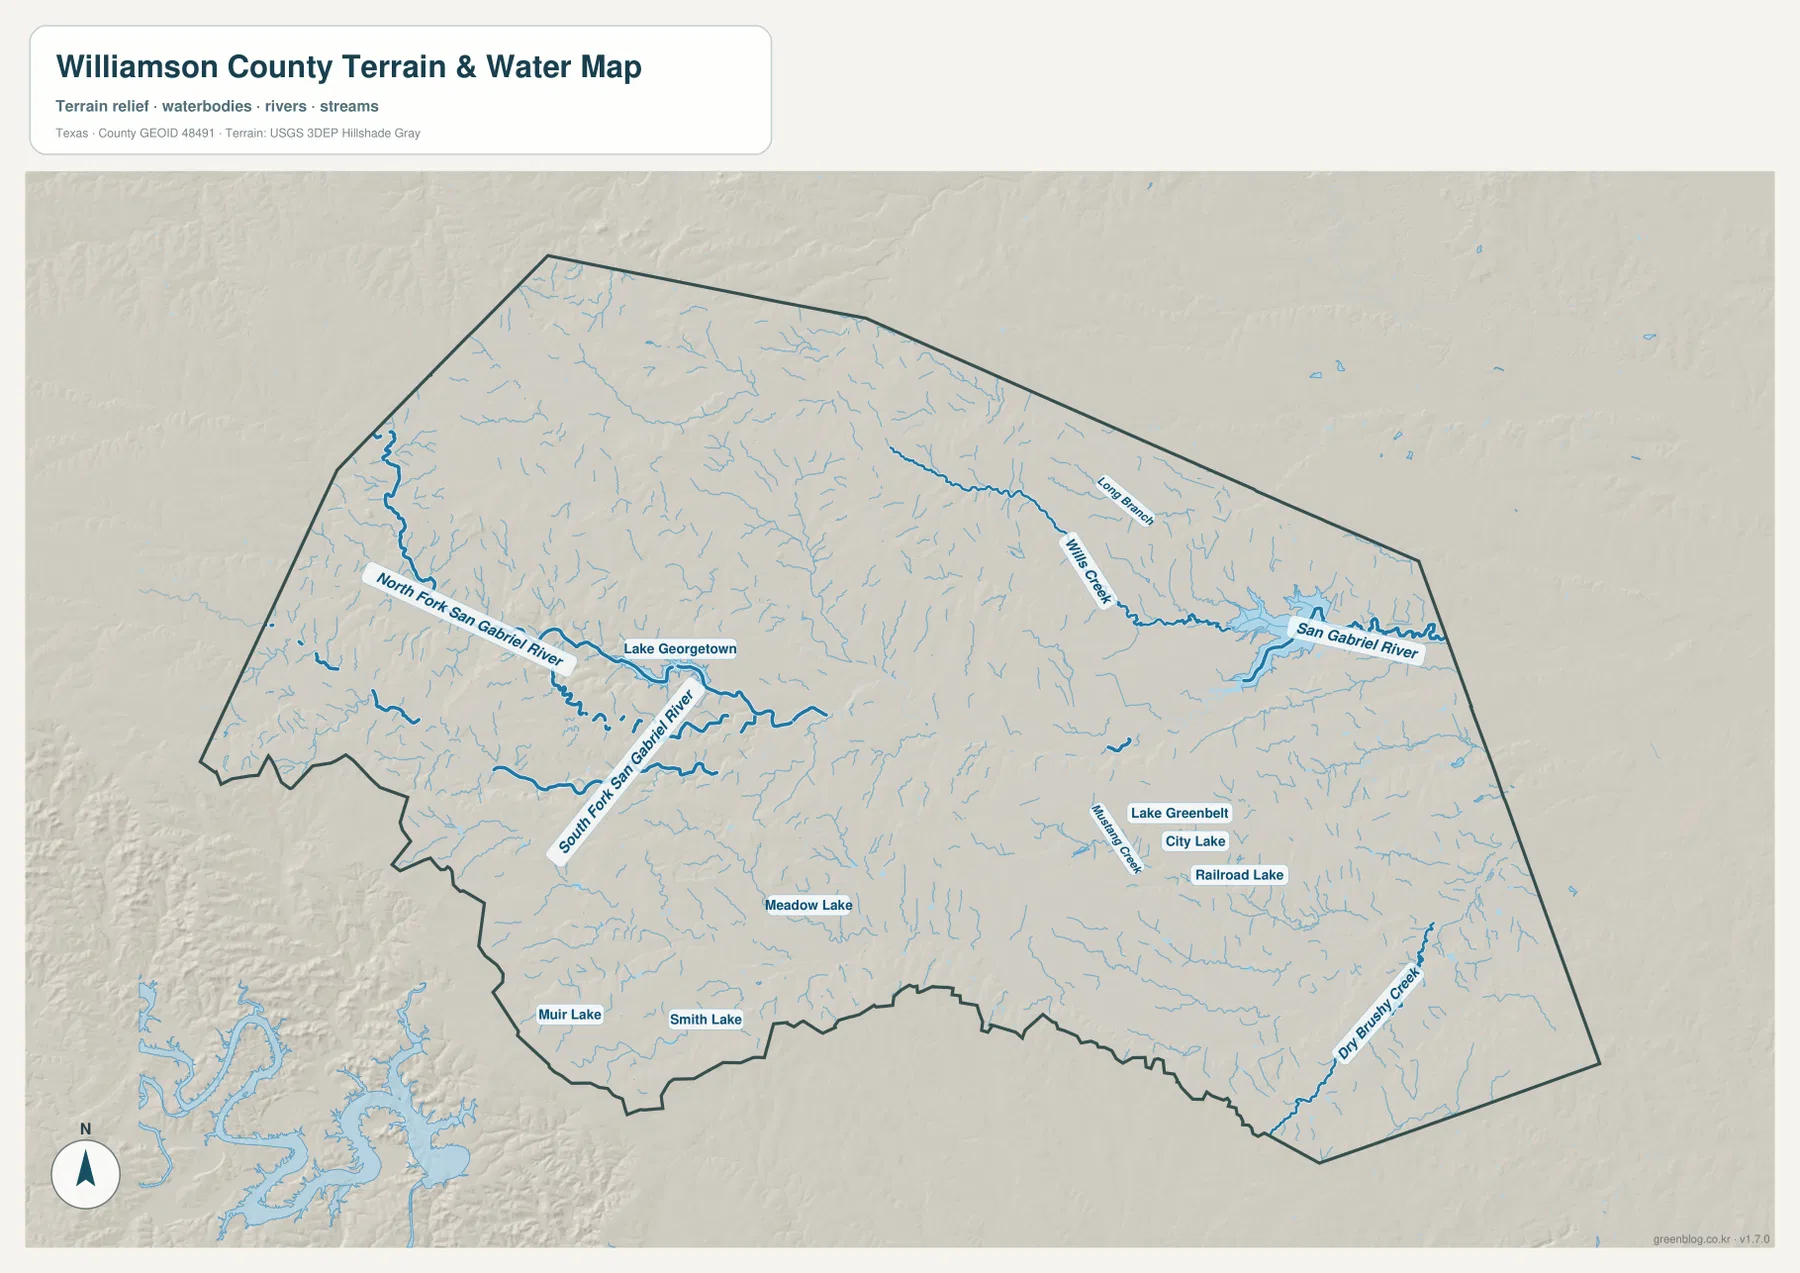
This layer is intended for geographic water and terrain reference rather than flood-risk analysis, navigation, water depth, parcel boundaries, or reservoir-management decisions. Its main value here is to show how the western San Gabriel forks descend through higher ground, where Lake Georgetown sits, and how the river and eastern creeks continue across lower terrain.
Elevation drops from 418-meter western hills toward the eastern lowlands
The elevation map reports an actual range of about 124 to 418 meters and a mean elevation of 230 meters. The darkest brown high ground dominates the west and southwest, with additional ridges in the northwest. East of Georgetown, the colors shift through tan and yellow-green into broad green lower terrain, especially around the San Gabriel River and the southeastern side.
The western uplands are deeply cut by tributary valleys rather than forming one smooth plateau. The North and South Forks of the San Gabriel system follow obvious lower corridors through those hills. Around Georgetown the relief begins to soften, and farther east toward Hutto and Taylor the landscape becomes much broader and lower. Dry Brushy Creek and other southeastern channels still create local valleys within that low plain.
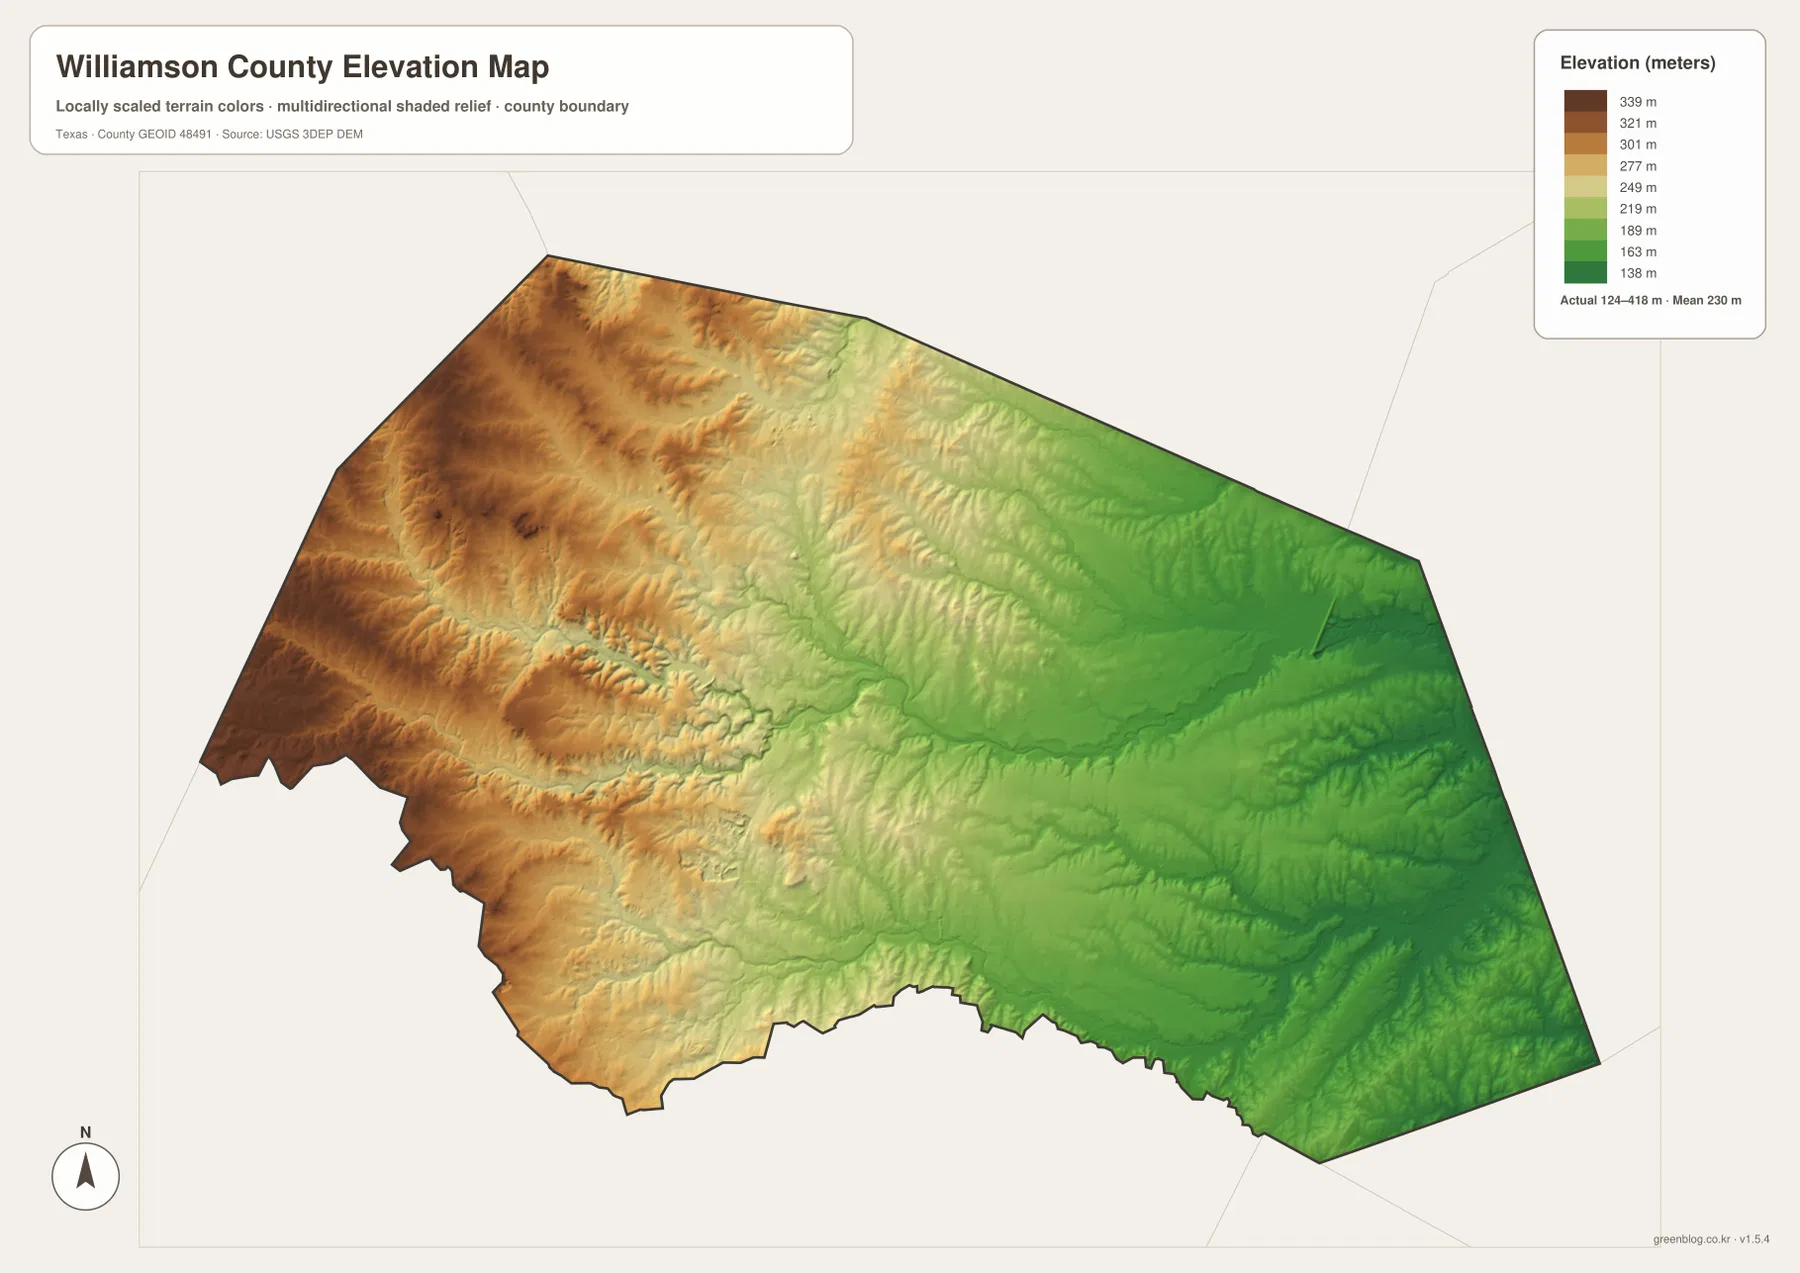
This countywide elevation surface is designed for broad terrain comparison rather than parcel surveying, engineering, or construction design. It is useful for seeing why the Liberty Hill and Leander side is higher, how the San Gabriel forks cut through the western hills, and why the terrain becomes lower toward Hutto, Taylor, and the southeastern edge. Exact site elevation should be checked with detailed source data or a local survey.
Choose the map by whether cities, river valleys, or western relief matters most
Use the county reference map when Georgetown, Round Rock, Cedar Park, Leander, Hutto, Taylor, road labels, and the county boundary need to appear together. The ranked-city view is cleaner for comparing the six major mapped cities. The terrain-and-water layer is the best place to trace the San Gabriel system, Lake Georgetown, Dry Brushy Creek, and the smaller lakes, while the elevation map makes the western hills and eastern lowlands easiest to compare.
The downloadable ZIP contains four separate high-resolution A3 JPG files for Williamson County: county reference, ranked city, terrain and water, and elevation. You can inspect the lighter WebP versions in the article first and then use the larger JPG files for printing, classroom material, presentations, or an editable local-reference document.
Frequently Asked Questions
Where are Hutto and Taylor compared with Georgetown?
Hutto and Taylor are southeast to east of Georgetown on the supplied maps. The U.S. 79 corridor from Round Rock through Hutto toward Taylor is the clearest way to understand their alignment.
How does Lake Georgetown fit into the San Gabriel River system?
Lake Georgetown is the major named western water body in the supplied map set. The North and South Forks of the San Gabriel River cross the higher western terrain around it, and the San Gabriel River continues eastward through the county.
What elevation range is shown for Williamson County?
The supplied elevation map states an actual range of about 124 to 418 meters and a mean elevation of 230 meters. The west and southwest are higher, while the San Gabriel River corridor and eastern half are lower.
Map File Information
The ZIP contains the four Williamson County maps in high-resolution A3 JPG format.
- Included Versions: County reference, ranked city, terrain and water, elevation
- Included Files: 4 A3 JPG maps
Related Maps
Sources and data references
Roads, settlement locations, and the Williamson County boundary can be cross-checked with the U.S. Census Bureau TIGER/Line Shapefiles. San Gabriel River, named creeks, and lake features can be checked against USGS National Hydrography, while terrain height data are available through the USGS 3D Elevation Program. City index values, route references, named waters, and the 124–418 meter elevation range described above are based on the Williamson County maps supplied in this package.
Green Map creates custom-edited map images using open geographic data sources such as geoBoundaries, Natural Earth, OpenStreetMap, and government open data.
These maps are edited visual materials, not raw data files, and are provided for education, documents, presentations, and graphic reference.