Four Bastrop County maps are available here as one ZIP download containing four high-resolution A3 JPG files. On the maps, Bastrop works as the central reference, Elgin marks the northwest, and Smithville anchors the southeast. Roads cross between those places, while the water and elevation sheets reveal a dense creek network, Lake Bastrop, and a broad low corridor associated with the Colorado River. The downloadable set can be printed at A3 size or kept together for classroom reference, regional comparisons and offline use.
Each sheet removes some detail so that a different part of the county becomes easier to see. The general county map places Bastrop, Elgin, Smithville, Cedar Creek, McDade, Paige, Rosanky and other mapped communities beside the major road network. The city view reduces that information to three numbered city references. The water map gives Lake Bastrop, Big Sandy Creek, Piney Creek, Cedar Creek and many smaller water features much more prominence, while the elevation map shows an actual range of about 79 to 223 meters and a mean of about 142 meters. Taken together, the maps explain both where places are and how the river valley and surrounding hills shape the county.
Table of Contents
Bastrop provides the clearest reference point for the county road pattern
The general county map places Bastrop slightly south of the visual center of the county, making it a useful starting point for reading the rest of the map. Route shields for 21 and 71 appear close to Bastrop, while 95 runs north toward Elgin and 304 continues south toward the Rosanky area. From Bastrop, the map spreads west toward Cedar Creek and Wyldwood, southeast toward Smithville, and north toward Camp Swift and Elgin. Looking outward from this one point is more useful than trying to memorize every place name at once.
The northern part of the county is organized differently. Elgin lies close to the northwestern edge, McDade appears farther east inside the county, and Paige is positioned near the eastern side. U.S. 290 is marked across this northern corridor, linking the Elgin side of the map with McDade and Paige. Route 95 then provides a strong north-south connection toward Bastrop. Because these roads do not all follow the same direction, the county map shows a network rather than a single dominant highway line.
Smaller mapped places help fill in the spaces between the three best-known city references. Cedar Creek occupies a large green area in the southwest, with Wyldwood to its north. Red Rock is farther south and west, Rosanky lies in the southern part of the county, Camp Swift is north of Bastrop, and Circle D-KC Estates appears to the east and northeast of Bastrop. These labels are useful when a reader needs more than a simple city-to-city view, especially on a printed map where the county boundary and smaller communities can be followed together.
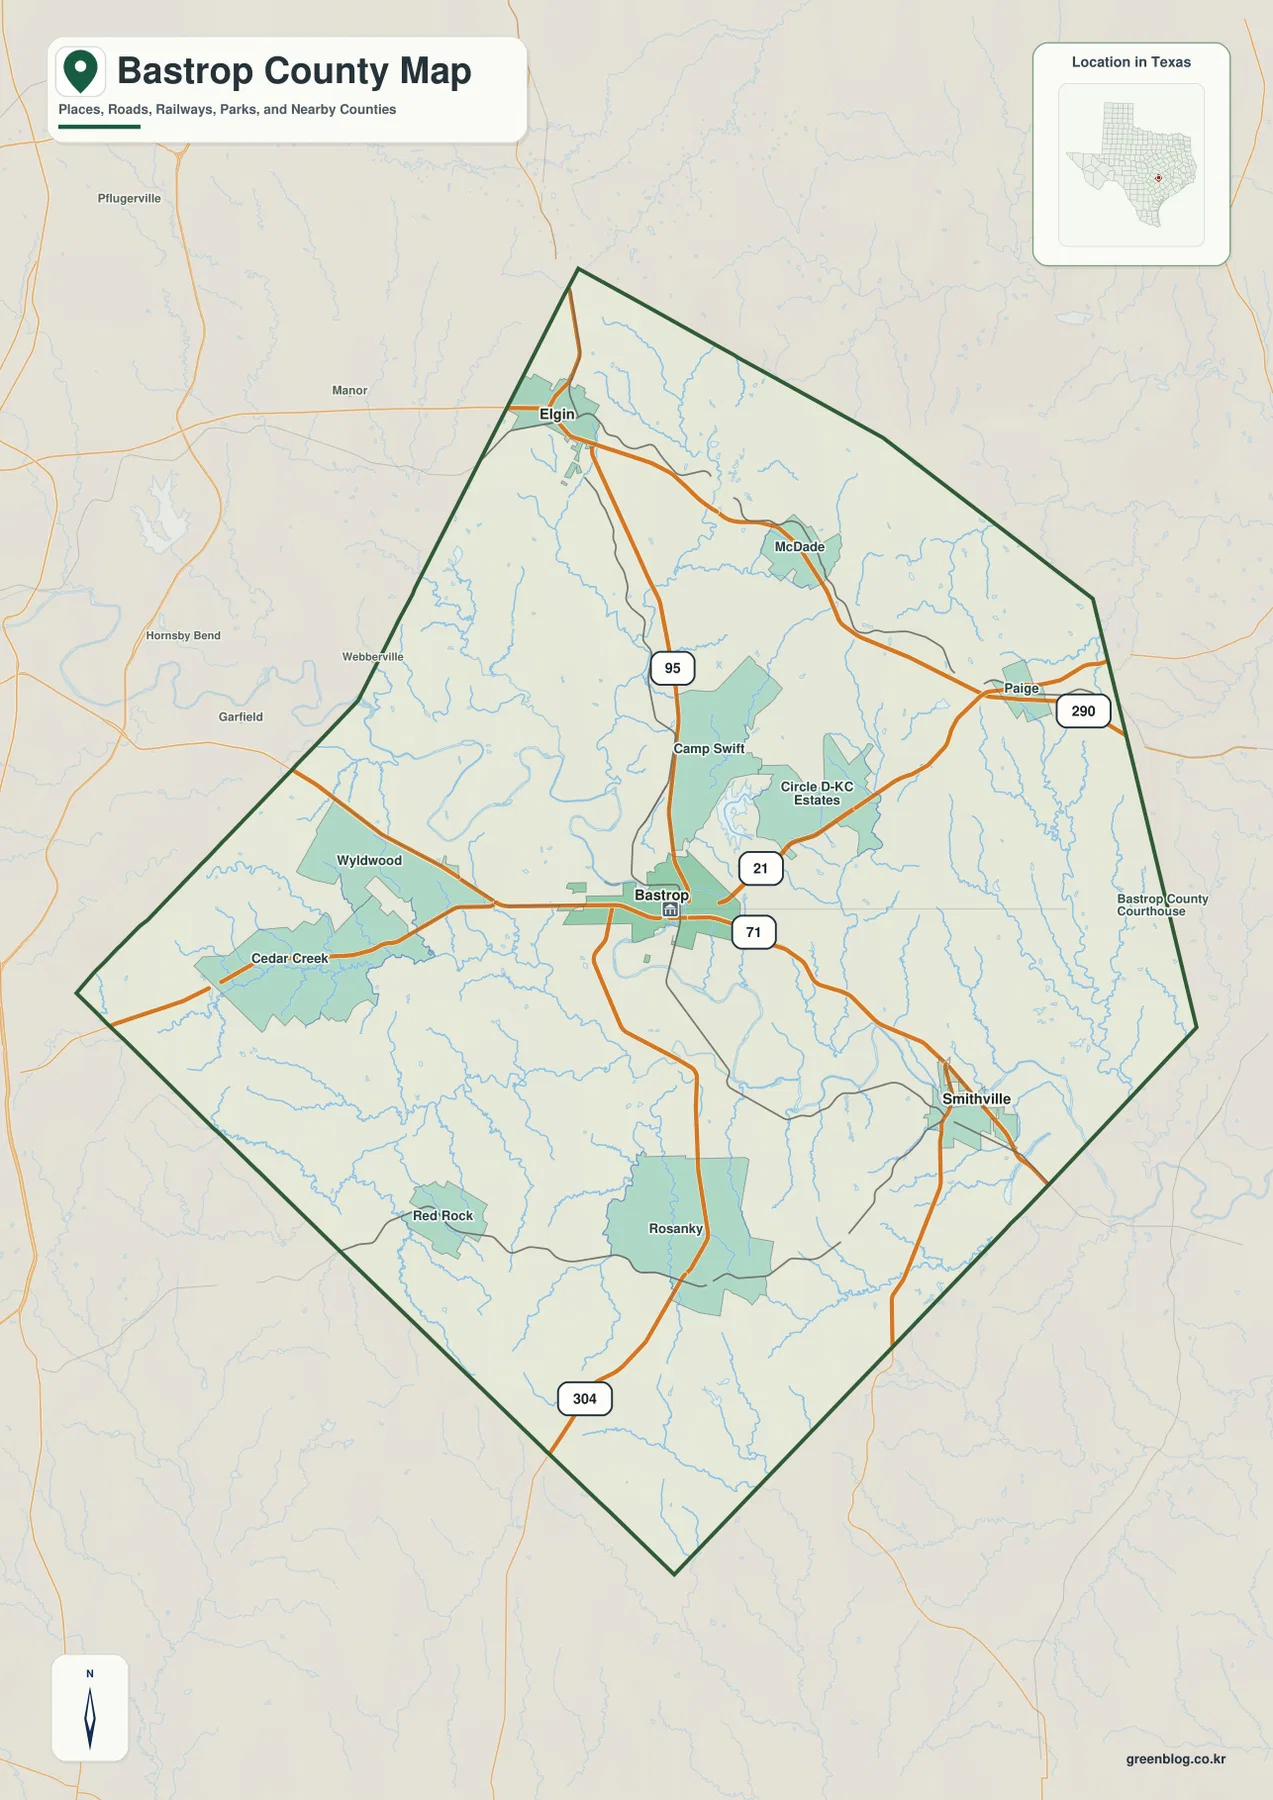
The map also includes a few places outside the county outline, including Manor, Webberville and Pflugerville, so the reader can keep the county in a wider regional setting. Those labels should not be mistaken for places inside Bastrop County; the dark green county boundary remains the deciding line. This is particularly useful along the western and northwestern sides, where the county faces the broader Austin area and nearby communities appear just beyond the border.
Elgin, Bastrop and Smithville form a simple northwest-to-southeast city reference
The city map strips away most of the place labels and highlights three numbered locations: Elgin at the northwest, Bastrop near the middle, and Smithville in the southeast. Their spacing immediately shows that the county has a long northwest-to-southeast dimension. The points are not clustered around one compact urban center, so the three-city view is a quick way to understand how the better-known settlements are distributed before adding roads, creeks and smaller communities back into the picture.
Neighboring county names frame this simplified view. Travis County appears on the west, Williamson County on the north, Lee County on the east, and Fayette County toward the northeast and east side of the surrounding frame. Caldwell and Gonzales are shown toward the southwest, while the name Milam County appears farther to the southeast of the mapped area. The frame is useful for direction, but the county outline itself is the feature to follow when deciding whether a particular point falls inside Bastrop County.
Bastrop does not sit at the exact geometric center of the outline, yet it works well as the practical middle reference between Elgin and Smithville. A reader can start at Elgin, follow the general southward connection toward Bastrop, then continue southeast toward Smithville. Once that three-point relationship is clear, places such as McDade, Paige, Cedar Creek and Rosanky are much easier to place on the more detailed general map.
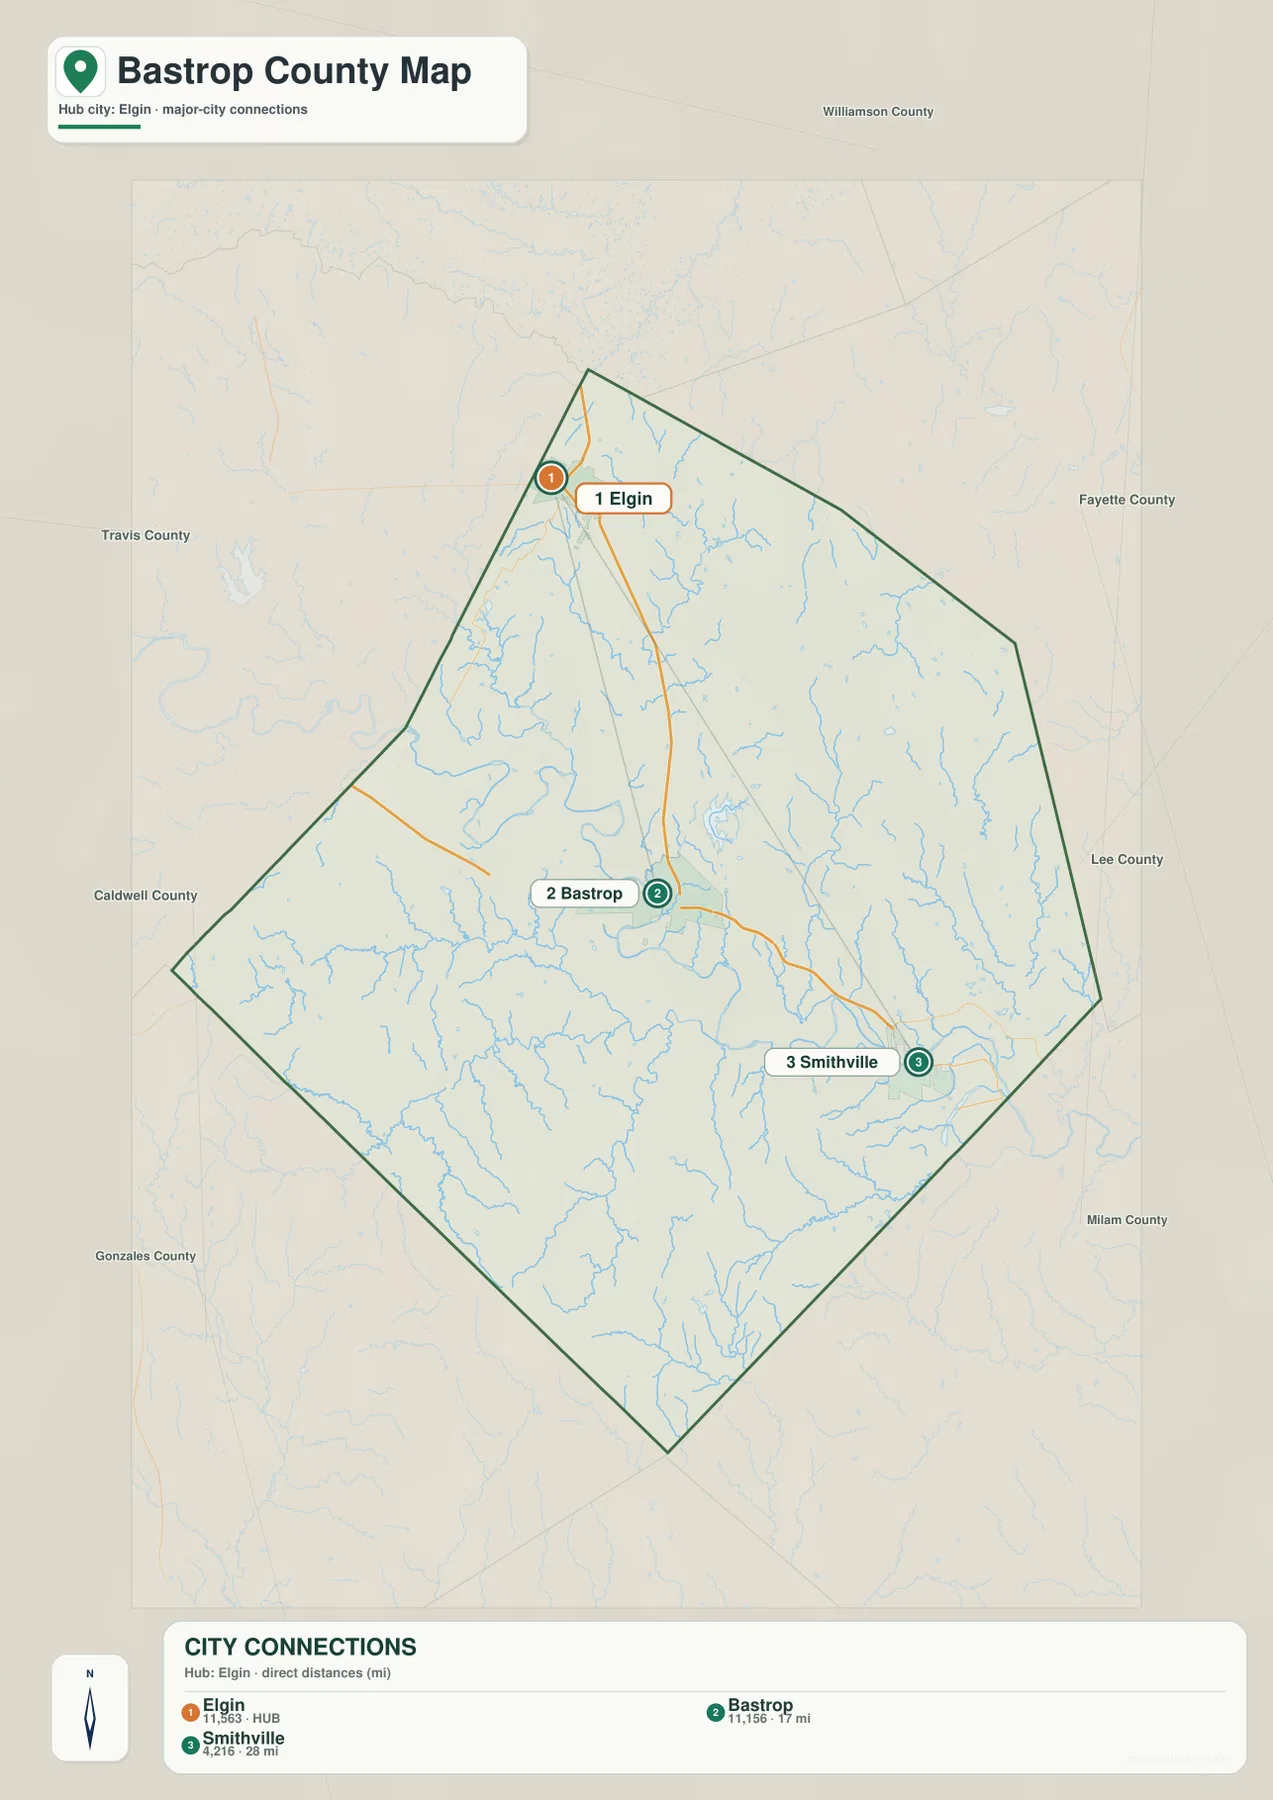
The numbered city symbols are best treated as the map’s selected reference points rather than as a complete list of communities or a population ranking. Cedar Creek, Paige and other places remain important geographic labels even though they are not numbered here. For a presentation or a quick county-location lesson, the simplified city sheet is useful because it removes visual competition. For local navigation and smaller place names, the general map is the better companion.
The Colorado River corridor gathers a dense network of creeks and small lakes
The terrain-and-water map changes the emphasis completely. Roads largely disappear, while a broad meandering river corridor crosses the center of the county from the northwest toward the southeast. The original page material and the Handbook of Texas identify the Colorado River as the major river that bisects Bastrop County in that direction. On the map, many smaller blue lines converge toward this low central corridor, making it easier to see how the county’s drainage is organized around the river rather than around its highways.
Several named creeks stand out in the northern half. Little Sandy Creek appears near the northwest, while Big Sandy Creek runs farther inside the county. Piney Creek is marked east of Lake Bastrop and continues southward, and Alum Creek occupies a more easterly position with branching tributaries. Near the eastern side, Pin Oak Creek is labeled as another long stream. These names make the water map useful for finding a creek by direction even when the same feature would be too small to label clearly on the road-focused map.
The western and southwestern side has its own set of named waterways. Cedar Creek runs from the western side toward the county interior, and Walnut Creek follows a winding course farther south. Numerous unnamed tributaries branch between them and toward the river corridor. That dense network is important visually: an area that can look open and simple on the county road map becomes a landscape divided by many small valleys once the hydrography is given priority.
Lake Bastrop is the most prominent named lake near the center-north of the county map. Other named water bodies are spread across several directions rather than concentrated in one cluster. Trigg Lake appears in the west, Droemer Lake, Lake Thunderbird and Indian Lake are grouped on the eastern side, Shipp Lake sits farther southeast, and Double D Lake appears in the south. These water names are useful as local reference points even though the map does not imply that the lakes are equal in size, use or hydrologic importance.
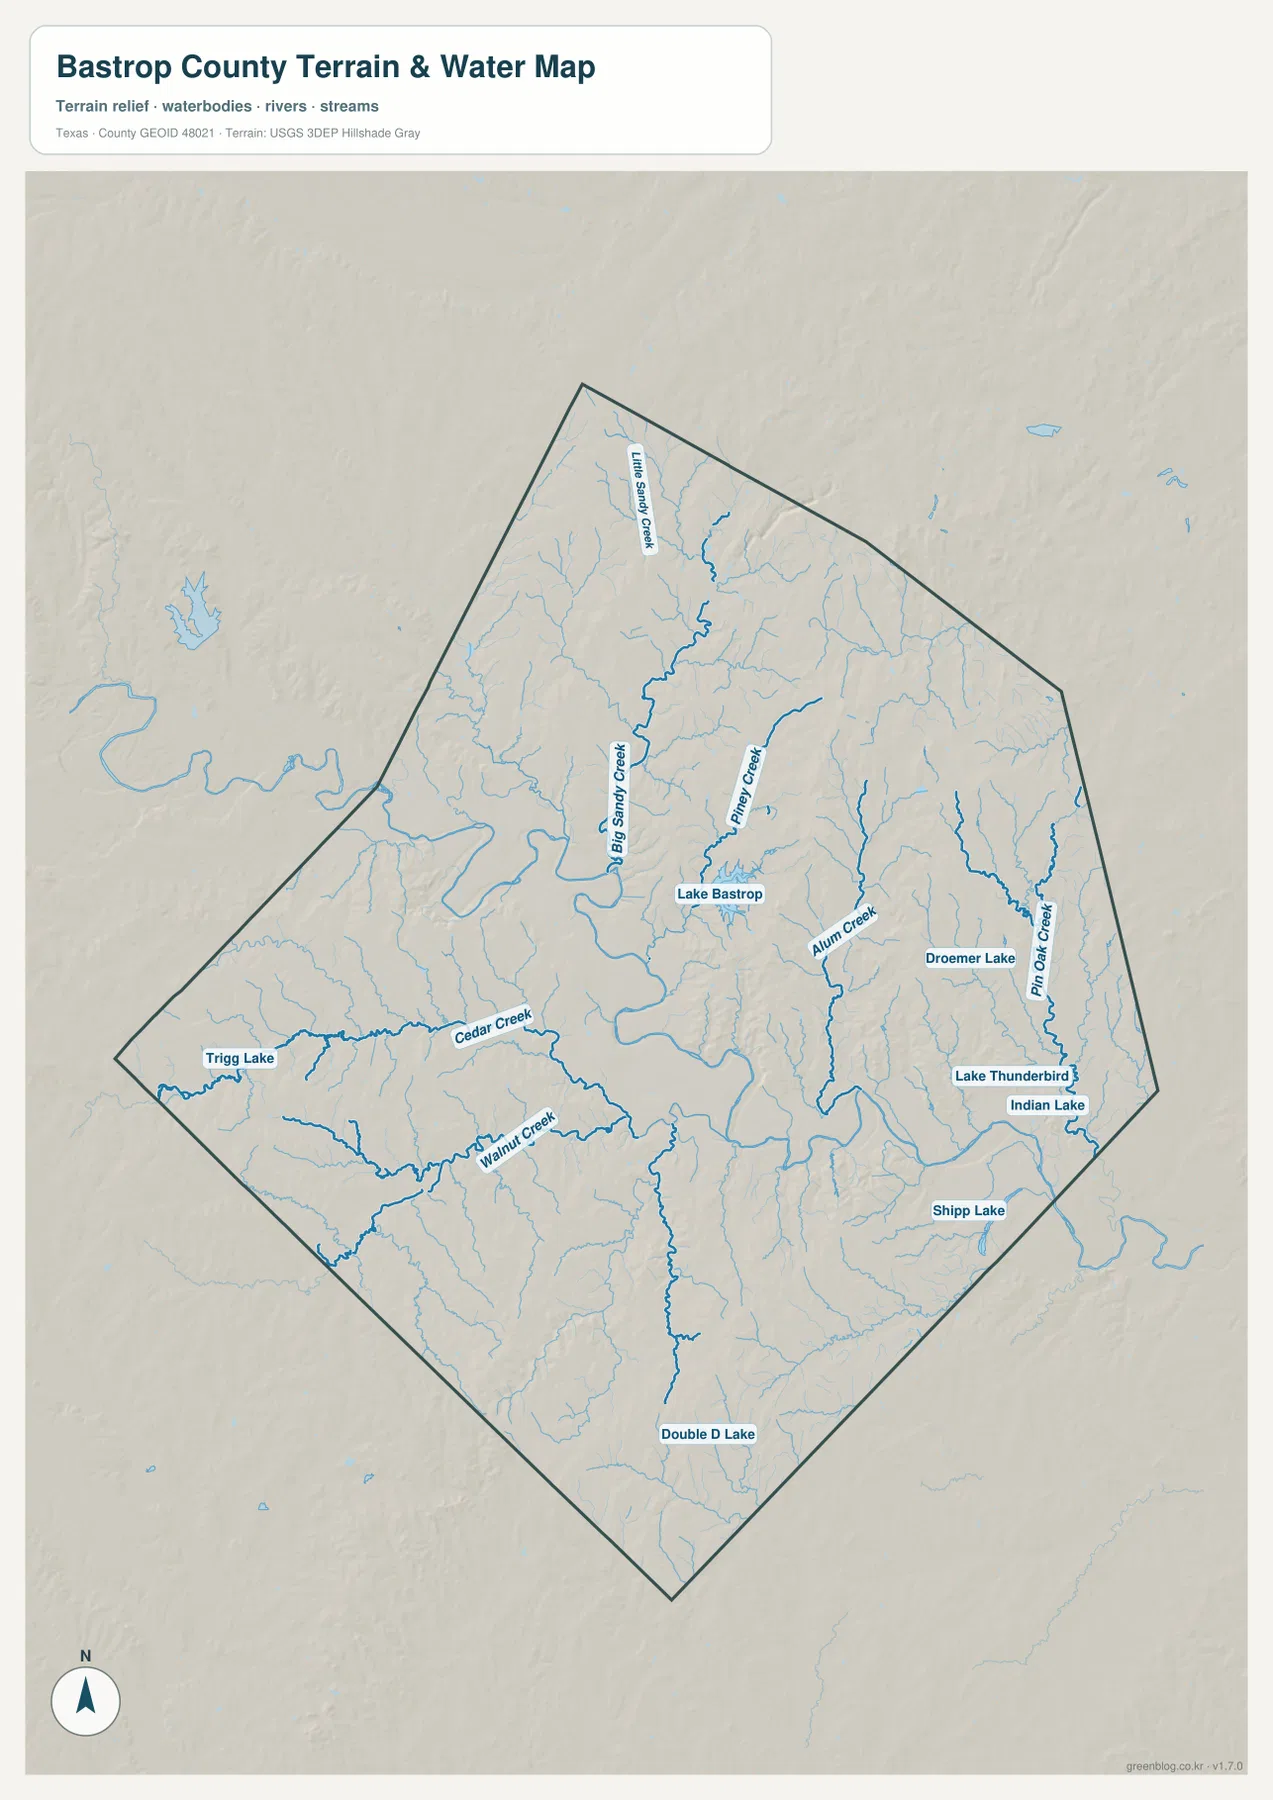
This sheet is a geographic reference, not a floodplain or legal-water-boundary map. A blue line shows the mapped position of a stream or water feature, but it does not by itself describe flood probability, channel ownership, regulatory setbacks or current water depth. Those questions require the appropriate official source. Here, the main value is seeing where named creeks and lakes sit relative to the county outline and how they connect visually to the central river valley.
An elevation range of about 79–223 meters reveals a low central valley surrounded by rolling uplands
The elevation map reports an actual county range of roughly 79 to 223 meters, with a mean near 142 meters. The most obvious feature is the green lowland that winds through the middle of the county in the same general path as the main river corridor on the water map. Higher yellow, orange and brown terrain rises on both sides. This makes the terrain much easier to understand than it is on the general road sheet, where the county can initially appear relatively uniform.
Higher ridges are especially visible in the northwestern and northeastern parts of the county, but the pattern is not a single continuous plateau. Narrow valleys cut between elevated areas and point toward the lower center. The west and southwest also contain broad sections of higher relief, interrupted by lower corridors that correspond well with the Cedar Creek and Walnut Creek side of the water map. The shaded relief therefore complements the stream network: many of the blue lines occupy the lower passages between ridges.
The eastern and southeastern parts contain more low green terrain along the river corridor toward the Smithville side, although higher ground rises again away from that valley. It would be misleading to describe the county simply as high in the west and low in the east. A better summary is that a lower, winding central corridor is enclosed by a patchwork of rolling uplands and ridges. That interpretation matches the supplied elevation colors much more closely and explains why the water network branches from many directions toward the center.
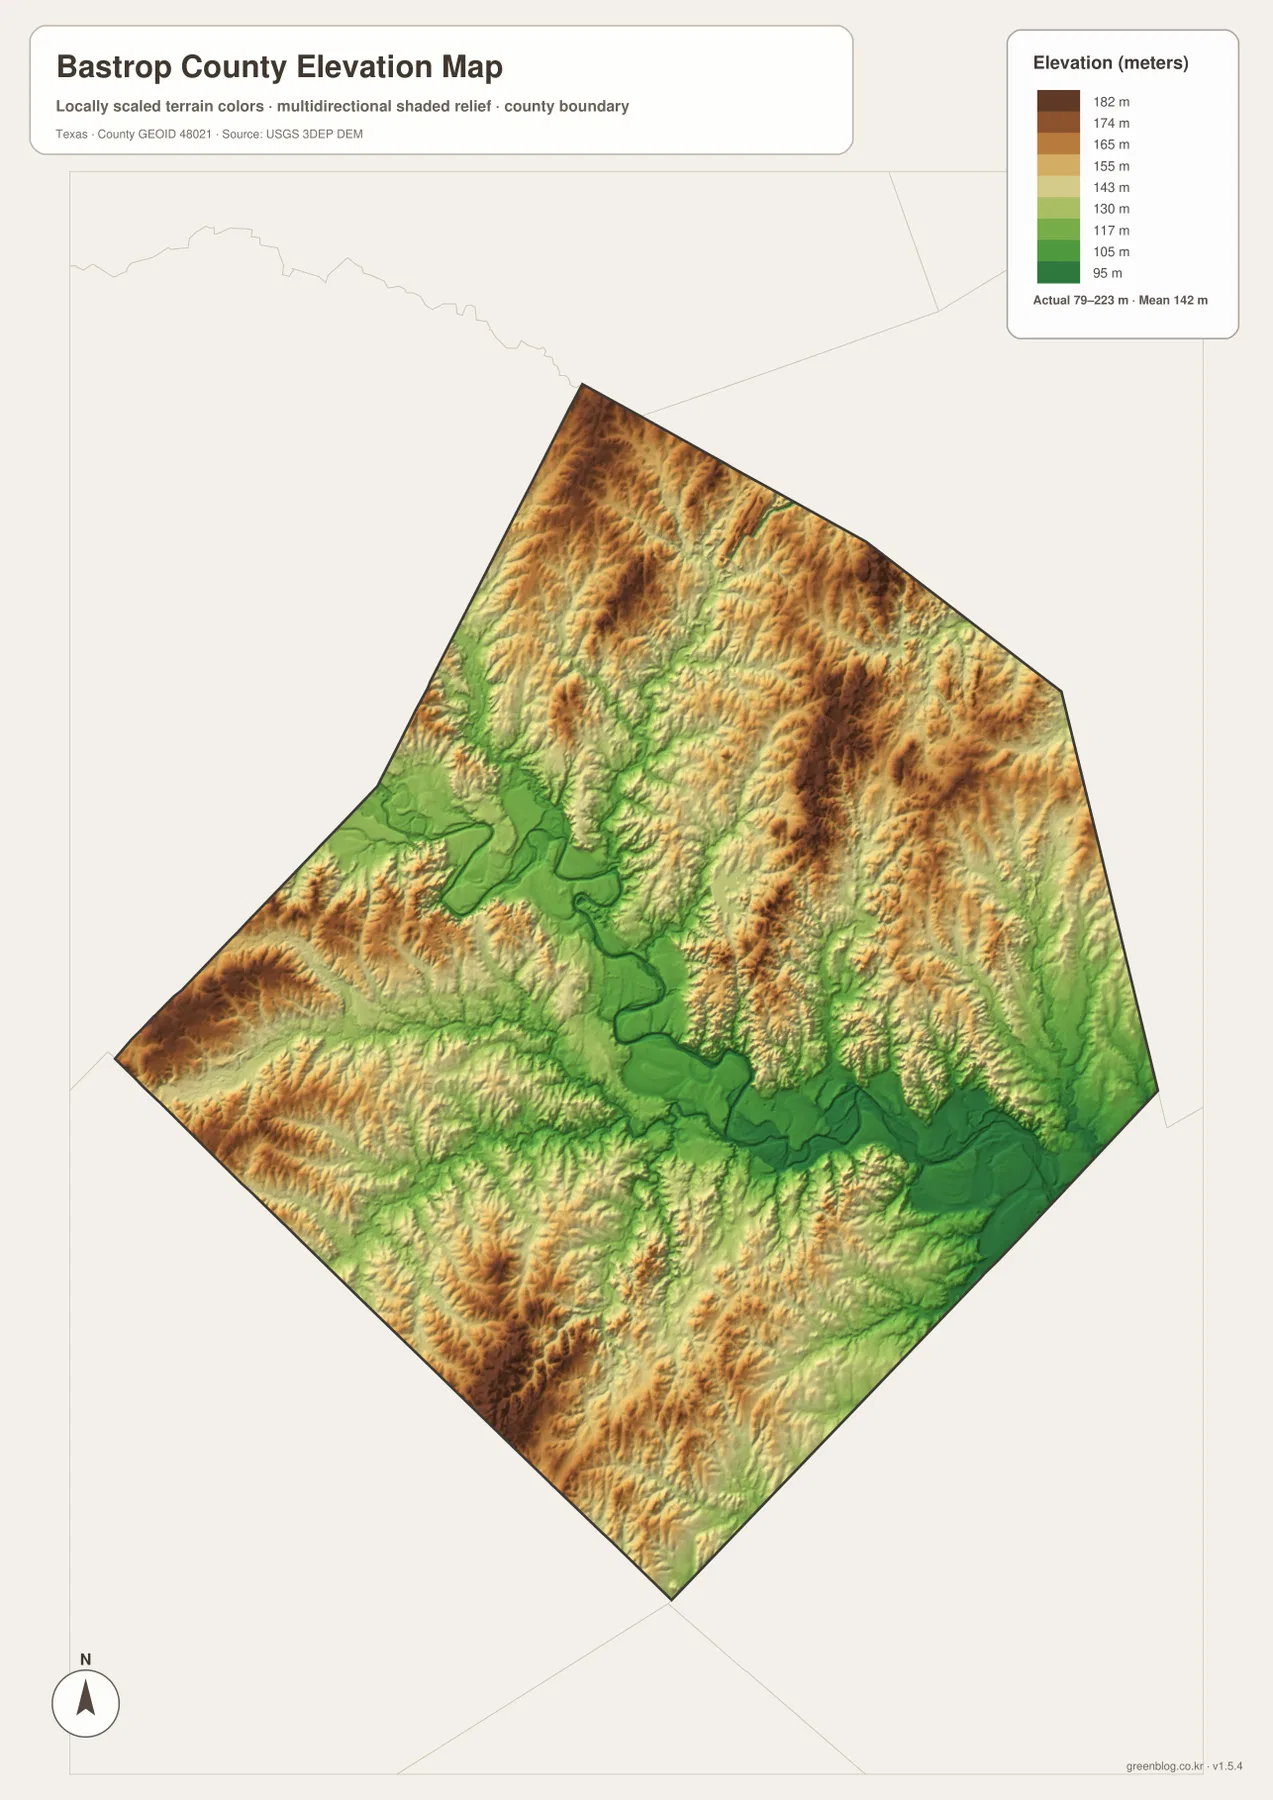
The color breaks are designed for county-scale comparison and should not be used as a substitute for a survey or a site-specific elevation check. An individual parcel may contain small changes that are not visible at this scale. For construction, engineering or precise drainage work, a higher-resolution source should be consulted. The purpose here is broader: to show which parts of the county are relatively low, where the ridges are concentrated, and how topography relates to the mapped water features.
The angled county outline makes neighboring labels useful orientation clues
Bastrop County does not have a simple rectangular outline. Its northwestern and northern sides are angled, the eastern side changes width, and the southern portion narrows into a long point. This shape matters when reading place labels near the edge. Elgin sits close to the northwestern side, Paige is near the eastern edge, and Smithville occupies the southeastern part of the county. A place name that looks close on the page can still be outside the county if it falls beyond the dark boundary line.
The surrounding labels help reduce that confusion. Travis County on the west and Williamson County on the north make Elgin’s position easier to place. Lee County frames the east side, while Caldwell and Gonzales appear toward the southwest. The map also places Fayette and Milam names in the broader eastern and southeastern frame. These names provide geographic context, but the dark outline should remain the primary guide for the county itself.
Using both the general and city maps is helpful because they present the same outline at different levels of detail. The general map is better for deciding whether a small community, road or lake falls near a county edge. The city map is better for explaining the overall shape without dozens of labels. For classroom use, presenting the simplified city view first and then moving to the detailed county map creates a natural progression from orientation to local detail.
Choose the map by the question: roads, cities, water or elevation
For general orientation, the county map is the best first sheet because it combines the boundary, principal roads and many named places. It is the most useful choice when looking for Bastrop, Elgin, Smithville, McDade, Paige, Cedar Creek, Rosanky or Camp Swift on one page. The city map is intentionally simpler and works well when the only goal is to show how Elgin, Bastrop and Smithville are spaced across the county.
For natural features, the water and elevation sheets are more informative than the road map. Locate Lake Bastrop, Big Sandy Creek, Piney Creek, Cedar Creek or Walnut Creek on the water sheet, then switch to the elevation sheet to see whether that feature lies in a lower valley or beside higher ground. The Colorado River corridor is especially clear when those two maps are compared: a winding water route on one becomes a broad green lowland on the other.
Printing the set does not require putting every type of information on one crowded page. The road-and-place sheet keeps settlement labels and routes together, while a lesson about the Colorado River valley can move directly from the water sheet to the elevation sheet without carrying every road label along. The ZIP below keeps all four high-resolution A3 JPGs together, so only the sheet needed for a specific task has to be printed. Legal boundary, flood, surveying and engineering decisions should still use the original agency data listed in the references.
Frequently Asked Questions
Where is Bastrop located within Bastrop County?
Bastrop is shown slightly south of the visual center of the county. It lies between Elgin to the northwest and Smithville to the southeast and is close to route shields for 71, 21 and 95. On the detailed map, Cedar Creek, Camp Swift and Rosanky provide useful surrounding references.
Which water features are easiest to find on the Bastrop County water map?
Start with the central Colorado River corridor and Lake Bastrop. Big Sandy Creek and Piney Creek help orient the northern side, Cedar Creek and Walnut Creek mark the west and southwest, and Alum Creek with Pin Oak Creek helps place the eastern side. Those named features make the smaller tributaries easier to follow.
What elevation range is shown for Bastrop County?
The supplied elevation map reports a range of about 79 to 223 meters and a mean of about 142 meters. The central river valley is lower than much of the surrounding rolling terrain, with higher ridges visible in several northern, western and southwestern areas. The values are for county-scale comparison rather than parcel-level surveying.
Sources and Reference Data
The descriptions above are centered on the four supplied maps. For county background or more detailed boundary, hydrography and elevation data, the following official and reference sources are useful companions. Agency source data should take priority for surveying, legal boundary, flood or engineering decisions.
- Bastrop County official website — county government and official local information
- Handbook of Texas: Bastrop County — county setting, the Colorado River and regional background
- U.S. Census Bureau TIGER/Line Shapefiles — official county and related geographic boundary files
- USGS National Hydrography — authoritative reference data for streams and water features
- USGS 3D Elevation Program — official elevation data for more detailed terrain work
Map File Information
The Bastrop County county map, city map, terrain-and-water map, and elevation map are bundled as four high-resolution A3 JPG files in one ZIP archive.
- Included Files: County map, city map, terrain-and-water map, and elevation map — 4 JPGs
- File Type: ZIP archive
Related Maps
Green Map creates custom-edited map images using open geographic data sources such as geoBoundaries, Natural Earth, OpenStreetMap, and government open data.
These maps are edited visual materials, not raw data files, and are provided for education, documents, presentations, and graphic reference.