A high-resolution four-JPG ZIP for the Baylor County Map is available to download on this page. The set includes a county reference map, a city-distribution map, a terrain-and-water map, and an elevation map. Together they make it possible to move from Seymour and the highway network to Lake Kemp, the Wichita River, southern drainage lines, and the county’s visible elevation differences without crowding every detail onto one image.
Baylor County is easiest to understand by starting near its middle. Seymour sits close to the center of the mapped county, several numbered highways meet there, and smaller place labels extend toward the west, east, and southeast. Water adds a second structure to the county: Lake Kemp and the Wichita River stand out in the north, while larger channels and numerous creeks cross the southern half. The elevation map then shows that these waterways occupy lower ground between broad uplands and steeper relief.
Table of Contents
Seymour is the clearest road reference in the county
On the county reference map, Seymour is more than a label near the middle. U.S. 82 runs through it from the Red Springs side of the county toward the east, while U.S. 183 and U.S. 283 are marked on the northbound corridor. U.S. 277 also connects through the central road network, and State Highway 114 heads southeast. Because several routes converge in a small area, Seymour gives the reader an immediate starting point for locating almost every other feature on the four maps.
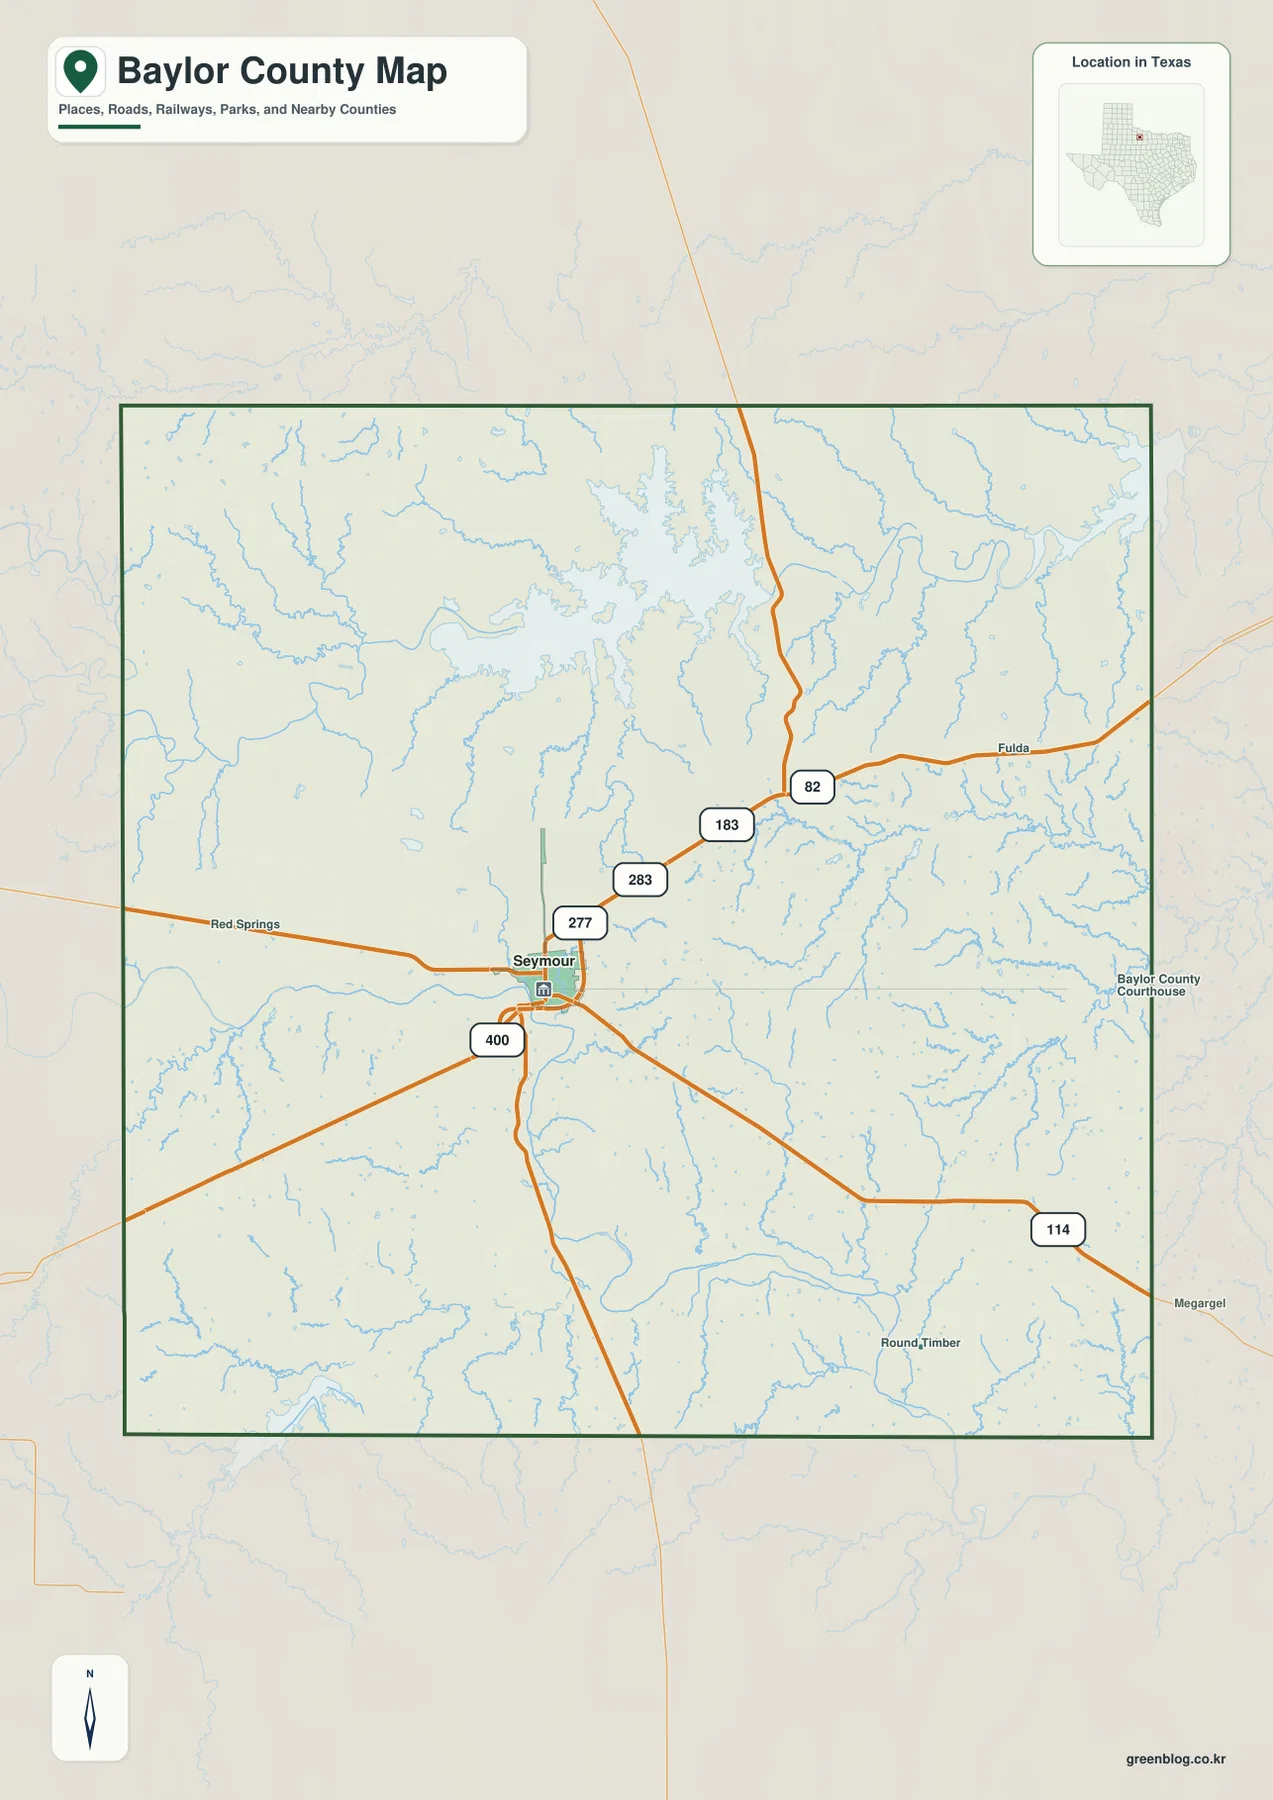
The smaller place labels make the road pattern easier to read. Red Springs appears west of Seymour along the east-west route, Fulda is labeled toward the east, and Round Timber lies to the southeast. Megargel is shown beyond the eastern side of the county frame, giving another outside reference for orientation. These places are useful not because they form a dense chain of towns, but because they mark distinct directions across a county where long rural stretches separate the named locations.
If you are trying to identify a route rather than a settlement, begin with U.S. 82 at Seymour and then follow the north-south highways away from the city. This prevents similar-looking rural roads from becoming confusing. The map also makes clear that a road-focused view and a water-focused view are not the same: the road system is centered strongly on Seymour, while the largest water features lie farther north and spread across a much broader area.
The city index narrows the map to one major center
The city-distribution map deliberately simplifies the settlement picture. Its City Index contains one ranked major city, Seymour, shown as number 1 with a value of 2,623. That makes this map different from county pages where several ranked cities compete for attention. Here the useful question is not which city is larger, but how the single major center sits inside the county and how roads extend from it toward surrounding rural areas.
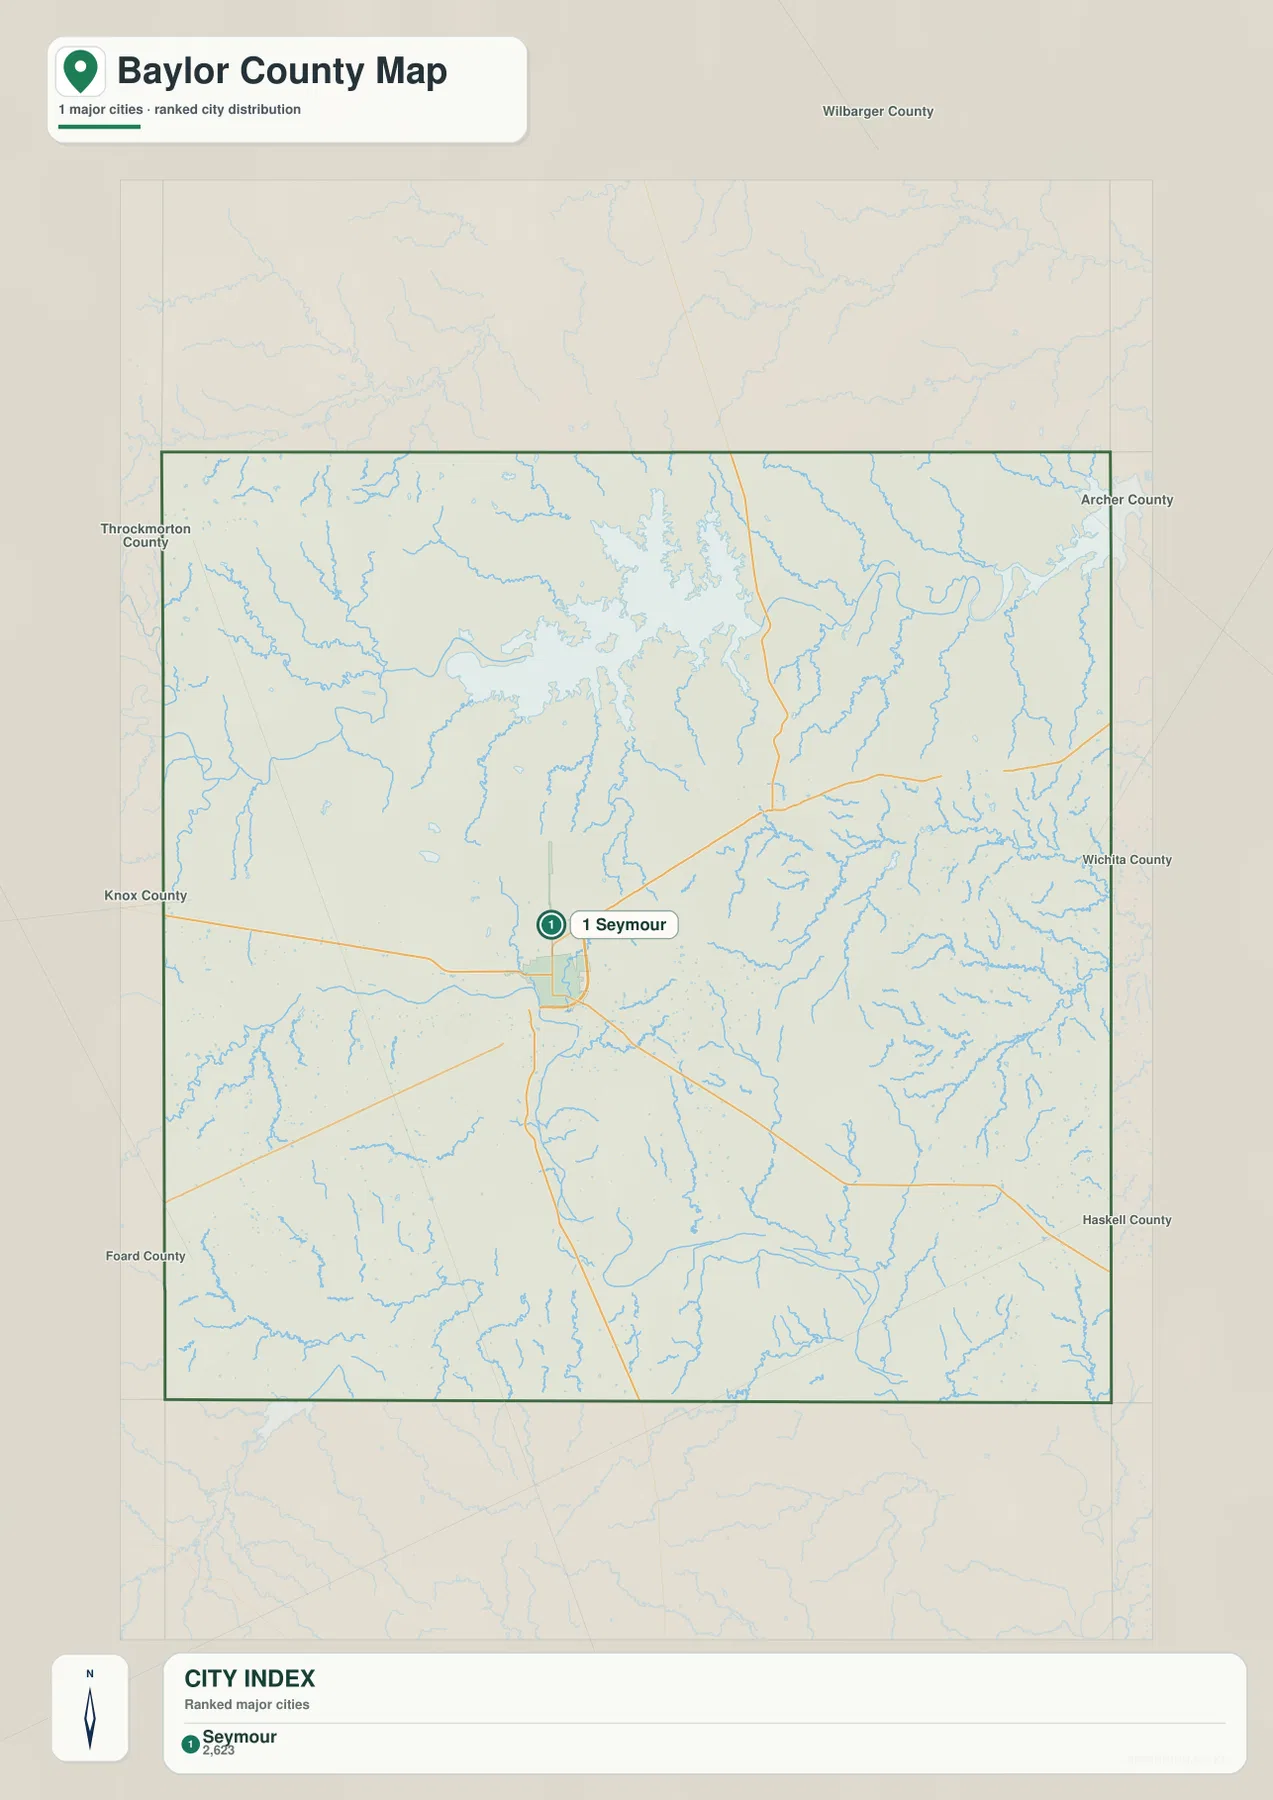
Names for surrounding counties appear around the map frame, including Wilbarger, Archer, Wichita, Haskell, Foard, Knox, and Throckmorton. Those labels help place Baylor County within a wider north-central Texas context without adding more city symbols inside the county itself. Since Seymour is not pressed against one edge of the county, it works well as a central reference for comparing approaches from several neighboring directions.
Used beside the county reference map, the two products answer different practical questions. The reference map is better when you need a named road, a small place such as Red Springs or Fulda, or a route leaving Seymour. The city map is cleaner when you want to show that the county’s primary urban reference is concentrated in one central location rather than distributed among several similarly ranked towns.
Lake Kemp and the Wichita River dominate the northern water map
The terrain-and-water map changes the visual emphasis immediately. Lake Kemp is the largest named water body in the northern part of the mapped area, with an irregular shoreline that reaches into several narrow arms. West of the lake, the Wichita River is labeled along a broad channel. Lost Lake and Peacock Lake provide additional nearby water references, while Crooked Creek enters the same northern landscape from the west. The number of small blue tributaries around these features shows why a dedicated water map is more useful than the road map for drainage questions.
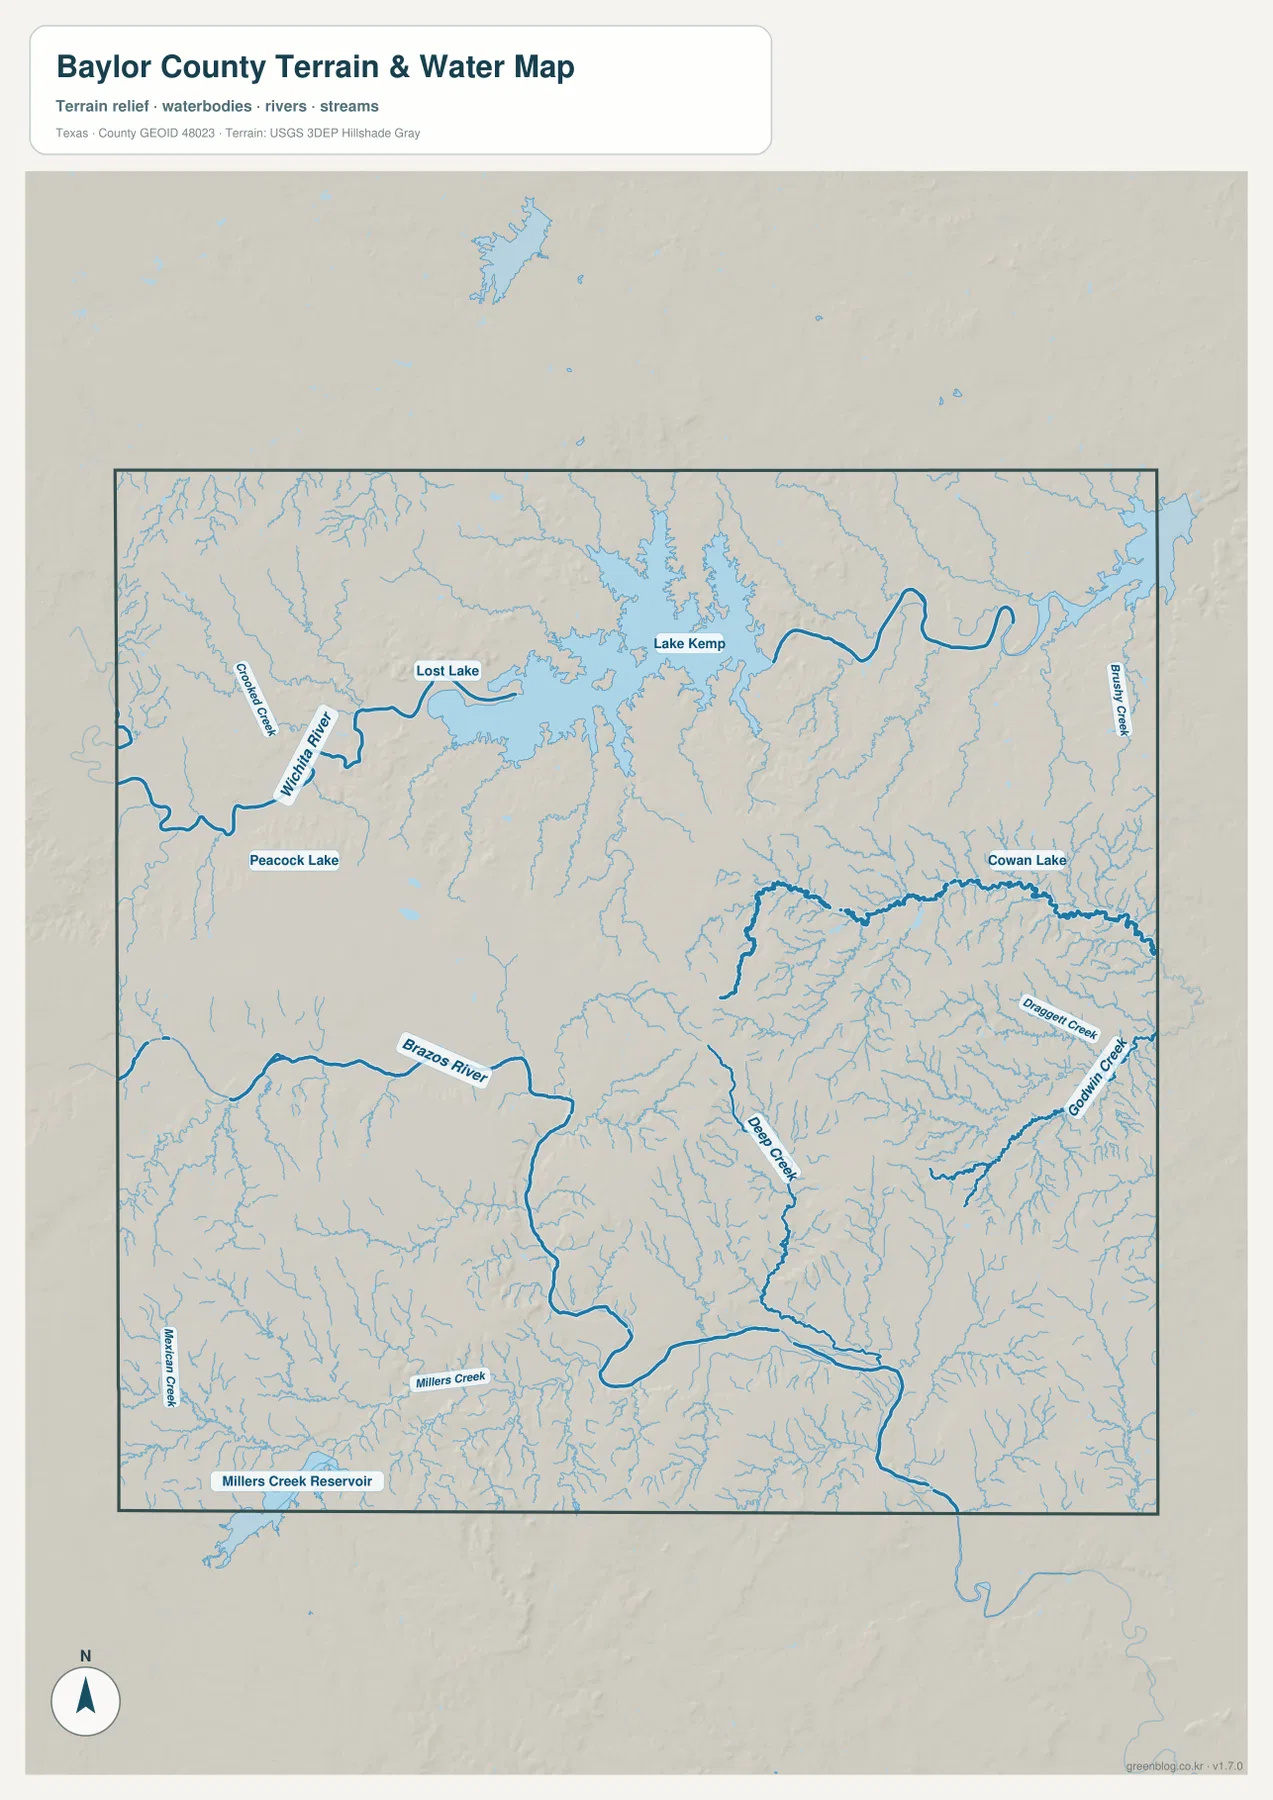
More named water features appear toward the eastern side. Bailey Creek is marked near the upper-right edge, Cowan Lake appears farther south, and Dugout Creek and Godwin Creek are labeled in the southeastern drainage network. None of these features needs to be treated as an isolated name. Their value comes from the way they establish a sequence of small channels between the northern lake system and the larger southern waterways.
This northern water network also corresponds with lower-looking terrain on the elevation map. The Lake Kemp area and several channel corridors appear greener than the broad brown uplands farther west and southwest. The two maps therefore complement each other: the water map tells you which channel or lake you are looking at, while the elevation map shows the relative low ground that contains many of those features.
Southern channels create a second geographic pattern
The southern half of the terrain-and-water map is not organized around one large lake. A broad channel labeled Brazos River runs across the lower part of the map, and Deep Creek descends through the central-southern area before joining the wider network. East of it, Dugout Creek and Godwin Creek create separate branches. This produces a long, connected drainage pattern that contrasts with the sprawling shoreline of Lake Kemp in the north.
Millers Creek and Millers Creek Reservoir are labeled in the southwest. They are particularly useful orientation points because the reservoir is easy to distinguish from the thin stream lines that surround it. When the number of creek labels becomes difficult to follow, a practical method is to use Lake Kemp as the northern anchor and Millers Creek Reservoir as the southwestern anchor, then trace the major channels between them.
The water product is a geographic reference, not a navigation chart or flood-risk map. It is appropriate for locating named lakes, rivers, creeks, and their general connections, but it does not provide survey-grade channel positions, current flow conditions, depth, or flood probability. Those questions require the relevant official hydrologic or local management sources rather than an overview map.
Elevation ranges from about 319 to 468 meters
The elevation map gives a measured scale for the relief that is only hinted at on the other maps. Its legend states an actual range of roughly 319 to 468 meters and a mean elevation of 384 meters. Green represents lower ground, while yellow, tan, and brown move toward higher terrain. Multidirectional shaded relief adds small ridges, slopes, and valleys so that the differences are visible even where the color change is gradual.
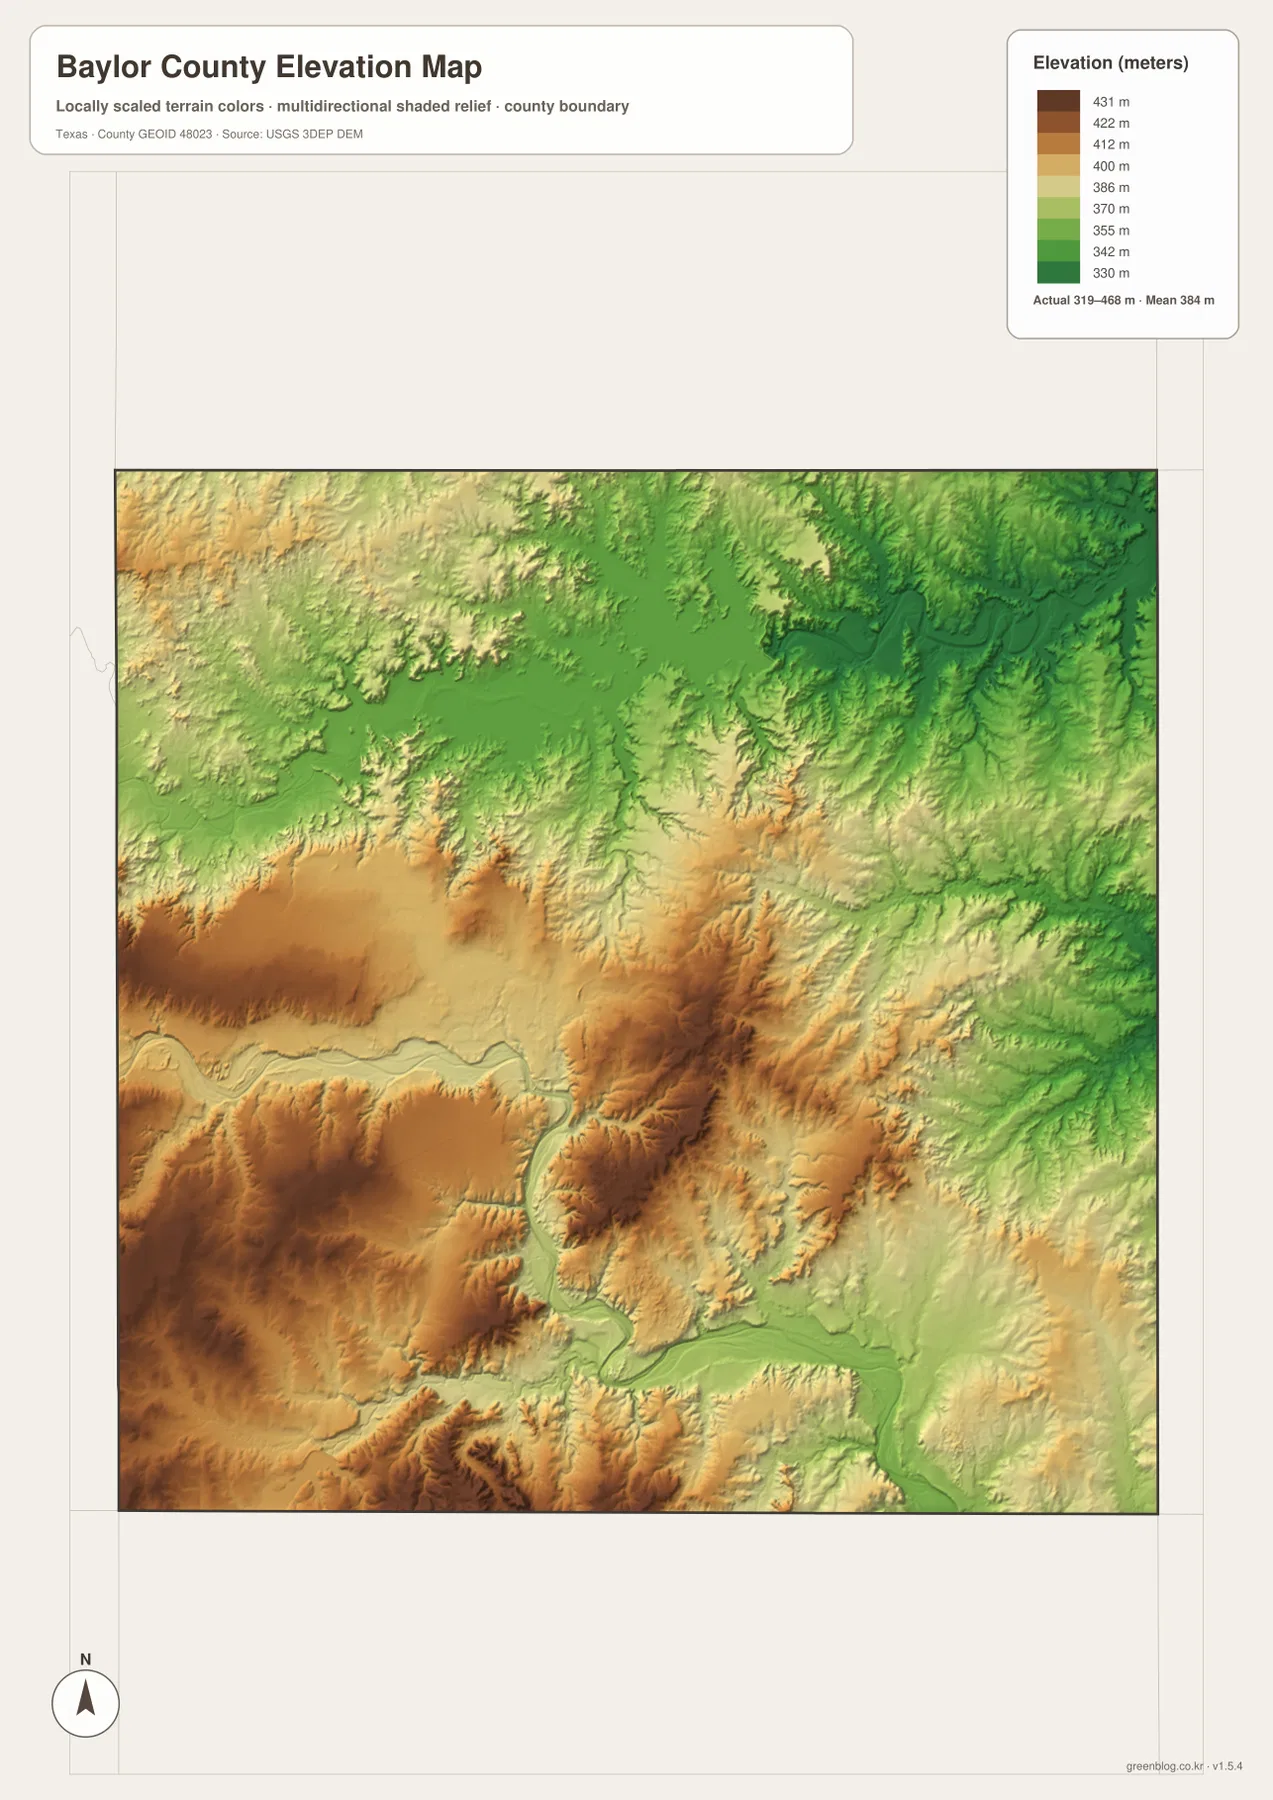
Higher brown terrain is especially noticeable in the west and southwest, with additional elevated blocks through the south-central portion of the county. In contrast, the north and northeast contain broader green areas, and low corridors wind through the relief where major water channels occur. The result is not a simple west-to-east slope. Instead, uplands are broken by branching valleys and river corridors that create repeated local changes in height.
The map legend includes intermediate steps such as 431, 412, 400, 386, 370, 355, 342, and 330 meters. Those values are useful for comparing broad areas, but the map should not be treated as a precise spot-elevation or engineering surface. If a project depends on exact height at a parcel, structure, or construction site, a survey or a more specialized elevation dataset is required.
What becomes clearer when the four maps are used together
Seymour is a good example of why the four products work better as a set. The reference map supplies road numbers and surrounding place names. The city map strips away much of that detail so the single major-city reference is obvious. The water map then shifts attention away from the road junction toward Lake Kemp, the Wichita River, the Brazos River label, and many smaller creeks. Finally, the elevation map shows which of those water corridors occupy lower terrain and where the surrounding uplands rise above them.
For route planning or a quick county orientation, start with the reference map. For a simple graphic showing where the county’s principal city sits, the city map is more effective. Questions about Lake Kemp, named creeks, or reservoir locations are better answered by the water map, while the elevation map is the best choice for comparing low river corridors with the higher western and southern terrain. Switching between these views prevents road, settlement, water, and relief information from becoming visually overloaded.
The same approach works for classroom or print use. A teacher can introduce Seymour and the highway system first, add the water layer to discuss the distribution of lakes and creeks, and then use elevation to explain why river corridors look different from the surrounding uplands. A traveler or local researcher may instead begin with a road, find the nearest named water feature, and then check the terrain around it.
A simple reading order for first-time users
First locate Seymour and U.S. 82 on the county map. From that central point, note the northbound U.S. 183 and U.S. 283 corridor, the U.S. 277 connection, and State Highway 114 toward the southeast. Red Springs, Fulda, and Round Timber then provide smaller directional references. Once that framework is clear, the city map confirms how strongly the major-city distribution is centered on Seymour.
Next move to the terrain-and-water map and find Lake Kemp and the Wichita River in the north. Continue southward to the Brazos River label, Deep Creek, and Millers Creek Reservoir. Finish with the elevation map, comparing the green river-and-lake corridors with the brown western and southwestern uplands. This sequence builds the county from familiar map elements—city and roads—toward water and relief without asking the reader to interpret every layer at once.
Frequently Asked Questions
Where is Seymour on the Baylor County maps?
Seymour is near the center of the county and sits at the main cluster of numbered highways. The county reference map is best for seeing the U.S. 82, 183, 277, and 283 connections, while the city map emphasizes Seymour as the only ranked major-city entry in the supplied index.
Which map should I use to find Lake Kemp and nearby creeks?
Use the terrain-and-water map. Lake Kemp is the large northern water body, with the Wichita River to the west and named features such as Lost Lake, Peacock Lake, Crooked Creek, Bailey Creek, and other tributaries around it. The elevation map is useful afterward if you also want to compare the surrounding low and high ground.
What elevation range is shown for Baylor County?
The supplied elevation map lists an actual range of about 319 to 468 meters with a mean of 384 meters. It is designed for comparing broad terrain differences, not for survey-grade spot elevations or engineering measurements.
Sources and Reference Data
The maps are intended as clear geographic references. For current source data or more specialized boundary, hydrography, and elevation work, consult the official datasets below. These sources are especially useful when a task requires details beyond what an overview county map is designed to show.
- U.S. Census Bureau TIGER/Line Shapefiles — boundary, road, and related geographic files
- USGS National Hydrography — official hydrography resources for rivers, streams, and water bodies
- USGS 3D Elevation Program — elevation and terrain source data
Map File Information
The downloadable ZIP contains the four Baylor County maps shown on this page as original high-resolution JPG files: the county reference map, city map, terrain-and-water map, and elevation map. Use the archive when you need larger images for printing, lessons, presentations, or side-by-side geographic comparison.
- Included Files: 4 high-resolution JPG maps
Related Maps
Green Map creates custom-edited map images using open geographic data sources such as geoBoundaries, Natural Earth, OpenStreetMap, and government open data.
These maps are edited visual materials, not raw data files, and are provided for education, documents, presentations, and graphic reference.