Walton County sits east of Atlanta, with Monroe near the middle of the county and a set of other communities spread toward the northwest, south, southwest, and east. The four maps on this page separate that geography into useful layers: a general county map for roads and boundaries, a city map for the distribution of six major places, a water map for the Alcovy River and named tributaries, and an elevation map for the county’s rolling relief. After reviewing the maps, you can download a ZIP containing four high-resolution A3 JPG files for printing, classroom use, local research, reports, or presentations.
The county does not have one single feature that explains everything. Monroe works as the most convenient central reference, but Loganville lies close to the northwestern edge and Social Circle is far to the south. The Alcovy River runs through a lower central corridor, while the northwestern part of the county rises into noticeably higher rolling ground. Looking at the roads, settlements, water, and elevation together therefore gives a much clearer picture than a single outline map can provide.
These are county-scale reference maps rather than parcel, navigation, engineering, or flood-hazard products. Small local roads and unincorporated communities may be omitted, and the elevation layer is a generalized terrain surface rather than a survey measurement for an individual site. The strength of the set is that it makes the county’s broad layout easy to explain while preserving enough named places, routes, streams, and terrain detail to distinguish Walton County from a generic Georgia county map.
Table of Contents
Monroe as the road hub inside Walton County’s angled boundary
On the general county map, Monroe is the easiest place to use as an anchor. Routes marked 78 and 10 run across the central part of the county, while Route 11 continues south from the Monroe area toward Social Circle. Routes 83 and 186 extend east toward Good Hope, and the western side includes 81, 138, and 20 near Loganville and Walnut Grove. The map does not attempt to label every local street, but it clearly shows that the county’s major routes do not form a simple grid; several corridors meet near Monroe and then separate toward different corners of the county.
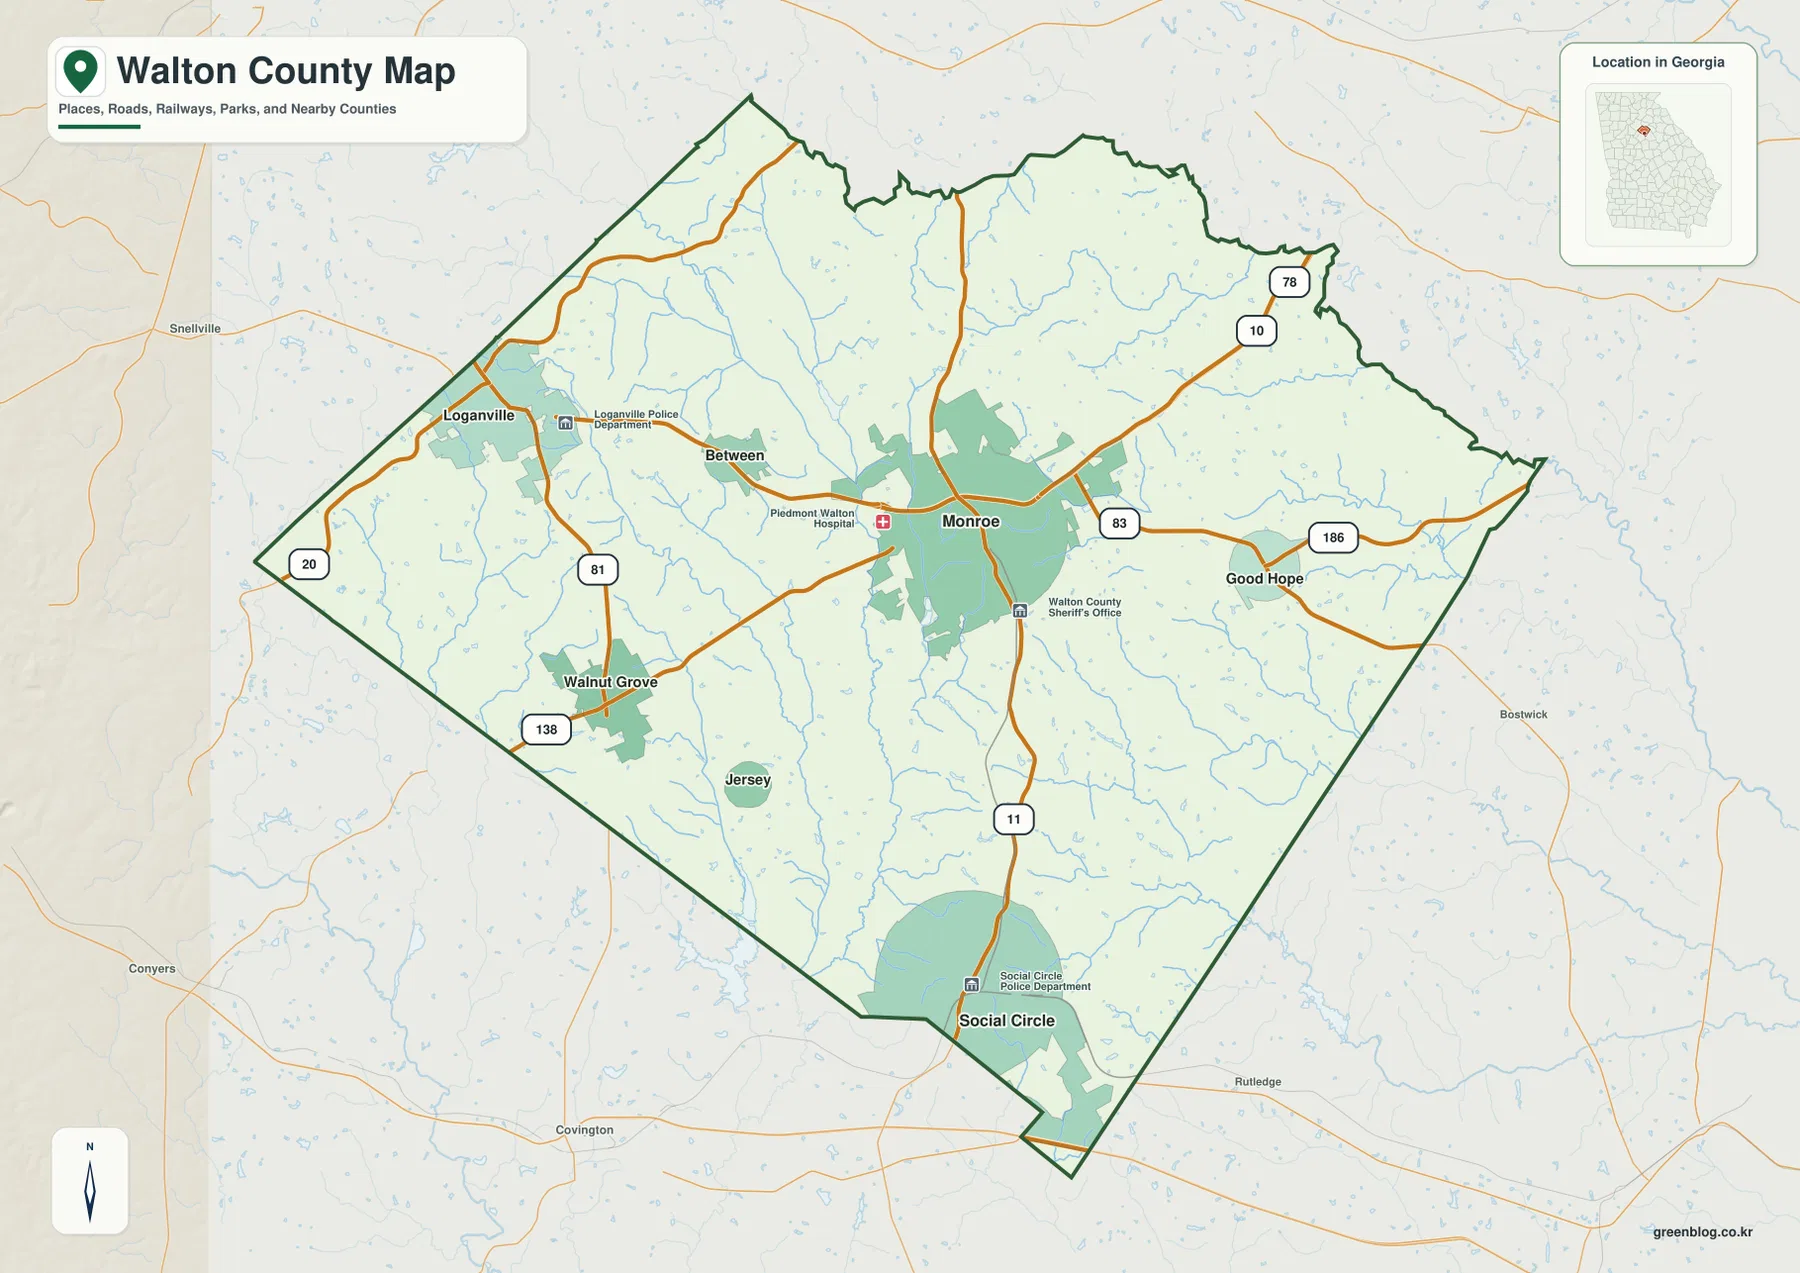
The communities are spread widely enough that direction matters. Loganville is close to the northwestern side of the county, with Between located between the Loganville area and Monroe. Walnut Grove lies to the southwest, Good Hope sits east of Monroe, and Social Circle is near the southern end of the county. Because those places occupy different sides of the map, Monroe is useful as a reference point without being a substitute for the whole county. A reader can quickly compare a destination with the county seat and then follow the relevant road corridor outward.
The county outline is also distinctive. It forms an angled shape with a narrower projection at the southern end rather than a simple rectangle. The city map places Barrow County to the north, Gwinnett County to the northwest, Newton and Rockdale Counties to the west and southwest, and Morgan, Oconee, and Clarke Counties on the eastern side. Those labels provide useful regional context, especially when the purpose is to explain where Walton County fits within the wider area east of metropolitan Atlanta.
Lightly shaded developed areas on the general map add another useful clue. Monroe occupies a substantial central patch, Loganville appears at the northwestern edge, and Social Circle forms a separate developed area near the south. Smaller places such as Between and Good Hope sit within much larger areas with fewer urban labels. This is not a municipal-boundary analysis, but the contrast helps explain why the county’s population and services are not represented by one continuous urban strip.
Six mapped cities spread from Loganville to Social Circle
The city-distribution map removes much of the road detail and ranks six places with numbered markers. Monroe is number 1 near the center, Loganville is number 2 in the northwest, Social Circle is number 3 in the south, Walnut Grove is number 4 in the southwest, Good Hope is number 5 in the east, and Between is number 6 northwest of Monroe. With fewer labels competing for attention, the map makes it immediately clear that Walton County’s principal places are dispersed rather than clustered tightly around the county seat.
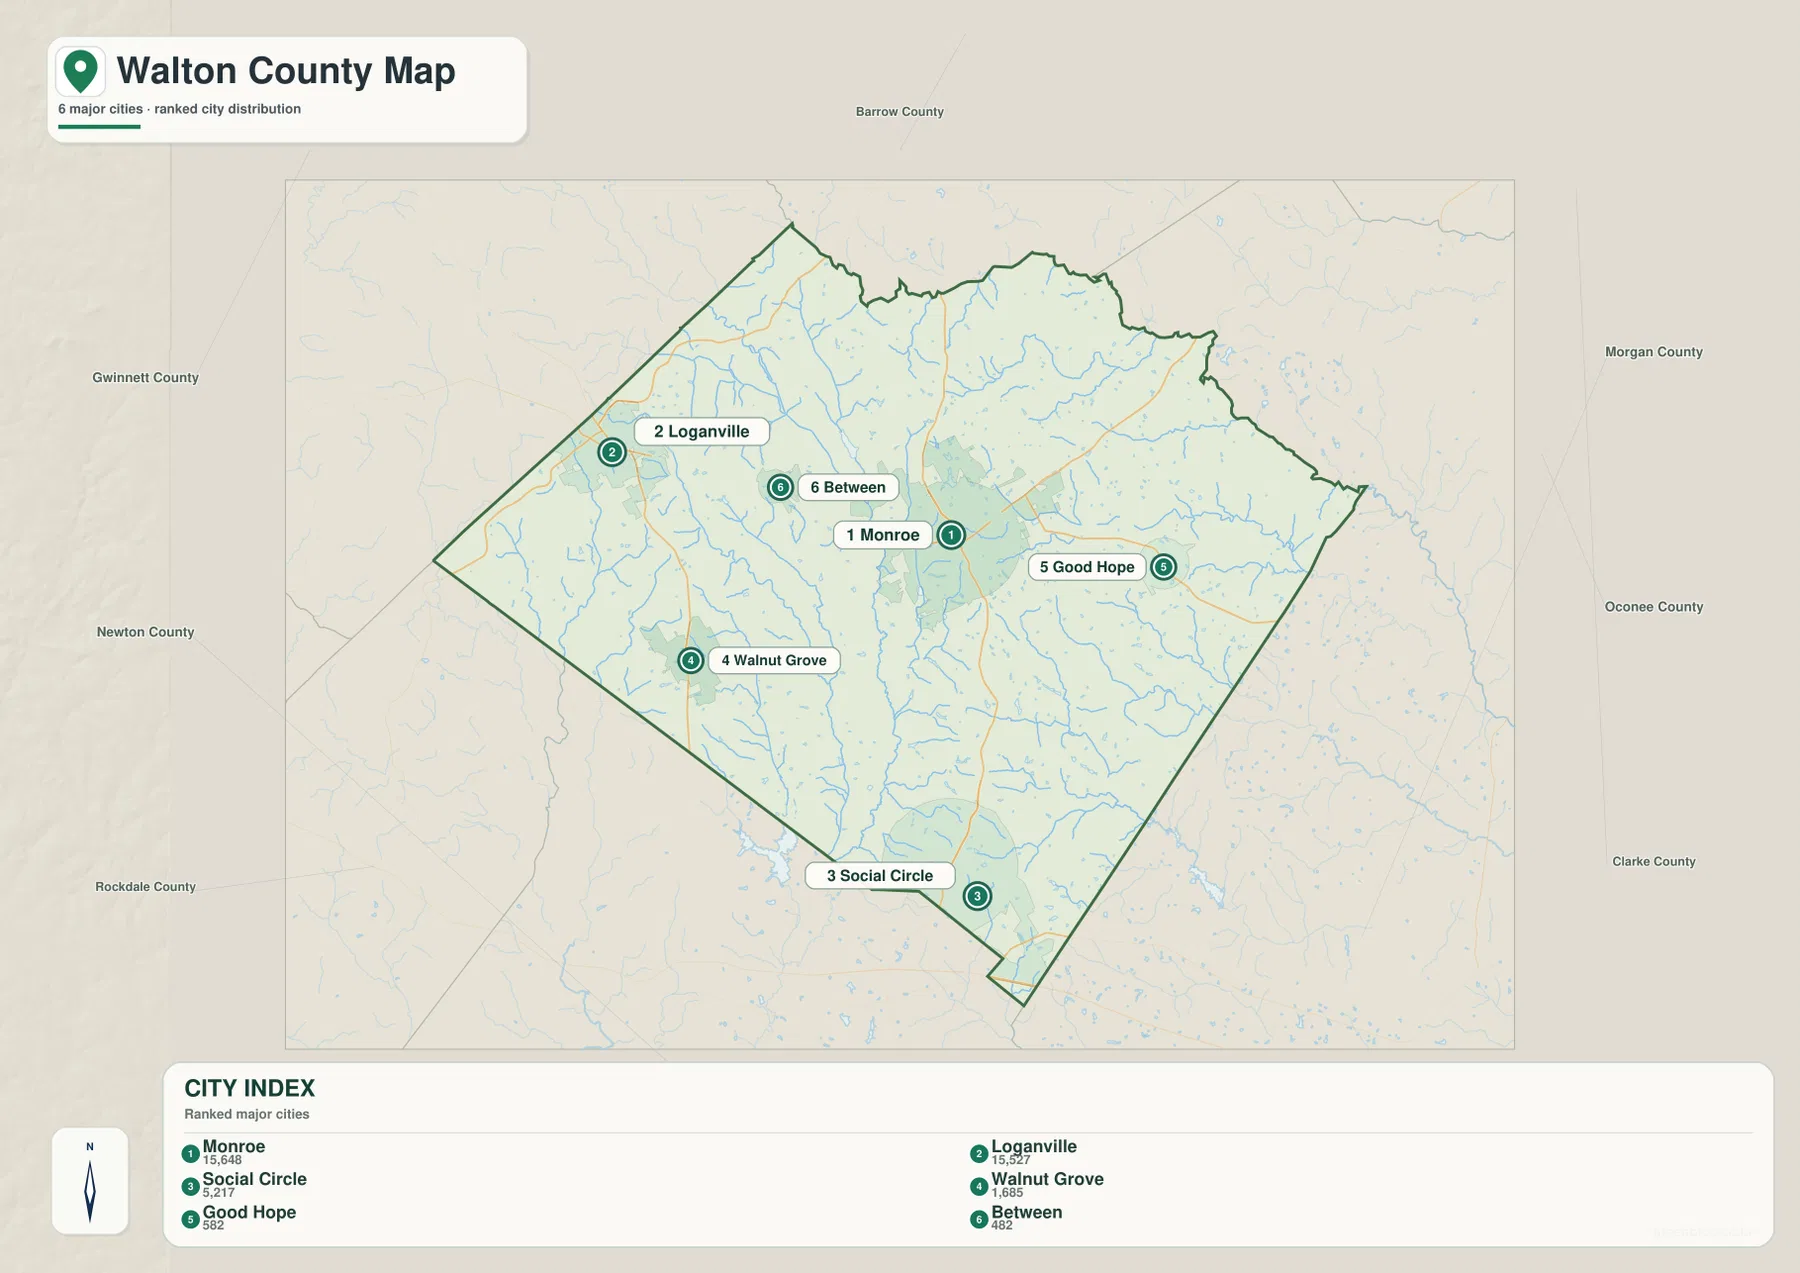
The index printed on the map lists Monroe at 15,648, Loganville at 15,527, Social Circle at 5,217, Walnut Grove at 1,685, Good Hope at 582, and Between at 482. Because the preview does not state a reference year for those figures, they are best treated as values used by this particular city index rather than as a claim about the latest official population count. What the index does show well is relative scale: Monroe and Loganville are presented with similar large values, Social Circle forms a clear second tier, and the remaining three places are much smaller in the map’s ranking.
Monroe and Loganville are a good example of why size alone does not describe the county. Their index values are close, yet their positions are very different. Monroe is an interior hub, while Loganville touches the northwestern side and is oriented toward communities outside the county as well as toward Monroe. Social Circle is separated from both by a long north-south span. Walnut Grove, Good Hope, and Between fill in the southwest, east, and northwest-central parts of the map, making the county’s settlement pattern more balanced geographically than a Monroe-only view would suggest.
Use the city map when the question is simply where the main places lie relative to one another. Use the general county map when route numbers, smaller labels, and boundary detail matter. That distinction is important in a presentation or classroom setting: the city map avoids visual clutter, while the general map supplies the extra context needed to explain how a trip or corridor reaches one of the outlying communities.
The Alcovy River corridor, branching creeks, and scattered lakes
The water map gives the Alcovy River the strongest visual emphasis inside Walton County. It runs from the north-central area through the middle of the county and continues toward the southern boundary. Mountain Creek and Big Flat Creek approach from the west, while Shoal Creek is labeled farther north. Jacks Creek crosses the eastern side and Hard Labor Creek appears in the southeast. The result is a branching drainage network rather than a county dominated by one broad river channel.
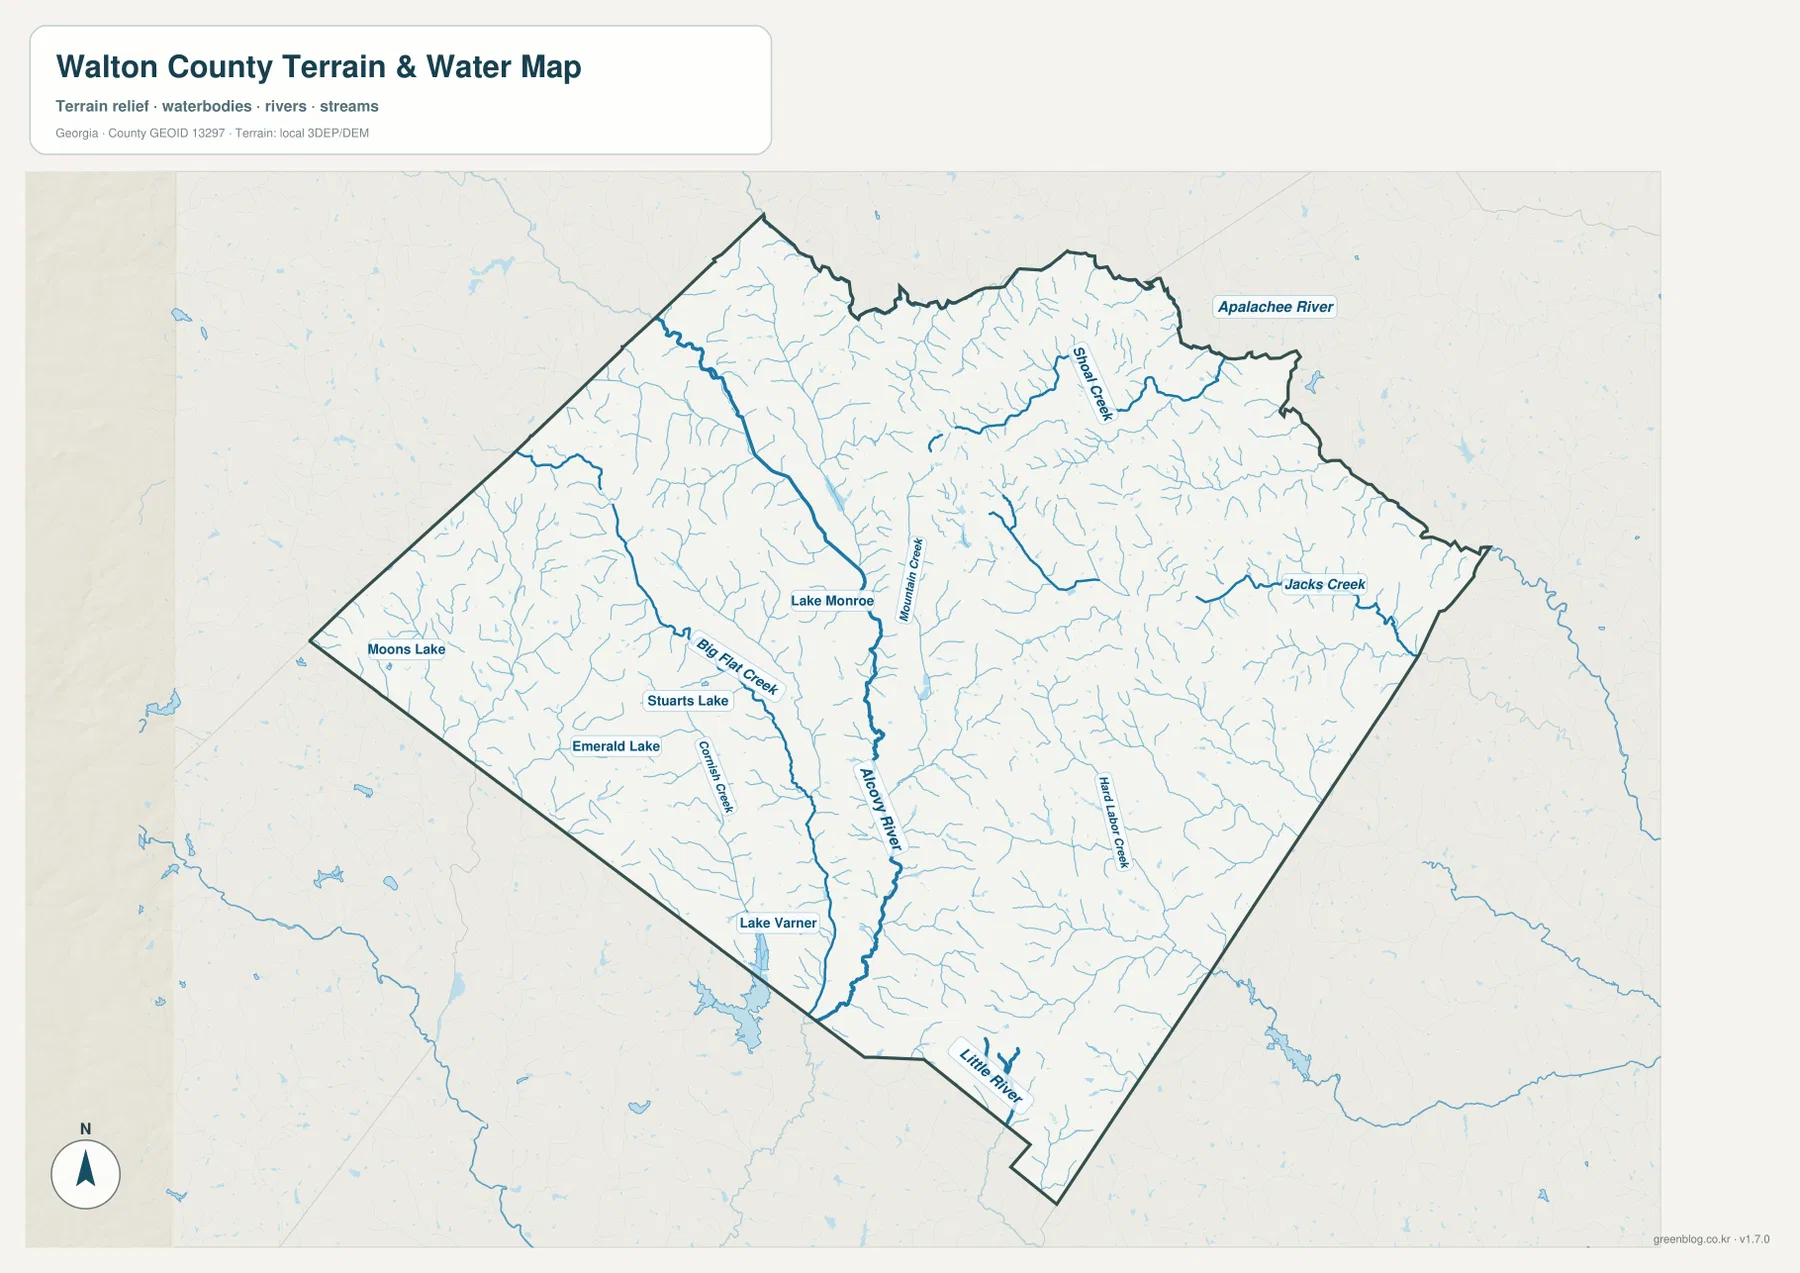
The Apalachee River is labeled beyond the northeastern side of the county, and the Little River appears near the narrow southern projection. Those external or edge features help place the internal network in a wider watershed setting without implying that every label lies wholly inside Walton County. Within the western half, Moons Lake, Stuarts Lake, Emerald Lake, and Lake Monroe are all named. Lake Varner sits close to the southern boundary. None of these individual lakes overwhelms the map, but together they show that the county’s water geography includes much more than the Alcovy River alone.
The density of smaller blue lines is another important feature. Numerous unnamed tributaries occupy the rolling terrain between the larger labeled creeks. That pattern becomes especially meaningful beside the elevation map, where lower green corridors repeatedly cut through higher ridges. In other words, the water map and terrain map reinforce one another: the streams tend to follow the lower parts of a landscape made up of many modest hills and valleys.
This water layer should not be used as a flood-zone, water-quality, or discharge map. A stream shown near a community does not by itself establish flood risk, and the presence of a lake label does not describe access, ownership, or recreational rules. For those questions, current agency data are necessary. The map is intended for geographic orientation: finding named waterways, seeing which part of the county they occupy, and comparing their routes with roads, communities, and elevation.
A 179–326 meter relief pattern with higher northwest hills and a lower central valley
The elevation map reports an actual range of about 179 to 326 meters and a mean of about 248 meters. Higher brown and orange terrain is concentrated most strongly in the northwest and western part of the county. A long green low corridor cuts through the central area from north to south, broadly matching the course of the Alcovy River. That connection is one of the clearest geographic relationships in the four-map set and gives the elevation colors an easy real-world reference.
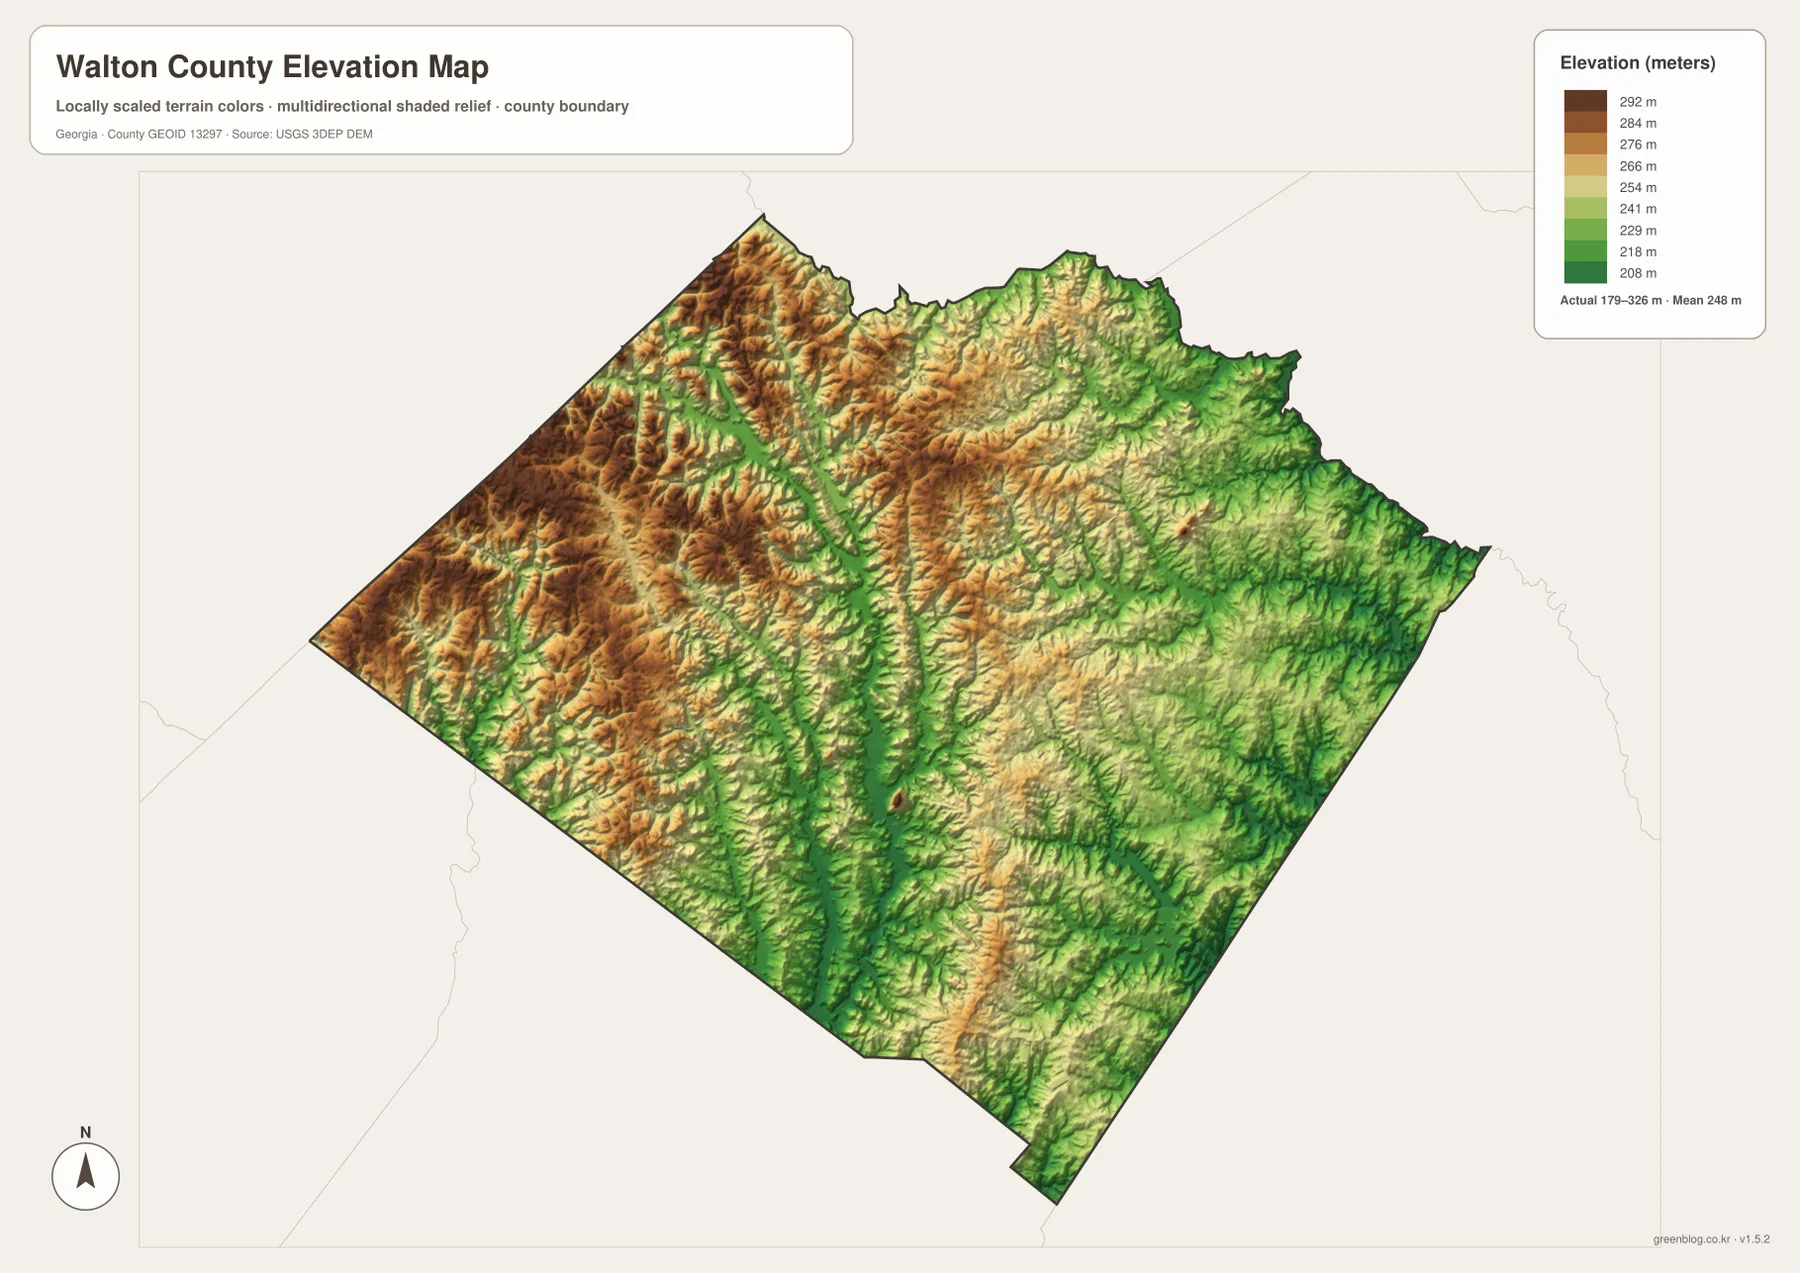
The terrain is not a single smooth slope. The northwest contains repeated ridges and small valleys, while the central low strip branches into narrower green channels. The eastern and southeastern sides mix lower ground with intermediate ridges rather than forming a completely flat plain. This repeated high-low texture is typical of a rolling landscape and explains why the water map contains so many branching tributaries even though Walton County does not have the extreme mountain relief seen farther north in Georgia.
Settlement patterns can also be compared with the relief. Loganville occupies the generally higher northwestern side, Monroe lies closer to the mixed central terrain, and Social Circle is farther south near the narrowing end of the county. The map should not be used to calculate the precise elevation of a building site or the grade of a road, but it is useful for explaining why different parts of the county feel geographically distinct and why river valleys form visible low corridors between surrounding hills.
Pairing the elevation map with the water map is particularly helpful for students and local researchers. Start with the Alcovy River on the water layer, then find the matching green corridor on the terrain layer. Repeat the comparison with Shoal Creek, Jacks Creek, or smaller tributaries. The exercise turns color shading into a concrete geographic relationship rather than treating elevation as an abstract set of numbers.
Reading the cities, water, and terrain together
The four maps become more useful when the same location is checked across several layers. Monroe, for example, is a central road hub on the general map. On the water map, the Alcovy River and Mountain Creek occupy the broader central area, while the elevation layer shows a mix of low corridors and surrounding ridges. Describing Monroe as simply “in the middle of the county” misses those connections; its location makes more sense when roads, water, and terrain are viewed together.
Loganville presents a different combination. It lies near the northwestern edge on the city map, and the elevation map shows some of the county’s highest widespread terrain in that same quadrant. Numerous small drainage lines cut through the hills on the water map. Social Circle, by contrast, is near the southern end where the county narrows and where the lower central drainage corridor meets a mix of rolling terrain. The contrast illustrates why Walton County should not be described as one uniform suburban or rural surface.
Good Hope and Walnut Grove provide useful east-west anchors. Good Hope is east of Monroe near the 83 and 186 corridors, while Walnut Grove lies southwest near routes 81 and 138. Checking those places on the terrain and water layers demonstrates the width of the county and the way ridges and tributaries vary from one side to the other. Between, positioned northwest of Monroe, helps fill the gap toward Loganville and makes the northwestern settlement pattern easier to follow.
This cross-reading approach is also a practical way to use the maps in a project. Find a community on the general map, note its route connections, switch to the water layer to identify nearby streams or lakes, and then compare the elevation colors. The result is a short geographic profile built from visible evidence rather than a generic list of map types. It is especially useful when explaining why two communities in the same county can occupy noticeably different local settings.
Choosing the Walton County map that fits the question
Start with the general county map when you need the boundary, Monroe, the outlying communities, and major route numbers on one page. Switch to the city map when a clean comparison of the six ranked places is more important than road detail. The water map is the best choice for locating the Alcovy River, named creeks, and scattered lakes. The elevation map is designed for comparing the higher northwest with the lower central river corridor and the county’s overall 179–326 meter relief.
In a classroom or presentation, the clearest map is usually the one that answers a single question well. A slide about where Social Circle sits relative to Monroe does not need every creek label. A discussion of the Alcovy River does not need the city ranking at the same time. When the goal is to explain why the river follows a lower corridor, however, placing the water and elevation maps side by side adds useful context that neither map can provide by itself.
- County map: Monroe, Loganville, Social Circle, major roads, boundary, and broader place context
- City map: the relative distribution of six ranked places across the county
- Water map: Alcovy River, Shoal Creek, Jacks Creek, Hard Labor Creek, smaller tributaries, and named lakes
- Elevation map: the approximately 179–326 meter range, higher northwest hills, and lower central river valley
The WEBP images in the article are lightweight previews for on-page viewing. For printing or closer inspection of labels, use the original JPG files in the ZIP below. The archive contains separate county, city, water, and elevation maps at high-resolution A3 size, so you can use only the layer needed for a project without extracting information from a crowded all-in-one image.
These maps are geographic reference products, not legal survey documents, parcel maps, flood determinations, or turn-by-turn navigation tools. The water layer does not state flood probability or water quality, and the elevation layer should not be treated as a survey-grade value for a property. When exact boundaries, current road conditions, hydrology, or site elevation matter, consult the appropriate official dataset or local agency in addition to these overview maps.
Frequently Asked Questions
How are Monroe, Loganville, and Social Circle positioned within Walton County?
Monroe is near the center of the county, Loganville is close to the northwestern edge, and Social Circle is near the southern end. They are not one compact cluster. Walnut Grove is southwest of Monroe, Good Hope is to the east, and Between lies northwest of Monroe on the way toward Loganville.
What relationship can I see between the Alcovy River and the elevation map?
The Alcovy River runs through the central part of the county, and the elevation map shows a lower green corridor along much of the same north-south direction. That comparison helps explain the river’s valley setting between surrounding rolling hills. It does not, however, establish flood risk or the exact elevation of any individual property.
What is included in the Walton County map download?
The ZIP includes four separate high-resolution A3 JPG files: a county map, city map, water map, and elevation map. The WEBP images on the webpage are lighter previews, while the JPG files are better suited to printing and large-format viewing.
Sources and reference data
The following public sources provide county background, boundary, water, and elevation information that can be consulted alongside the maps on this page. Use the underlying official data when a project requires more precision than a county-scale reference graphic can provide.
- U.S. Census Bureau QuickFacts — county statistics and background
- Official Walton County overview — county information
- New Georgia Encyclopedia: Walton County — local history and context
- U.S. Census Bureau TIGER/Line Shapefiles — boundary and road reference data
- USGS National Hydrography — streams and waterbody reference data
- USGS 3D Elevation Program — elevation and terrain reference data
Map File Information
The ZIP contains four Walton County maps as high-resolution A3 JPG files: county, city, water, and elevation. Use them for printing, classroom geography, local research, reports, and presentations.
- Included Files: County map, city map, water map, elevation map
- File Type: ZIP containing four high-resolution A3 JPG files
Related Maps
Green Map creates custom-edited map images using open geographic data sources such as geoBoundaries, Natural Earth, OpenStreetMap, and government open data. These maps are edited visual materials, not raw data files, and are provided for education, documents, presentations, and graphic reference.