Long County is easiest to orient around Ludowici, the county seat and the clear road center in the supplied maps. You can download the complete four-map set on this page as a ZIP of high-resolution A3 JPG files, while the article uses lighter WebP previews for quick viewing. Routes marked 84, 301, 25, and 38 meet or pass near Ludowici, with 196 and 144 crossing the northern part of the county and 57 continuing toward the southeast.
The maps then separate the county into clearer layers. The city view reduces the settlement pattern to Ludowici as the single ranked major city, while the water map labels Kirkland Creek, Jones Creek, Doctors Creek, Goose Run Creek and several named lakes and ponds. The elevation map records a range of about 3 to 56 meters with a mean of 19 meters, making the higher northwest and generally lower southern half easier to compare.
Table of Contents
Ludowici anchors the road pattern
The county reference map makes Ludowici the most useful starting point. The city sits slightly south of the county’s center, where several numbered roads converge. Route 84 runs through the Ludowici area from west to east, 301 and 25 provide a strong north-south reference, and 38 appears just east of the city. Farther north, 196 crosses the county and 144 is shown near the upper section. Route 57 continues through the southeastern portion, helping explain the long reach of the county boundary in that direction.
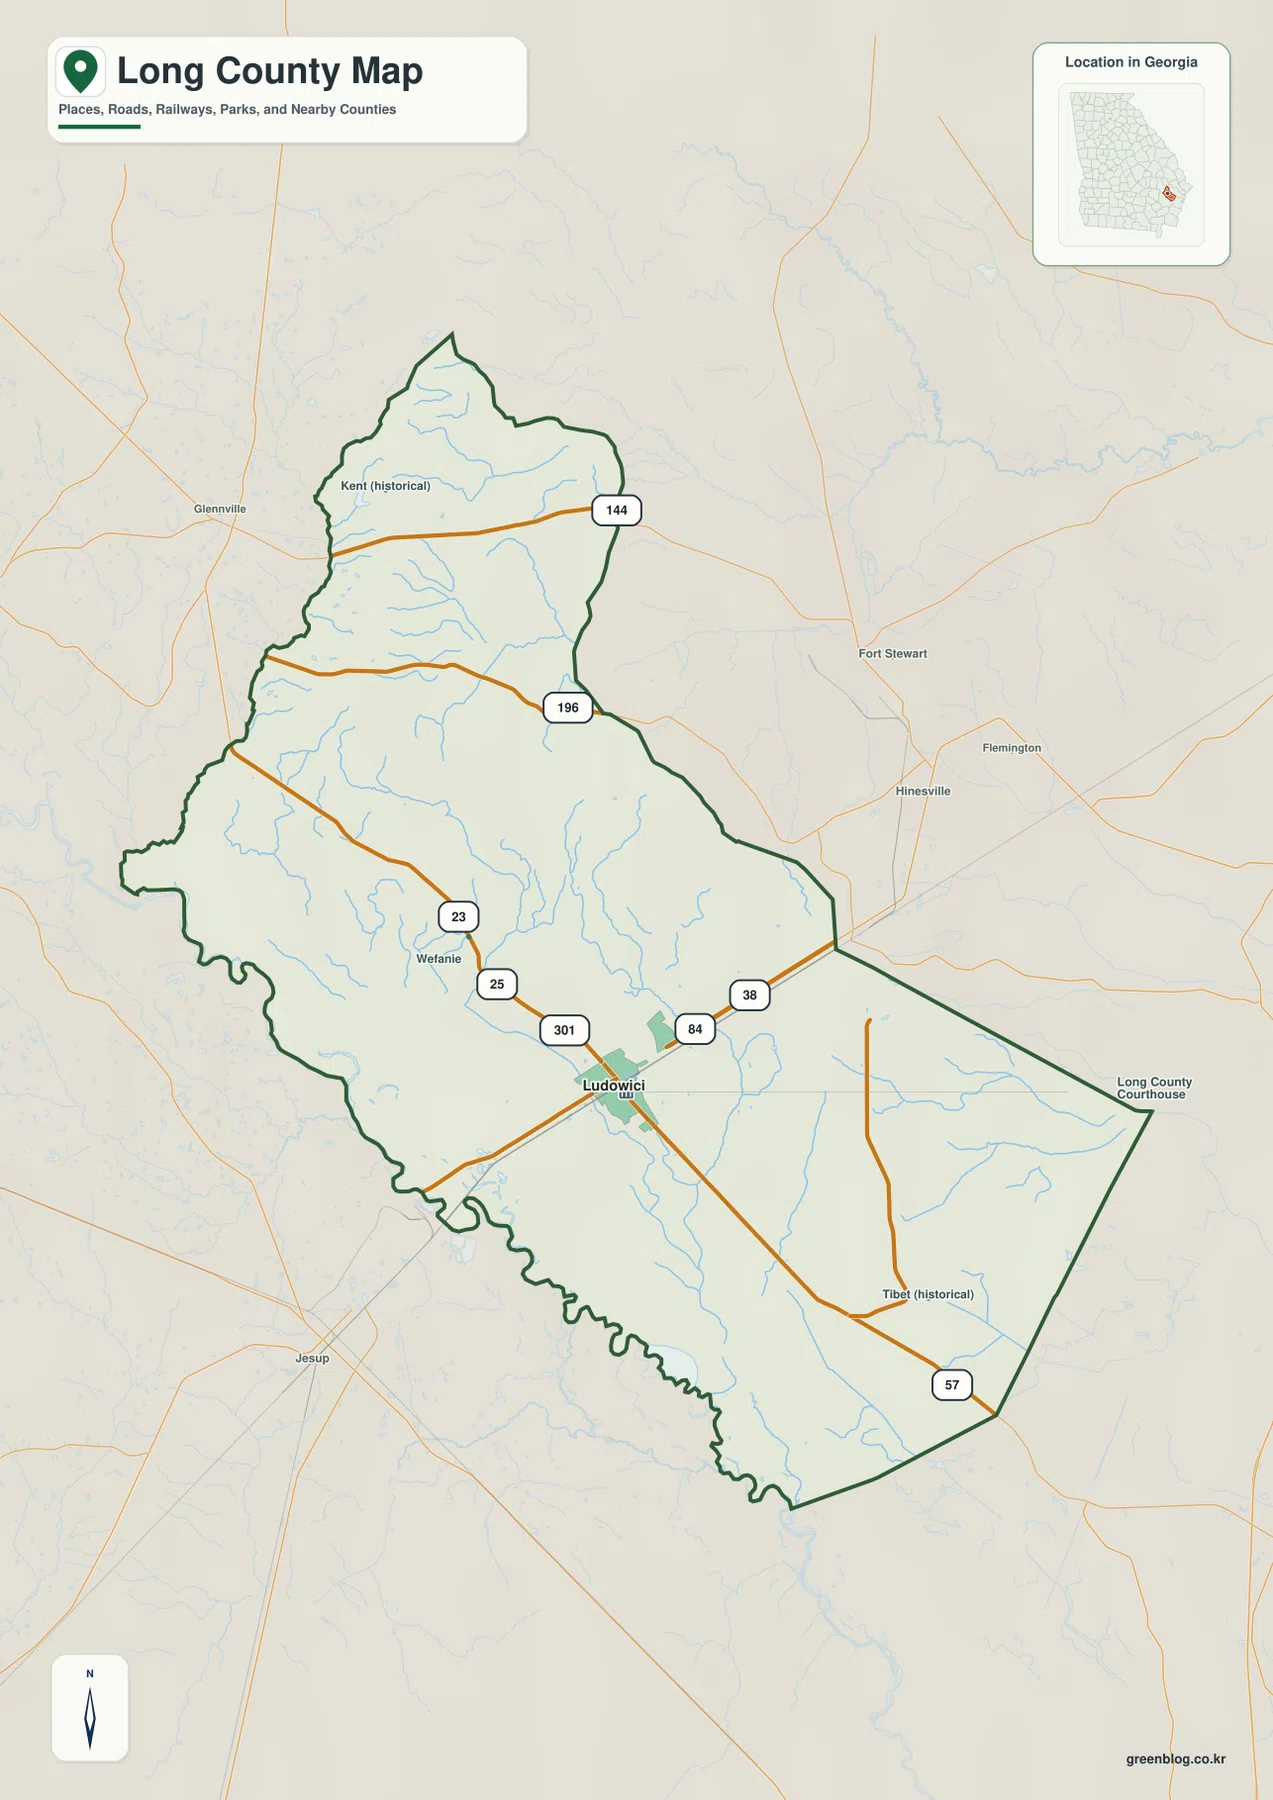
The outline itself is worth noticing. Long County narrows toward the north, broadens through the middle and southwest, and extends into a long southeastern section. The southwestern edge is more irregular than the straighter eastern boundary segments. That shape is easier to understand when the roads and streams are visible at the same time, because the county is not arranged around a simple rectangular grid.
Several labels outside the county line help with direction. Fort Stewart, Hinesville, and Flemington appear to the east, Glennville appears to the west-northwest, and Jesup is shown to the southwest. Inside the boundary, the reference map also labels Wefanie, Kent (historical), and Tibet (historical). These smaller names are useful when reading the county map, but the image is not intended to show every community, local road, parcel, or municipal limit.
A one-city index keeps the settlement map simple
The city-distribution map has a very different purpose from the county road map. Its CITY INDEX contains one ranked major city: Ludowici. A numbered marker points to Ludowici near the middle-lower part of the county, while surrounding county names provide regional orientation. Because the supplied city map has only one ranked city, there are no intercity connector lines or straight-line distance labels to compare.
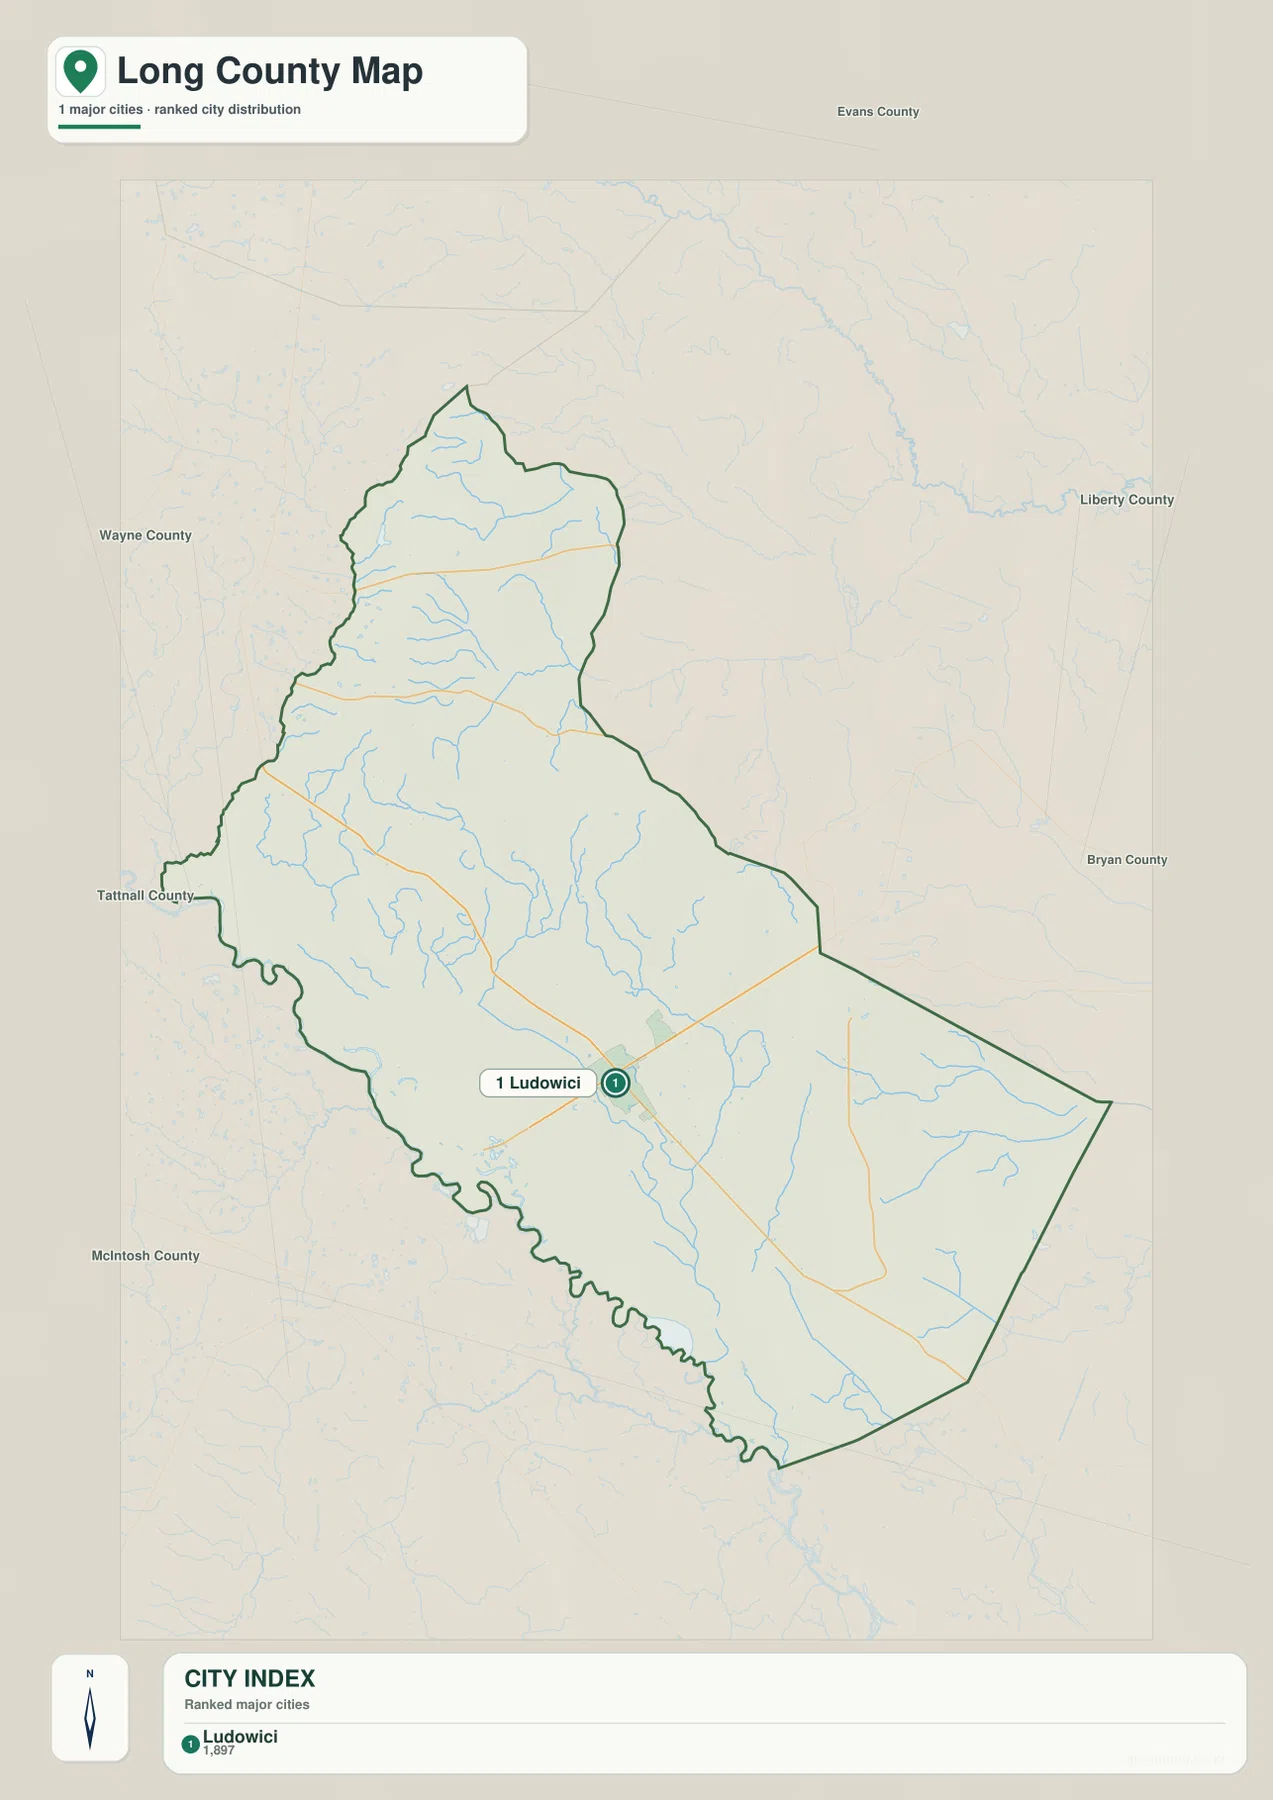
Labels around the outside include Evans County to the north, Liberty County and Bryan County to the east, Wayne County and Tattnall County to the west, and McIntosh County to the southwest. They work as directional references on this map rather than as a substitute for a legal boundary survey. The uncluttered design is especially helpful when the goal is simply to locate the county seat and understand where the county sits within southeastern Georgia.
This also explains why the city map and the county map should not be treated as duplicates. The county map carries more road and place detail, while the city view strips most of that away so the main urban point is obvious. For classroom work, a presentation, or a quick county-seat reference, the simpler map may be the faster choice. For local place names and route context, return to the county map.
Creeks, lakes, and ponds become much clearer south of the county’s midpoint
The water map reveals a network that is easy to miss on the general reference map. Kirkland Creek is labeled across the northern section. Around the middle and southern half, Jones Creek forms a prominent line, while Doctors Creek and Goose Run Creek extend farther south. The map also names several smaller water bodies, including Dunns Lake and Morgan Lake in the southwest, Smiley Pond and Chapman Lake closer to the center-south, and Duck Pond near the southern end.
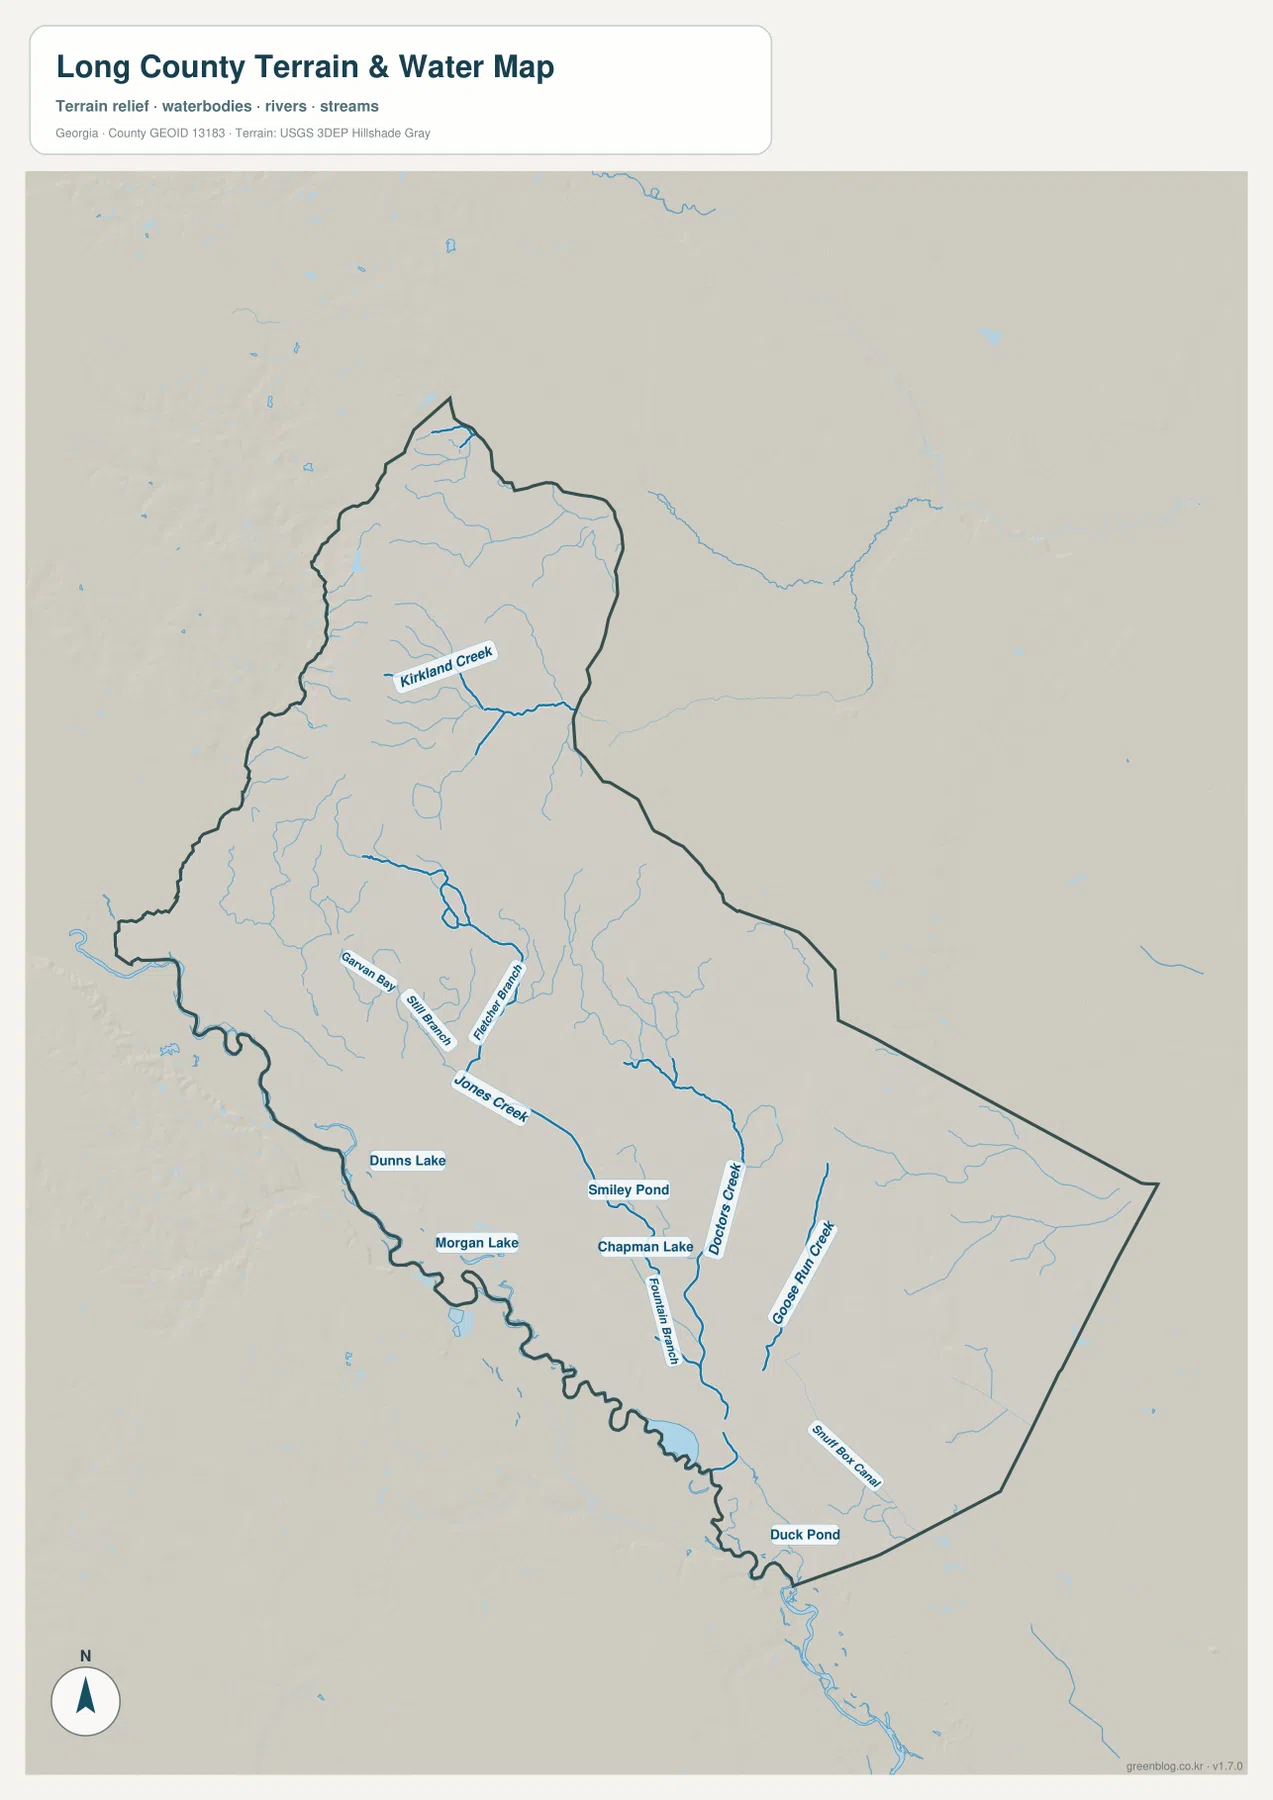
The southern half contains many branching blue lines, making it clear that the county is crossed by numerous smaller streams rather than defined by one single large river on this map. Jones Creek and the waterways around it provide a useful middle reference, while Doctors Creek and Goose Run Creek help separate the south-central and southeastern drainage features. Kirkland Creek stands apart in the north, giving the upper part of the county its own identifiable water feature.
This is a hydrographic reference, not a flood-risk or navigation chart. The blue lines and named water bodies help locate streams and ponds, but they do not tell you how deep the water is, whether a channel is navigable, where a floodplain begins, or where a private property boundary lies. Those questions require the appropriate official flood, survey, parcel, or navigation source.
The elevation range is modest, but the northwest stands higher
The elevation map gives Long County an actual mapped range of about 3 to 56 meters and a mean elevation of 19 meters. The highest colors are concentrated in the northwestern and northern part of the county. Tan and brown areas there transition into yellow and light green through the middle, while the southern and southeastern sections are dominated by lower green tones.
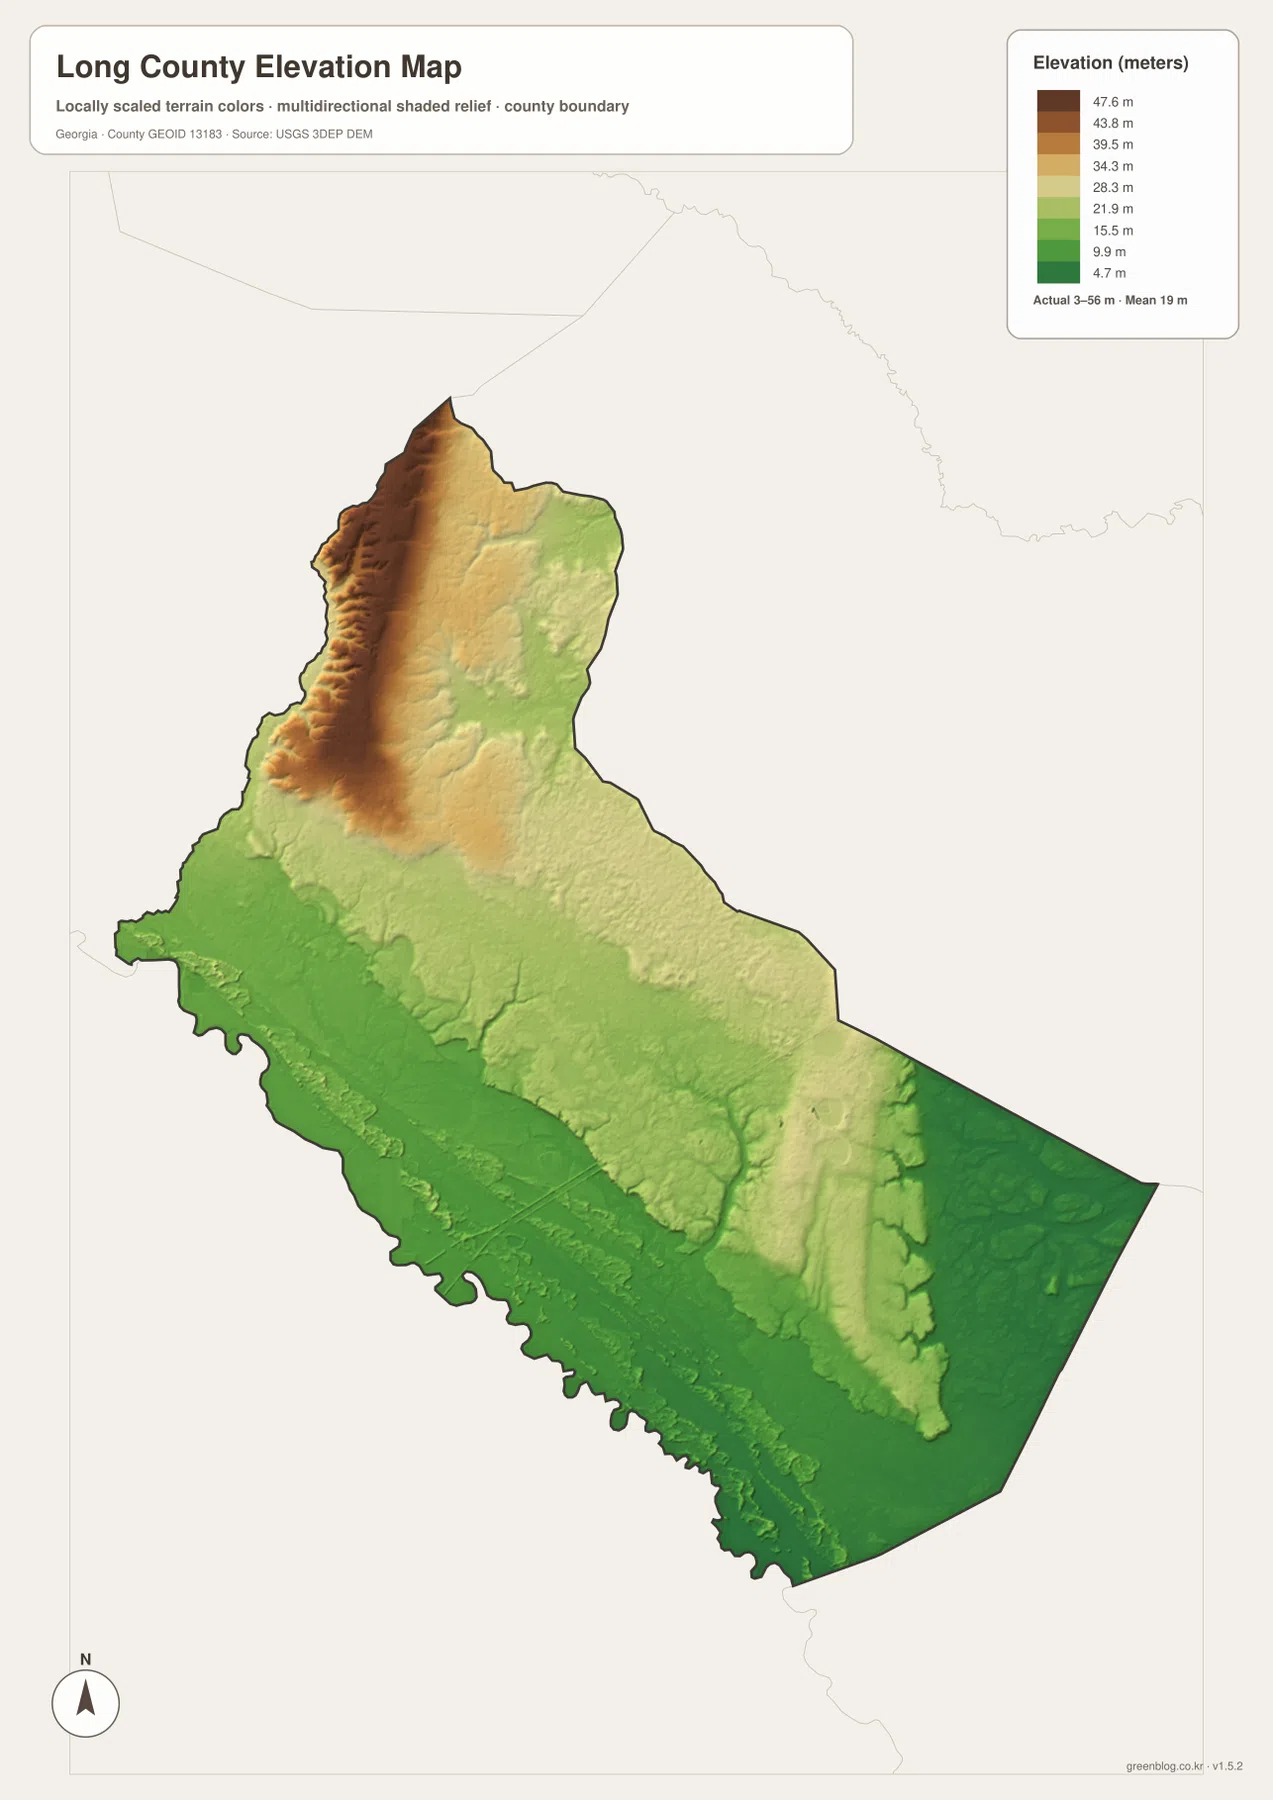
This is not a county of dramatic mountain relief, so the value of the elevation map comes from smaller differences. The northwest rises above much of the rest of the county, the central area sits in an intermediate band, and the broad southern half is generally lower. Looking back at the water map after viewing the elevation surface makes the dense southern stream network easier to place in a terrain context.
The shaded surface is generalized for county-scale viewing. It should not be used as a survey-grade measurement or an engineering elevation source for a particular lot, road project, drainage design, or building site. When exact point elevations matter, use the underlying official elevation data and, where required, a professional survey.
Choose the map by the question you need to answer
Start with the county map when you need the broadest orientation. It combines the Long County boundary, Ludowici, the numbered road network, selected small places, and nearby regional labels. Use the city map when the question is simply where the county’s main ranked city sits. Switch to the water map for named creeks, ponds, and lakes, and use the elevation map when the north-to-south change in ground height matters.
| Map | Best detail to check | Useful for |
|---|---|---|
| County map | Ludowici, numbered roads, boundary, nearby places | General location and route orientation |
| City map | Ludowici as the single ranked major city | County-seat and settlement reference |
| Water map | Named creeks, lakes, ponds, branching streams | Hydrography and natural-feature reference |
| Elevation map | 3–56 m range and higher northwest | County-scale terrain comparison |
Using two maps together is often more useful than forcing every detail onto one image. For example, the county map can establish Ludowici and the route network, then the water map can show which creeks pass through the same general area. The elevation map adds the final terrain layer without covering the roads with extra labels. The previews are optimized for the webpage; the downloadable archive is the better option for printing, offline reference, or larger presentation layouts.
Frequently Asked Questions
Why does the city map show only Ludowici?
The supplied city map ranks one major city in Long County, and that city is Ludowici. With only one ranked city, the map does not need connector lines or straight-line distance labels between multiple cities. Smaller communities and historical place names are better viewed on the county reference map.
Which named waterways are easiest to find on the water map?
Kirkland Creek, Jones Creek, Doctors Creek, and Goose Run Creek are among the clearest named streams. The map also labels Dunns Lake, Morgan Lake, Smiley Pond, Chapman Lake, and Duck Pond. These labels are for location reference and should not be interpreted as flood, depth, or navigation information.
What does the 3–56 meter elevation range mean?
It is the actual range printed on the supplied county elevation map, which also gives a mean of 19 meters. The northwest is generally higher in the map’s color scale, while much of the south and southeast is lower. The surface is designed for county-scale comparison rather than survey-grade point elevations.
What is included in the downloadable ZIP?
The archive contains four high-resolution A3 JPG files: the county map, city map, water map, and elevation map. The WebP images in the article are lighter webpage previews, so use the JPG files when you need the original downloadable map set for printing or offline work.
Map File Information
The ZIP contains four high-resolution A3 JPG maps for Long County: county, city, water, and elevation.
- Included Files: County map, city map, water map, elevation map
- File Type: Four high-resolution A3 JPG files in one ZIP
Related Maps
Sources and references
The following public sources are useful for checking county background and the boundary, water, and elevation data represented by the maps.
- Long County government history page
- U.S. Census Bureau QuickFacts for Long County
- New Georgia Encyclopedia: Long County
- U.S. Census Bureau TIGER/Line Shapefiles
- USGS National Hydrography
- USGS 3D Elevation Program
Green Map creates custom-edited map images using open geographic data sources such as geoBoundaries, Natural Earth, OpenStreetMap, and government open data. These maps are edited visual materials, not raw data files, and are provided for education, documents, presentations, and graphic reference.