Screven County is not simply farm country. Wetlands are the largest 2025 class at 34.40%, while forest covers 25.09% and agriculture 24.76%. Broad wet ground follows the Savannah River side and other drainage corridors, large farm blocks occupy much of the north and south, and Sylvania forms the county’s strongest built center. This Screven County Georgia Land Cover Map is useful for comparing those three rural surfaces with a small-town road network.
The page includes four WebP views for current land cover, vegetation, impervious surface, and the 1985–2025 endpoint comparison. Four original 2480 × 1754 JPG maps are available in one ZIP for county profiles, wetland-and-farm lessons, rural planning context, and presentations.
Table of Contents
Wetlands are the largest class and extend far beyond open river water
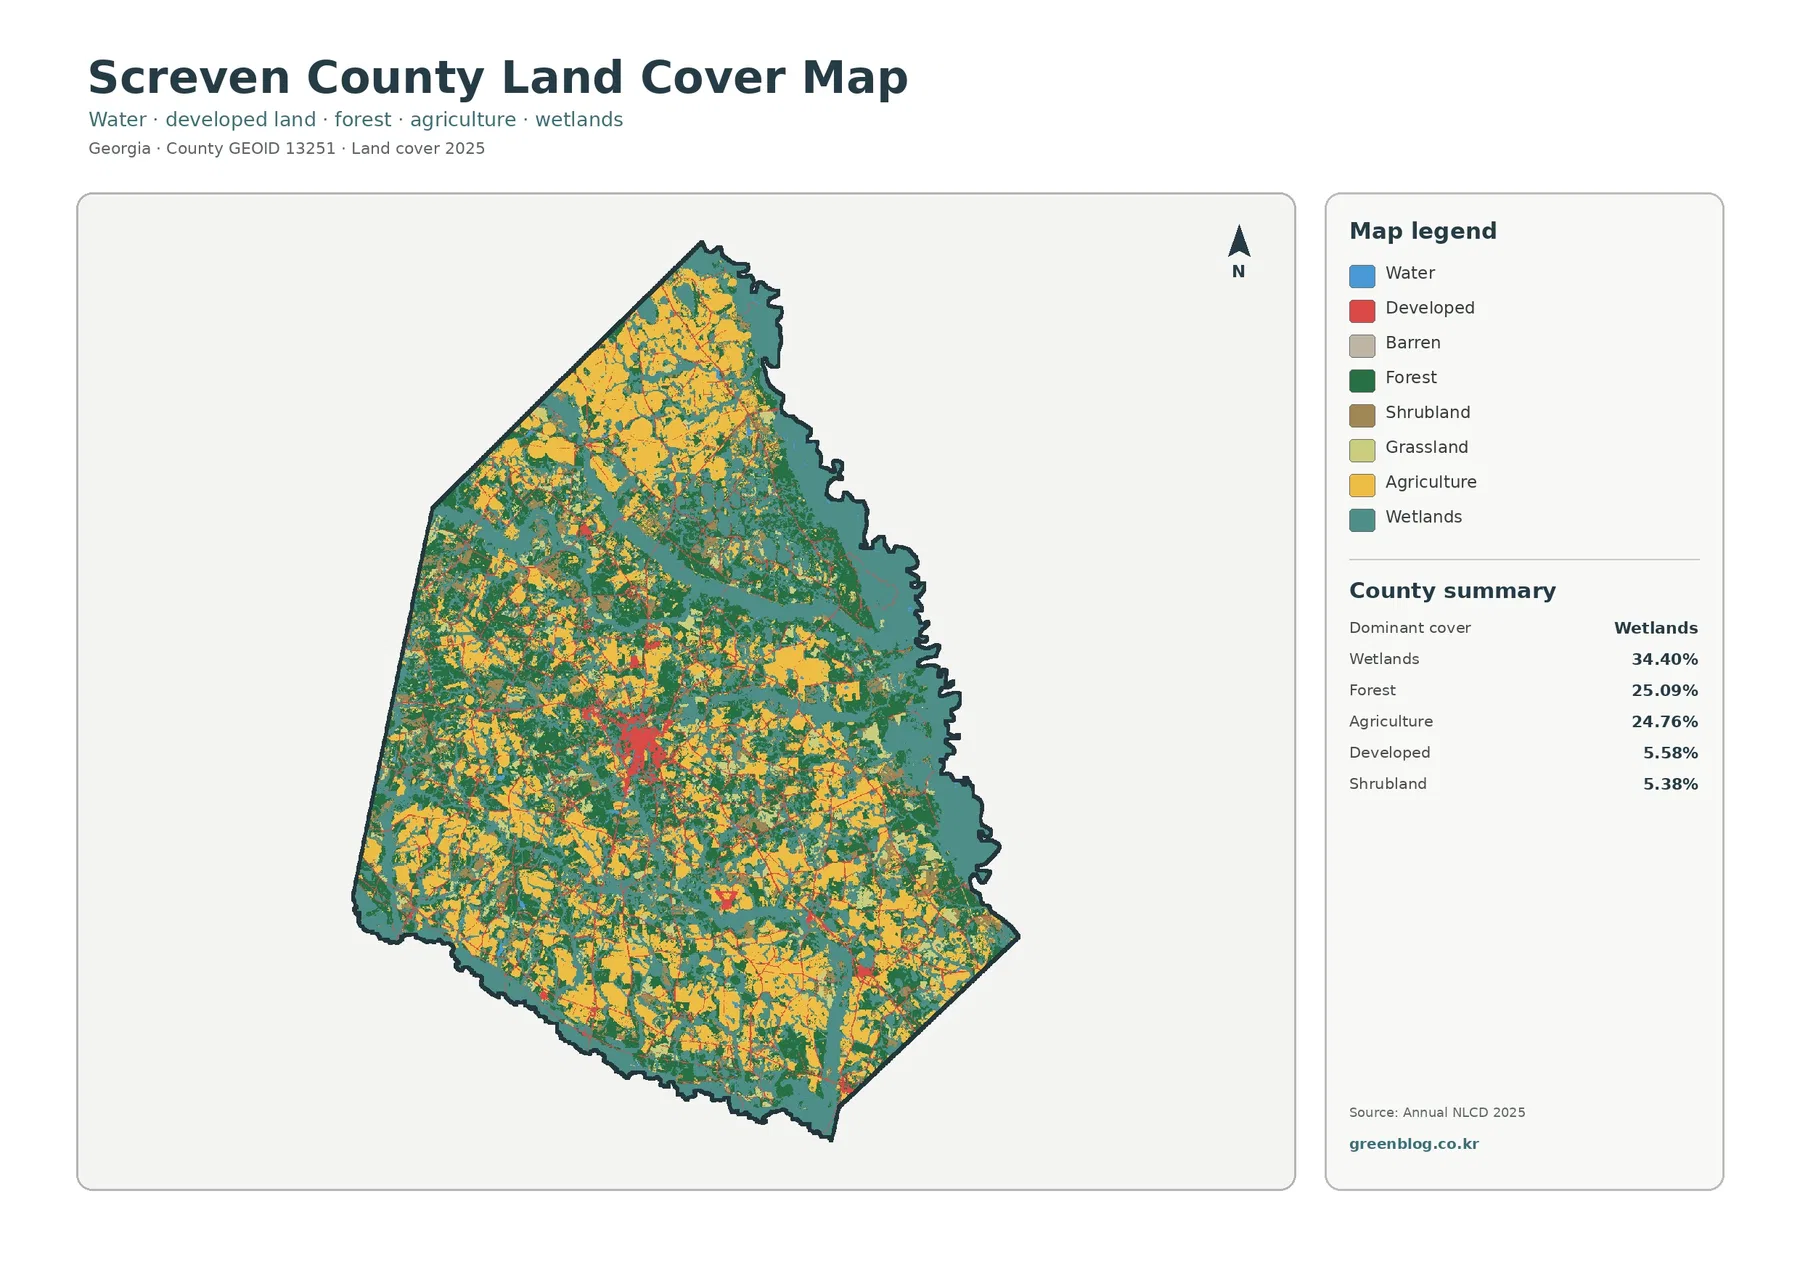
Wetlands cover 34.40%, the largest share in the county. Teal is especially extensive along the eastern boundary and through broad branching corridors in the northeast, center, and southeast. The pattern is large enough that wetlands help define the countywide landscape rather than appearing only as narrow streamside strips.
Screven County’s 2024 joint comprehensive plan notes the county’s historic relationship with the Savannah River and treats water bodies, wetlands, conservation lands, and recreation as important natural-resource areas. The plan also recognizes low-lying coastal-plain areas that can be affected by river and canal flooding. That official context helps explain why wet cover matters so much here.
Open water itself is only 0.83%. A wetland cell can represent saturated soil and vegetation rather than exposed river or pond surface, so the large teal areas should not be called river water. Exact channels, floodplains, and regulatory wetland boundaries require dedicated hydrography and legal data.
Forest and agriculture divide the working rural landscape almost evenly
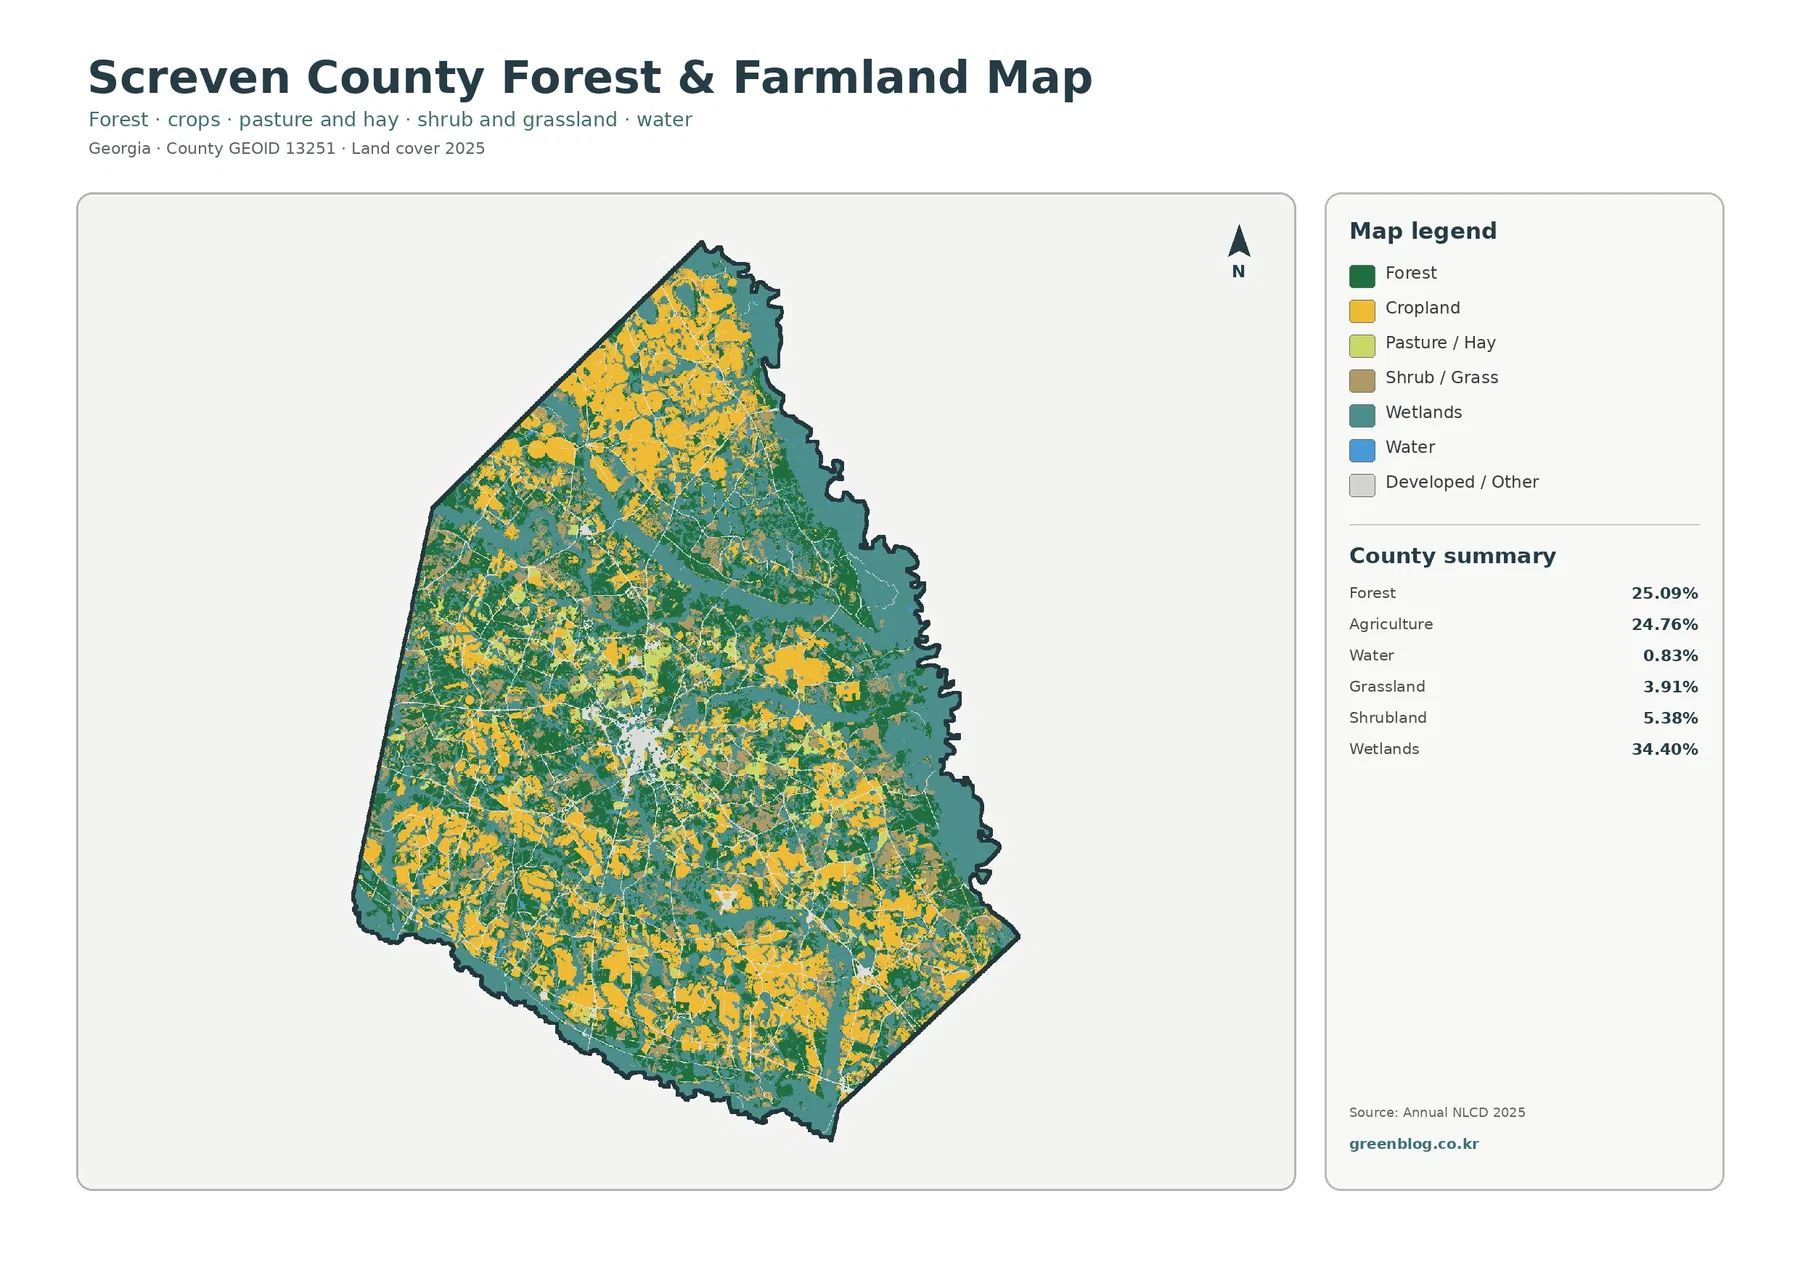
Forest covers 25.09% and agriculture 24.76%, a difference of only 0.33 percentage points. Farm blocks are particularly broad in the north and occur repeatedly across the south and southeast. Forest is more continuous through western and central sections and often occupies the ground between farms and wetland corridors.
The 2024 comprehensive plan describes agriculture and forestry as a defining rural character area and calls viable agriculture the backbone of a network of working lands, open space, and natural areas. It also recognizes commercial timber and pulpwood uses in the same long-term land-use setting. That planning language fits a map where farms and forest have nearly equal shares.
UGA Extension’s Screven office provides soil and water testing, feed and plant-tissue services, and production-agriculture support. Its 2026 row-crop schedule includes cotton and peanut meetings. Those local programs confirm active farming without allowing any yellow raster cell to be labeled as a specific cotton, peanut, or other crop field.
Sylvania is the strongest built center in an otherwise low-impervious county
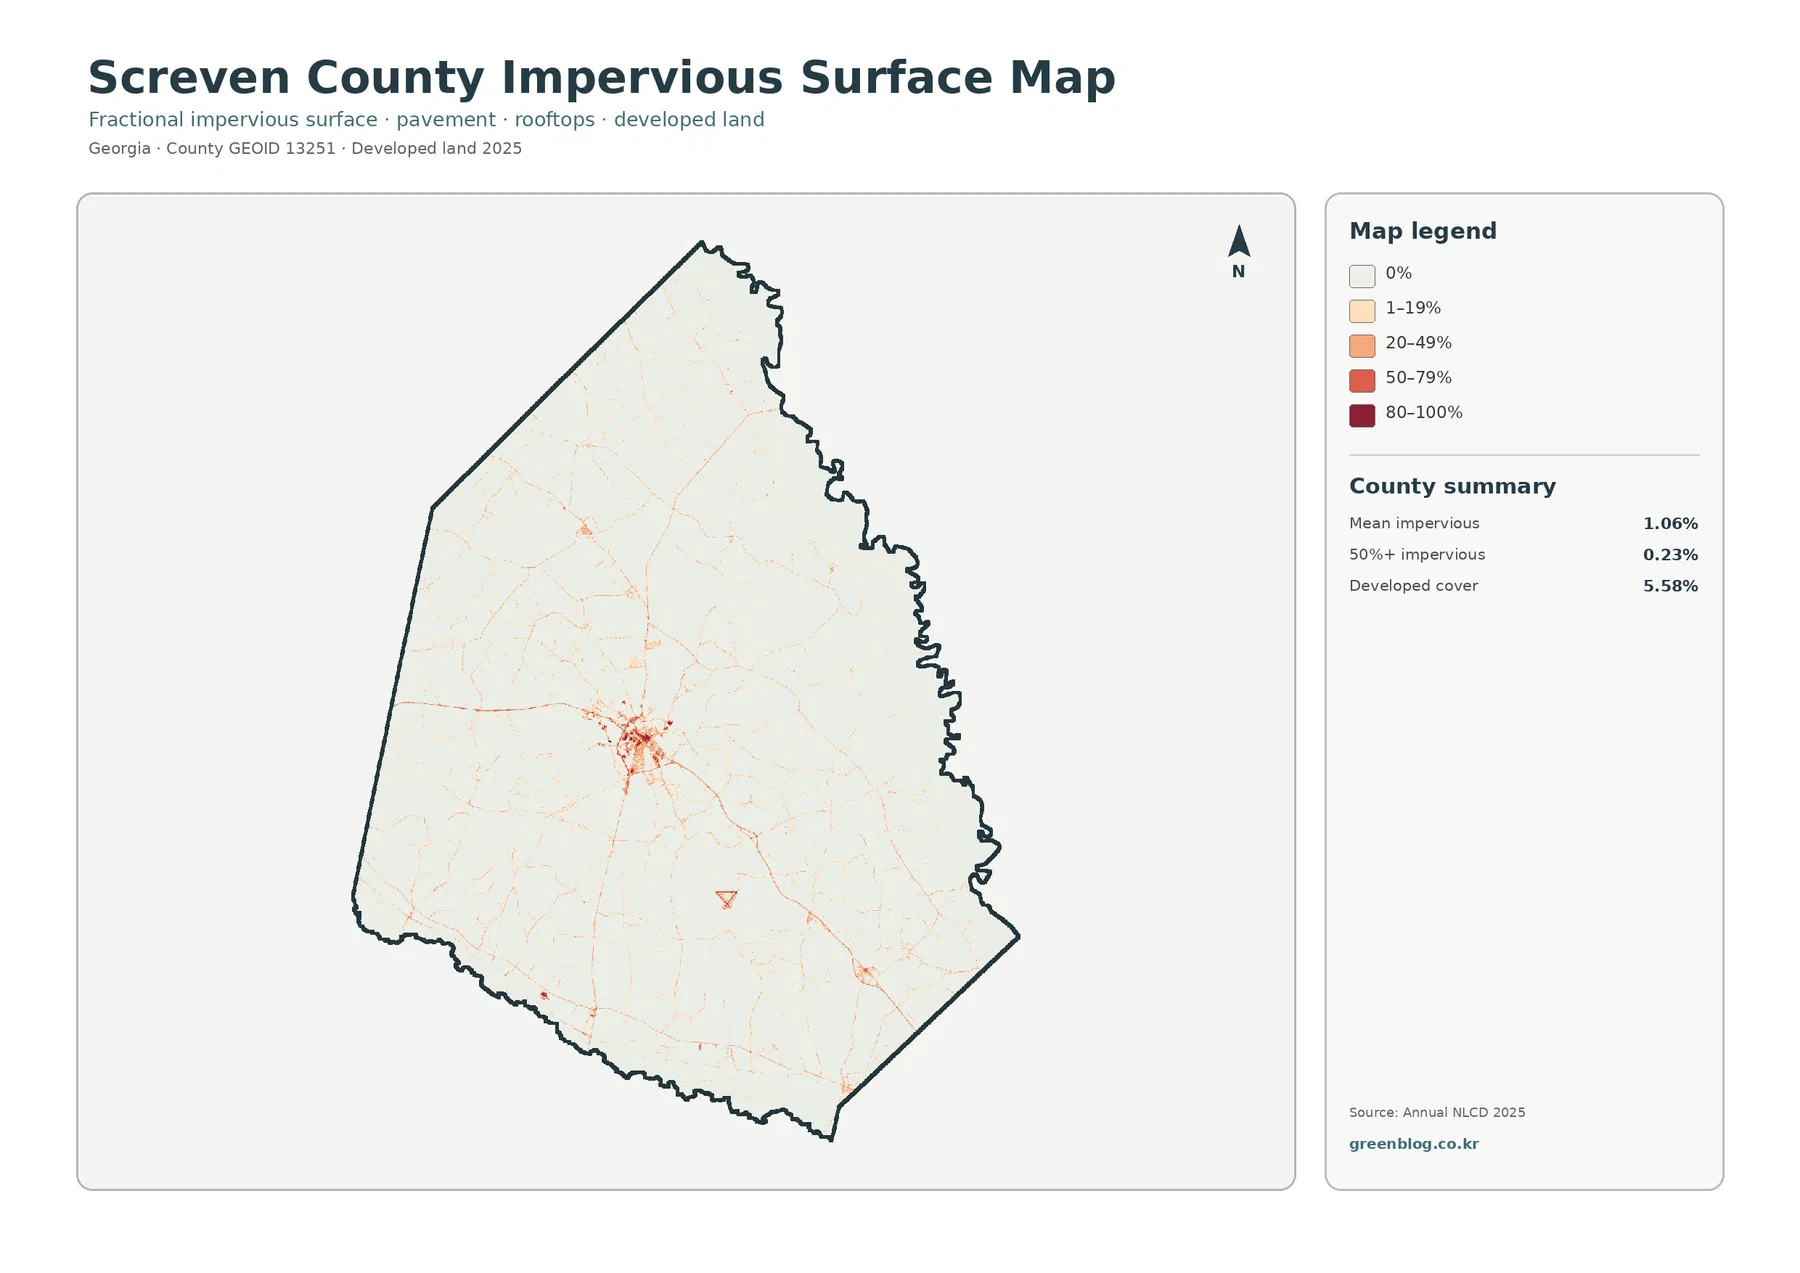
The largest impervious cluster appears near the county’s center. The City of Sylvania identifies itself as the Screven County seat, giving this compact hard-surface concentration a reliable local reference. Higher-value cells are tightly grouped in the town, while low impervious lines extend along roads into the surrounding countryside.
The county plan lists US Route 301 as a north-south arterial that bypasses Sylvania and State Road 21 as an east-west route that also bypasses Sylvania and Newington. Those roads help explain the importance of Sylvania’s transportation setting, but the raster does not label individual road lines. Exact route alignments belong in Census or transportation data.
Mean impervious cover is 1.06%, and only 0.23% of Screven County reaches 50% impervious surface or higher. Developed land covers 5.58%, a broader class that can include lawns, trees, yards, and exposed soil. The difference shows how little of this large rural county is actually covered by dense pavement or rooftops.
Small municipalities remain isolated within farms, forest, and wetlands
The 2024 joint plan covers Screven County with Sylvania, Newington, Oliver, Rocky Ford, and Hiltonia. Outside the main Sylvania cluster, the maps contain smaller built points separated by long stretches of rural cover. This is a dispersed settlement pattern rather than one continuous suburban footprint.
The images do not print municipal boundaries, so small red or impervious patches should not be assigned to a town pixel by pixel. Census or local GIS is needed for exact limits; the reliable observation is that Sylvania is the largest built center.
Shrubland and grassland add another layer to the open rural landscape
Shrubland accounts for 5.38% and grassland 3.91%. These classes appear among fields, forest edges, and wet areas throughout the county. They matter because not every open-looking parcel is cropland, especially in places where agriculture, early-successional vegetation, pasture-like cover, and woods meet within short distances.
The vegetation map helps separate these surfaces instead of treating all open land as agriculture. It still cannot establish pasture ownership or legal land use.
Agricultural loss is the largest printed category in the 1985–2025 comparison
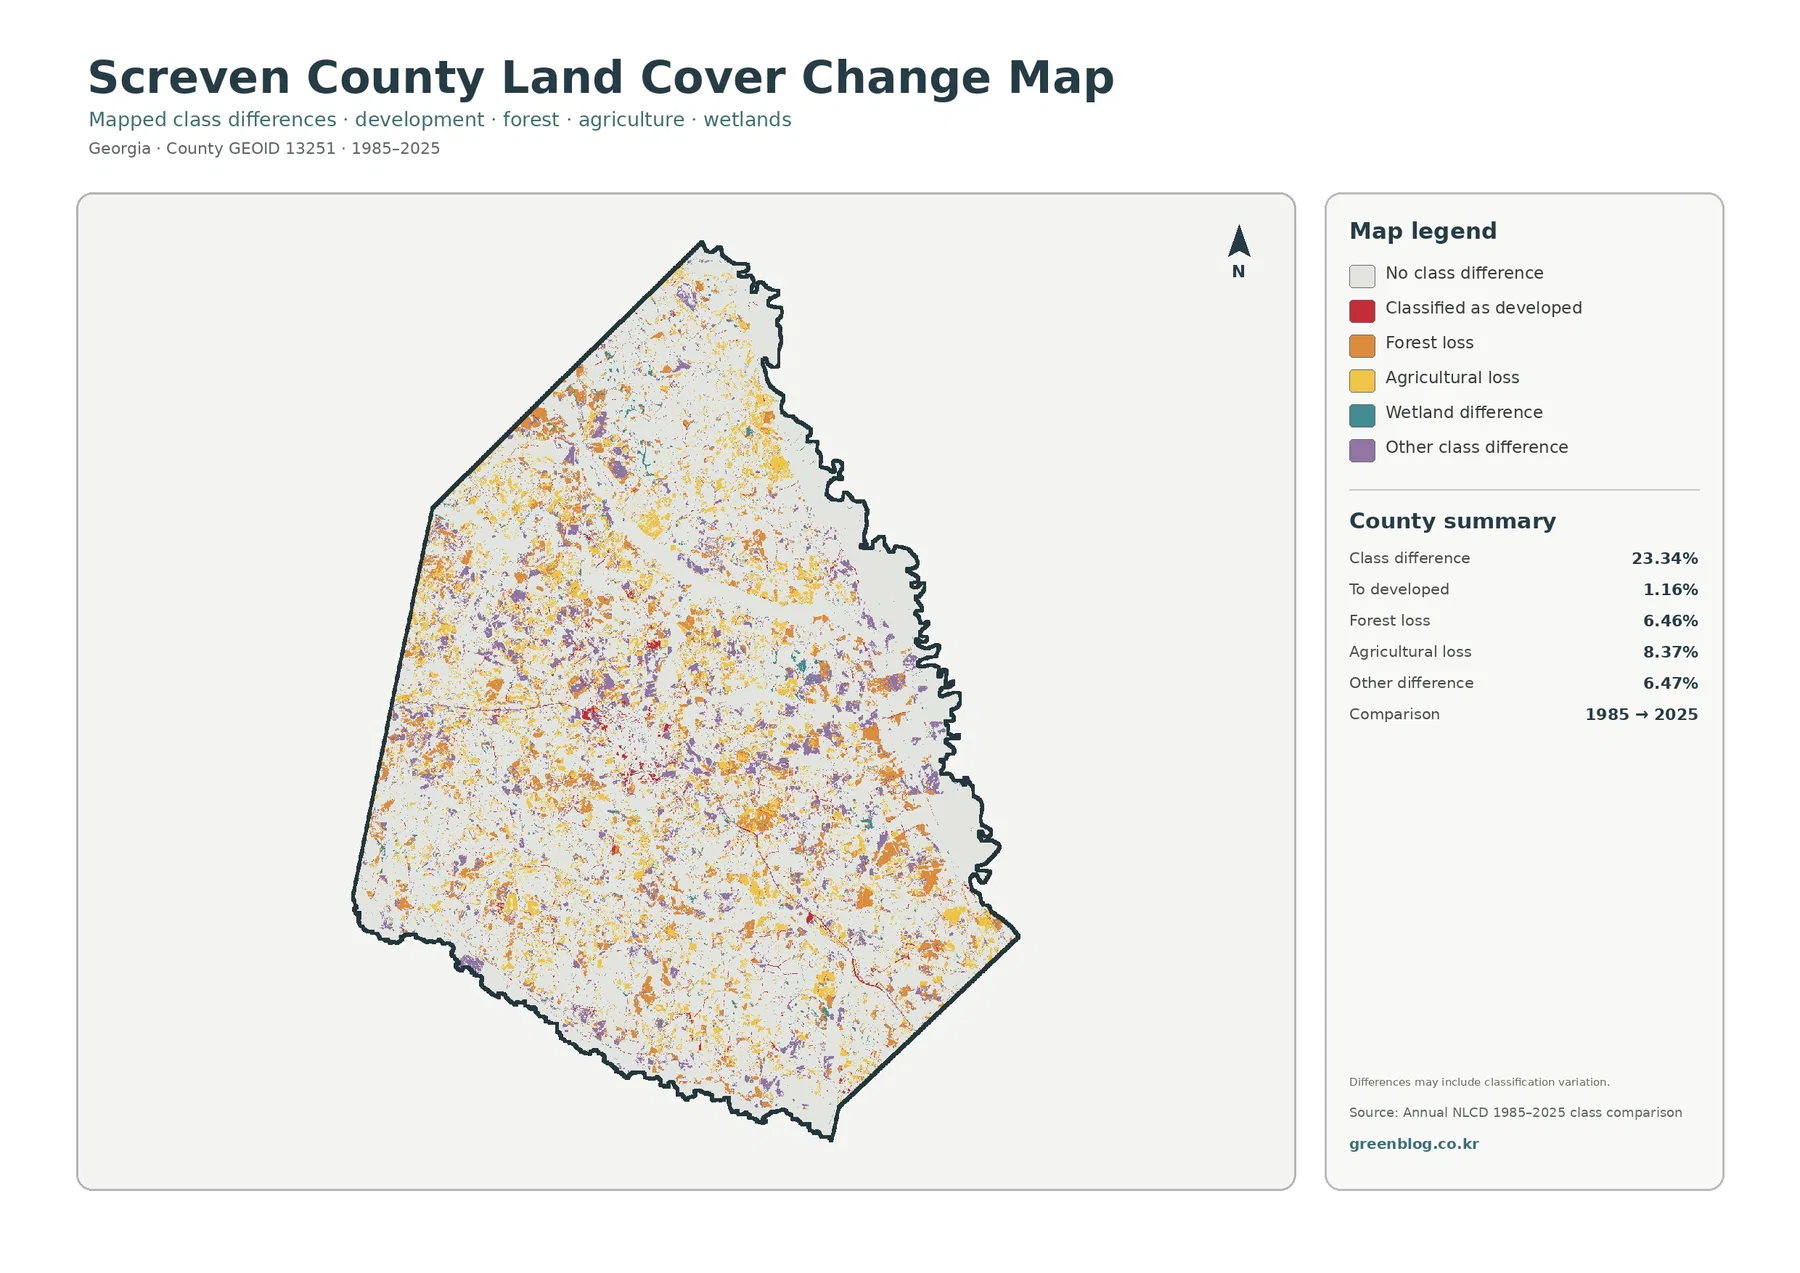
The total endpoint class difference is 23.34%. This number counts cells assigned different land-cover categories in 1985 and 2025. It is not an urbanization rate, a damage rate, or a value that can simply be subtracted from the current wetland, forest, or agricultural shares.
The printed summary lists 8.37% agricultural loss, 6.47% other difference, 6.46% forest loss, and 1.16% classified to developed. Agricultural-loss yellow and forest-loss orange are broadly scattered across the county, while developed-change red is more concentrated around Sylvania and road-oriented settlement areas.
Wetland difference appears in the legend without a separately printed percentage. The missing rate should not be reconstructed by subtraction and presented as official. Classification variation may also contribute to some patches, so intermediate imagery and local farming, forestry, or development records are needed before assigning a cause.
Thirty-meter land cover is not a farm, wetland, or zoning survey
Annual NLCD assigns one predominant class to each 30-meter cell, so field edges, wet ground, roads, buildings, and mixed rural properties can look simplified.
Yellow does not define a farm parcel or crop, teal is not a regulatory wetland boundary, and green does not establish forest ownership. Red developed cover also does not show Sylvania zoning or municipal limits. Property, permitting, floodplain, wetland-jurisdiction, and legal land-use questions require current local, state, or federal records.
Choosing the four JPG maps for Screven County
Start with the 2025 countywide map when the goal is to show the wetland majority, nearly equal forest and agricultural shares, and Sylvania together. The vegetation view is better for farm-versus-forest comparisons and the smaller shrub and grass classes. Choose the impervious map for Sylvania and road-oriented hard surfaces, and reserve the endpoint map for a separate 1985–2025 change discussion.
Each JPG measures 2480 × 1754 pixels and suits reports, lessons, and presentations. Test a proof before large-format printing because the files are not marked as A3 high-resolution assets.
Frequently Asked Questions
What is the largest land-cover class in Screven County?
Wetlands are the largest class in the supplied 2025 summary at 34.40%. Forest follows at 25.09% and agriculture at 24.76%, so all three occupy major parts of the county.
Why is developed land 5.58% while mean impervious cover is only 1.06%?
Developed classes can include lawns, trees, yards, and exposed ground around roads and buildings. The impervious layer measures harder surfaces such as roofs, pavement, and parking areas.
Does the 23.34% endpoint difference measure farm loss or wetland loss?
No. It counts every cell with a different class label in 1985 and 2025. The summary separately lists 8.37% agricultural loss, 6.46% forest loss, 1.16% classified to developed, and 6.47% other difference.
Sources and Reference Data
- MRLC Annual NLCD Data – official access to annual land-cover and comparison products
- USGS Annual NLCD Land Cover Classification – definitions for wetlands, forest, agriculture, developed land, and related classes
- U.S. Census Bureau TIGER/Line Shapefiles – authoritative county, place, and transportation layers for comparison
- Georgia DCA – Screven County Joint Comprehensive Plan – official 2024 context for Sylvania, agriculture and forestry, transportation, and natural resources
- City of Sylvania – About Sylvania – official county-seat and US 301/Savannah River Parkway context
- UGA Extension – Screven County Agriculture & Natural Resources – local soil, water, testing, and production-agriculture resources
Map File Information
The ZIP contains four original JPG maps for comparing Screven County's 34.40% wetlands, 25.09% forest, 24.76% agriculture, Sylvania development, impervious surfaces, and 1985–2025 class differences.
- Included Files: 4 original JPG land cover map files shown in this article
- File Type: JPG files in a ZIP archive
- Intended Use: Printing, education, presentations, and map-based projects
Related Maps
- Appling County Georgia Land Cover Map
- Atkinson County Georgia Land Cover Map
- Bacon County Georgia Land Cover Map
Green Map creates custom-edited map images using open geographic data sources such as geoBoundaries, Natural Earth, OpenStreetMap, and government open data. These maps are edited visual materials, not raw data files, and are provided for education, documents, presentations, and graphic reference.