Seminole County is overwhelmingly agricultural in its northern and central sections, while the southern edge changes into a lake-and-wetland landscape. Agriculture covers 59.22% of the supplied 2025 classification. Forest accounts for 12.73%, wetlands 10.84%, developed land 8.00%, and open water 4.12%. Donalsonville is the main built center in the north, while Lake Seminole reshapes the southern end. This Seminole County Georgia Land Cover Map makes that farm-town-lake contrast easy to see.
The page includes four WebP views for current land cover, vegetation, impervious surface, and the 1985–2025 endpoint comparison. Four original 2480 × 1754 JPG maps are available in one ZIP for county profiles, agricultural lessons, Lake Seminole context, and presentations.
Table of Contents
Donalsonville is a compact hard-surface center inside a farm-dominated county
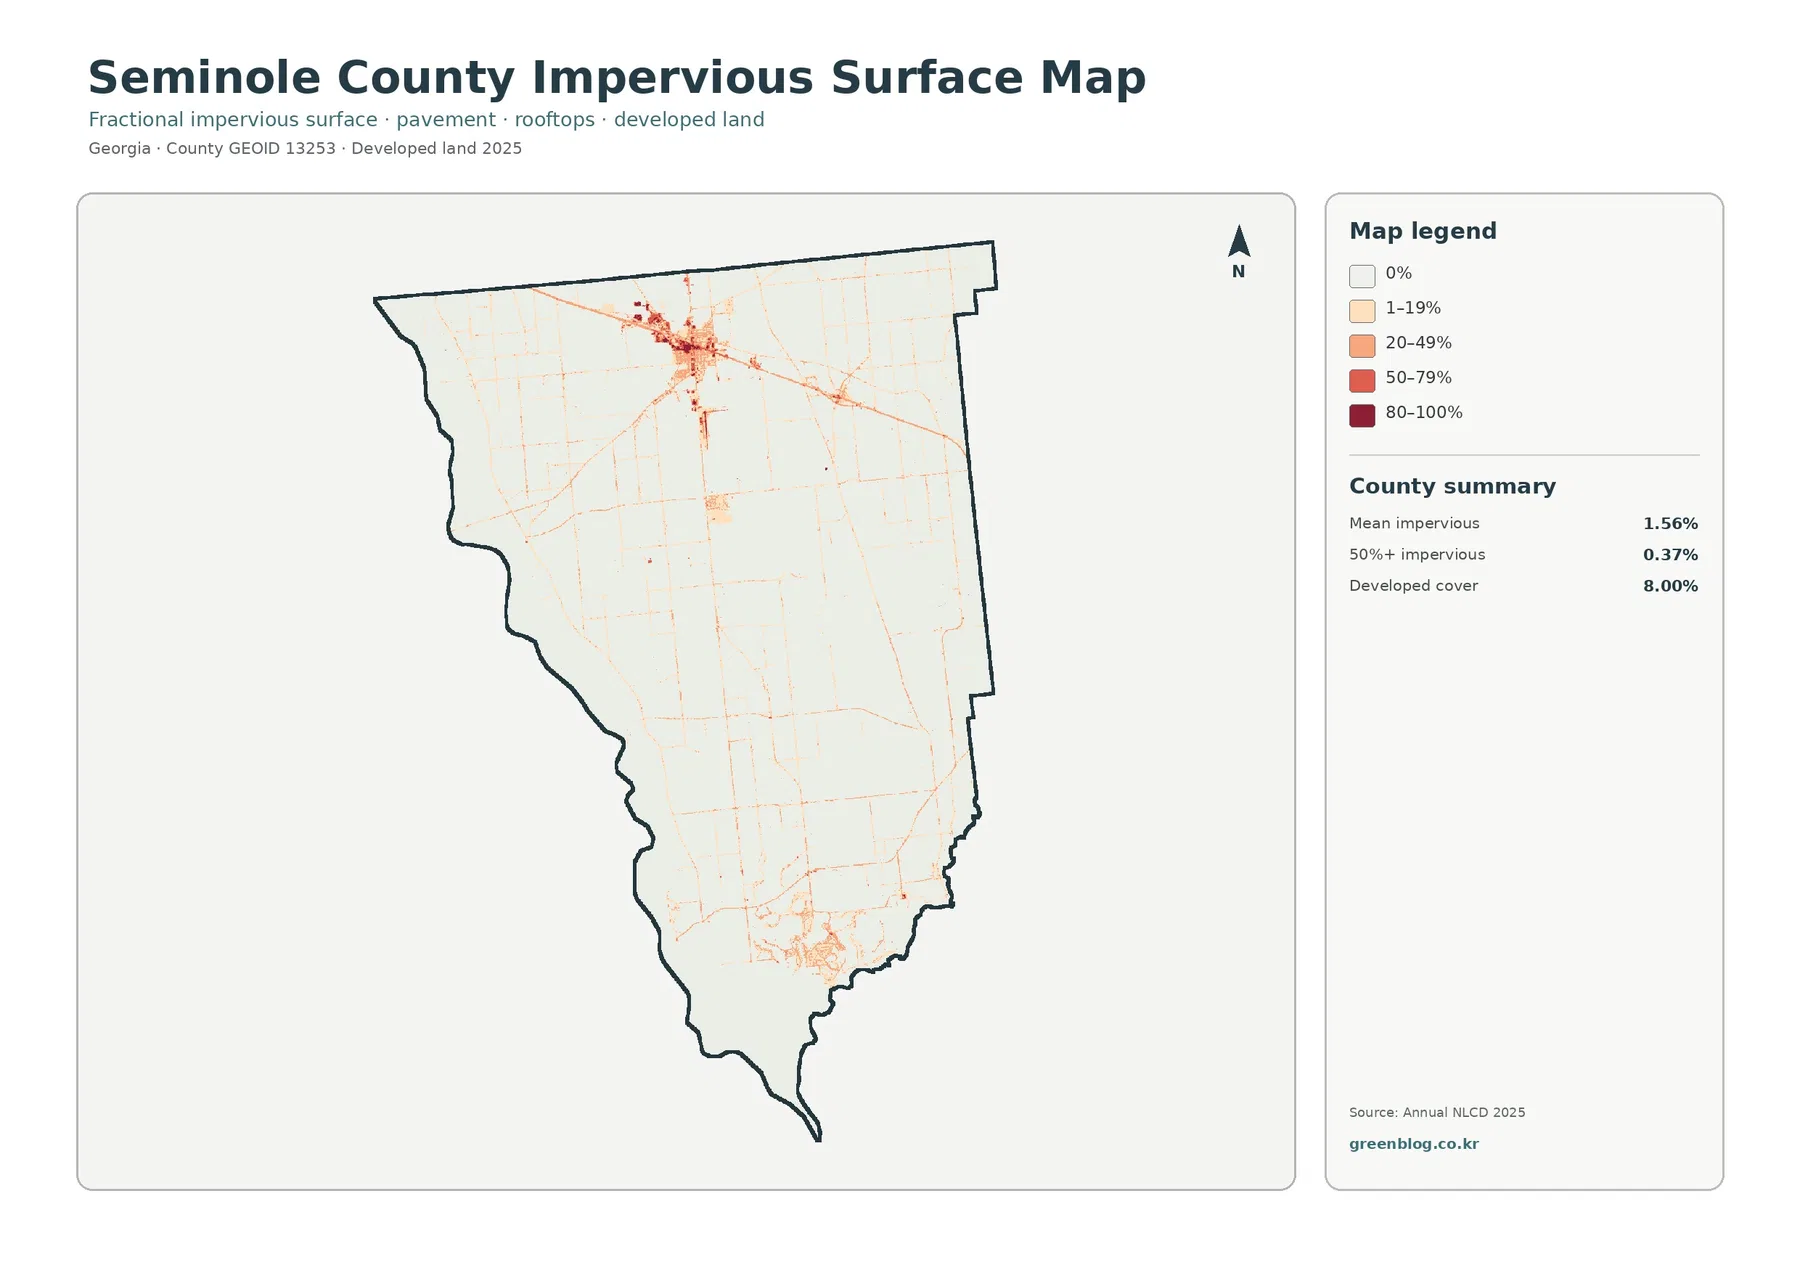
The darkest impervious cluster sits in the north-central county. Seminole County’s 2022 joint comprehensive plan identifies Donalsonville as the county seat, and the city’s official site notes that it took that role when Seminole County was created in 1922. The map places the county’s largest concentration of roofs, streets, and parking surfaces in the same general area.
Hard-surface traces radiate from Donalsonville through the surrounding farm grid, but they remain narrow once the town is left behind. Small developed points also occur farther south and along rural roads. The pattern is one strong town center surrounded by working land rather than a continuous suburban belt.
Mean impervious cover is 1.56%, and only 0.37% of Seminole County reaches 50% impervious surface or higher. Developed land covers 8.00%, a broader class that can include yards, trees, grass, and exposed ground. The impervious product therefore shows how little of the county is actually covered by dense pavement or rooftops.
Agriculture covers 59.22%, far more than any other land-cover class
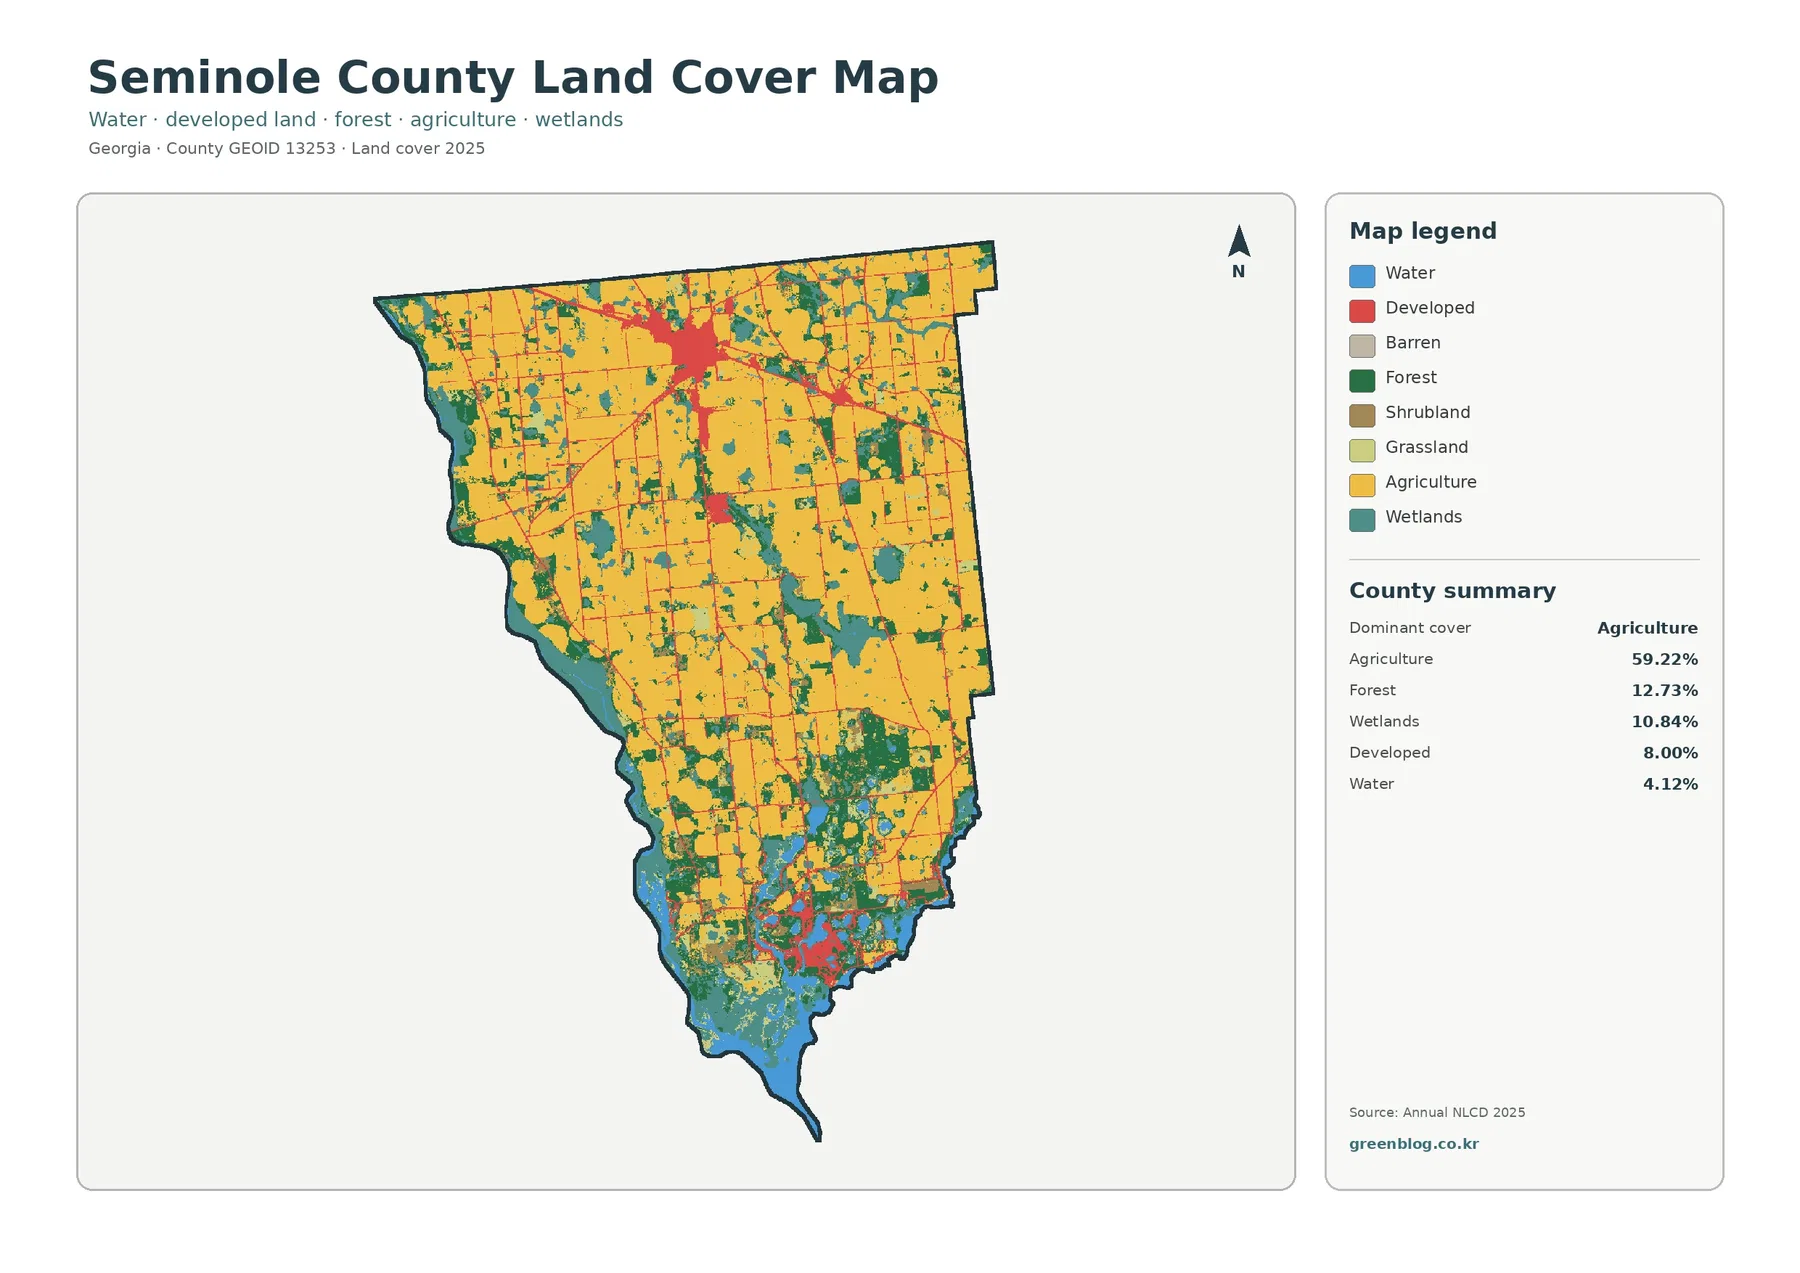
Yellow agricultural cover dominates the north, center, east, and west in large field blocks. Roads divide the fields into a strong grid, and even near smaller wooded or wet areas, farm cover usually returns quickly. At 59.22%, agriculture is not merely the largest category; it is the surface that gives most of the county its visual structure.
UGA Extension describes Seminole County as primarily row-crop farming and identifies peanuts, corn, and cotton as major crops. Its county agriculture material also places Seminole among Georgia’s stronger producers of those commodities. Those verified local facts explain why the agricultural share is so large without allowing a specific yellow cell to be labeled as one crop.
The raster cannot show farm ownership, planting dates, or exact crop rotation. A 30-meter cell may contain a field edge, ditch, road, trees, and a farm structure while displaying one predominant class.
Lake Seminole changes the southern county into a water-and-wetland landscape
The southern end looks very different from the field-dominated north. Broad blue water, teal wetlands, and dark-green forest replace much of the uninterrupted agricultural pattern. The U.S. Army Corps of Engineers describes Lake Seminole as a 37,500-acre reservoir in southwest Georgia where the Chattahoochee and Flint Rivers join before flowing south as the Apalachicola River.
The county’s 2022 plan calls Seminole County the “Gateway to Lake Seminole” and treats the lake as a major recreation asset. The reservoir and its wet margins create a much more fragmented southern landscape than the large field blocks farther north.
Open water covers 4.12%, while wetlands cover 10.84%. Teal should therefore not be described as open lake surface. Wetland cells can include saturated soils and vegetation, and the Corps manages shoreline areas under separate rules. Land-cover colors cannot determine shoreline access, property ownership, or whether future improvements are permitted.
The vegetation view shows how little forest remains compared with cropland
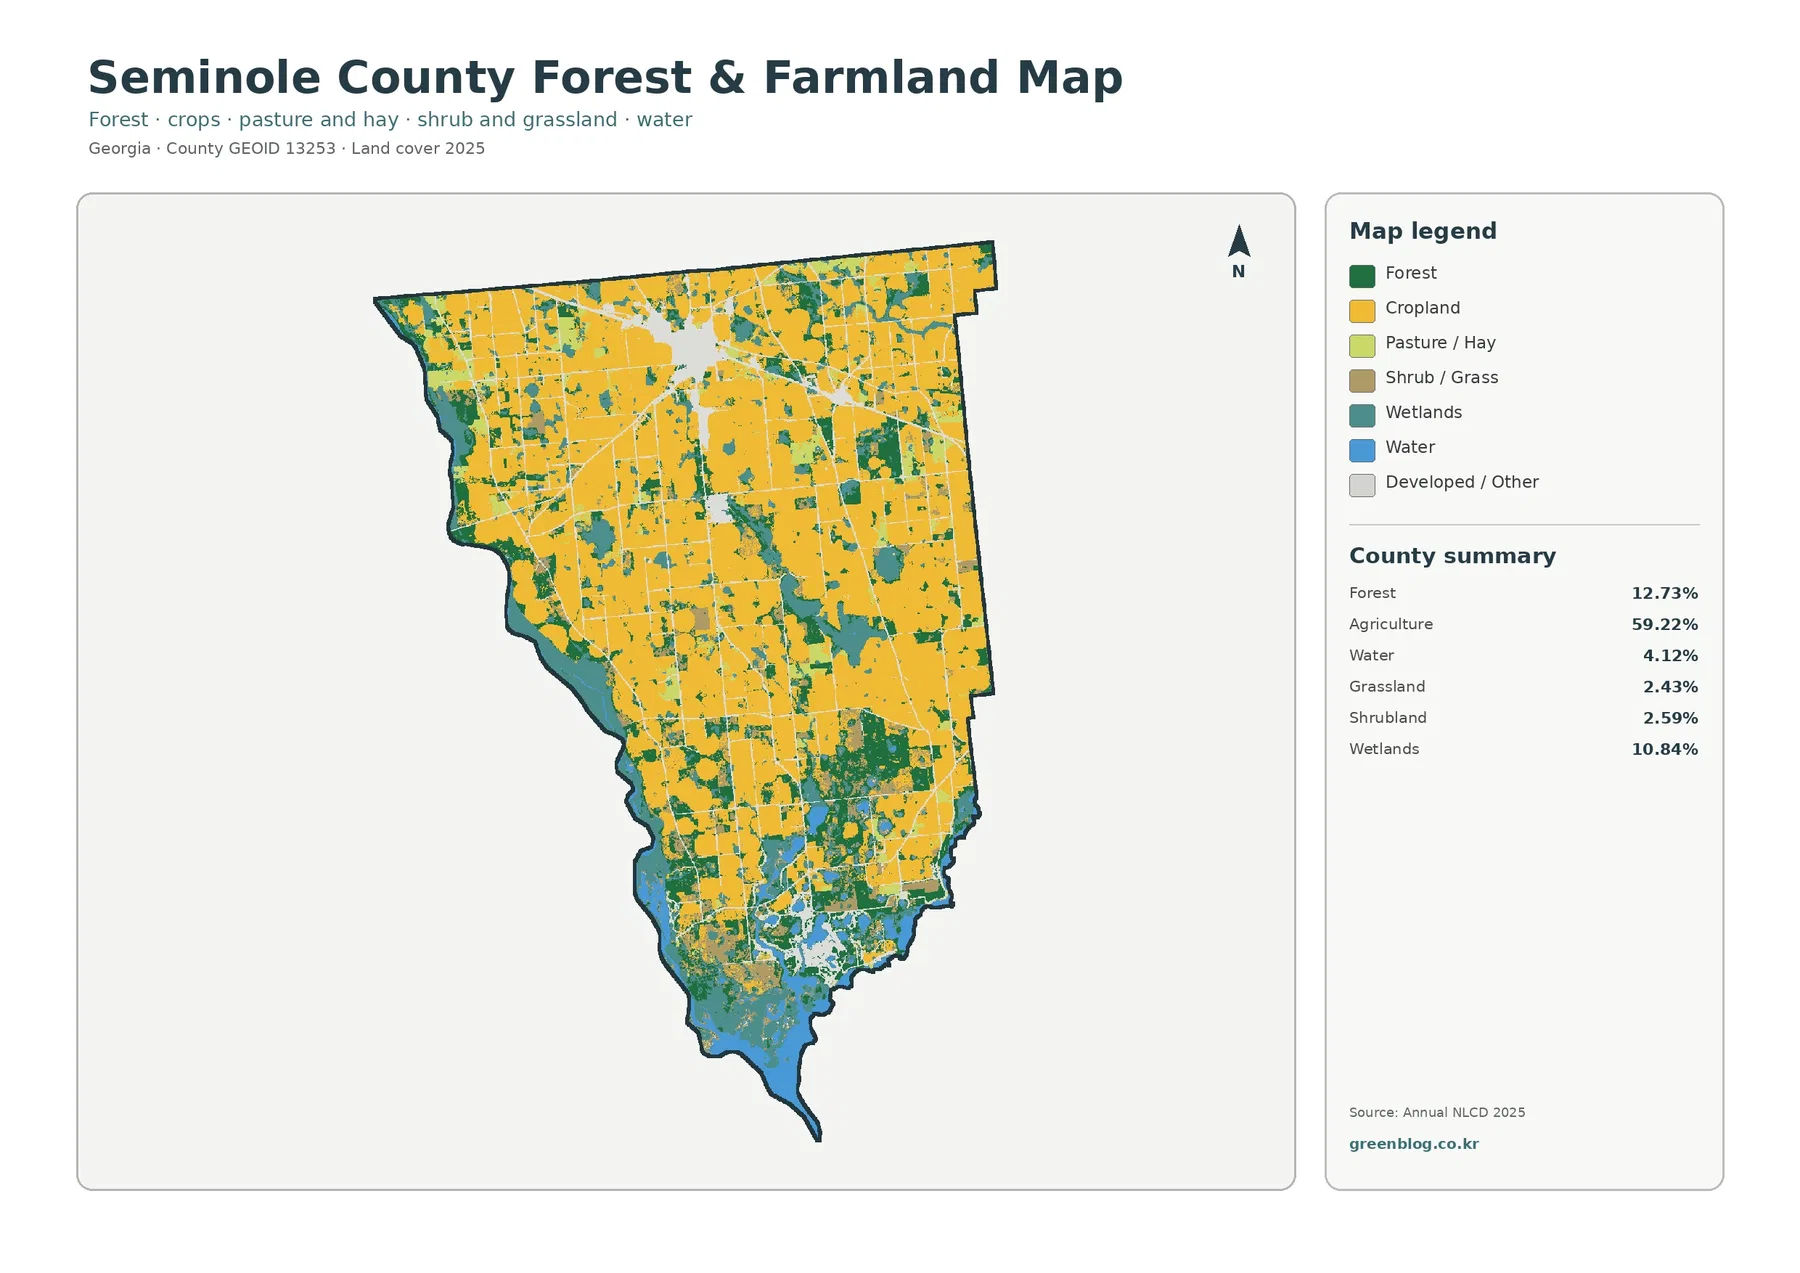
With developed cover muted, the scale difference between agriculture and forest is striking. Forest accounts for 12.73% and appears mainly as smaller blocks, field-edge strips, and larger natural areas toward the south. It rarely forms the broad county-spanning masses seen in heavily wooded Georgia counties.
Grassland covers 2.43% and shrubland 2.59%. These classes appear in small pieces between cropland, wet areas, and woods. They should not be merged casually with agriculture, because open grass or shrub cover does not establish that land is being actively cropped.
Iron City is the county’s other municipality and is included with Donalsonville in the joint comprehensive plan. The plan describes it as a small rural community that relies heavily on farming. The land-cover images do not print municipal boundaries, so small developed patches should not be assigned to Iron City pixel by pixel, but the official context reinforces the county’s dispersed rural settlement pattern.
The 1985–2025 endpoint comparison records more forest loss than agricultural loss
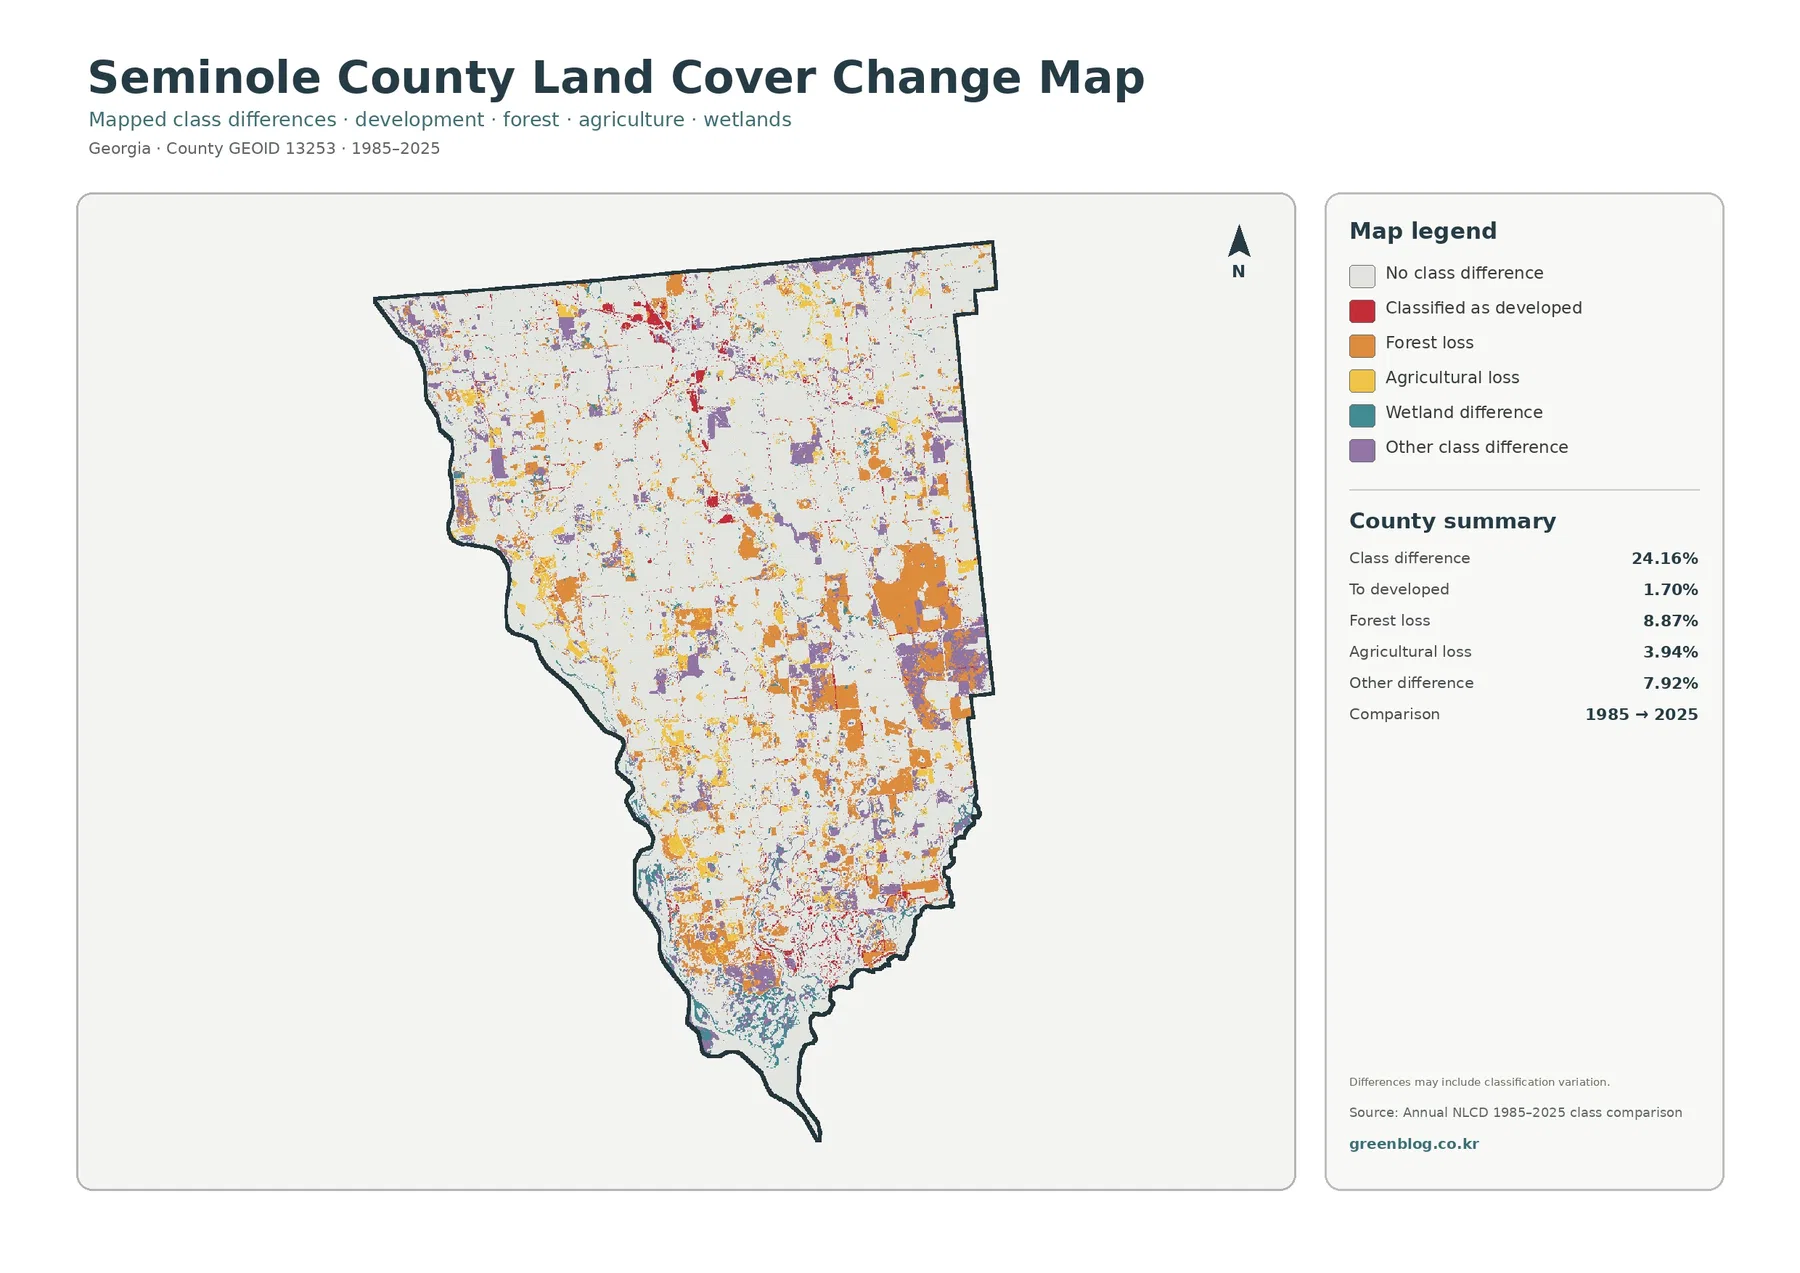
The total endpoint class difference is 24.16%. This number counts cells assigned different classes in 1985 and 2025. It is not an urbanization rate, a damage rate, or a value that can be subtracted from today’s 59.22% agricultural share to reconstruct an earlier county map.
The printed summary lists 8.87% forest loss, 7.92% other difference, 3.94% agricultural loss, and 1.70% classified to developed. Developed-change red is most visible around Donalsonville and some road or southern settlement areas. Forest-loss orange and other-difference purple are more widely scattered through the center, east, and south.
Wetland difference appears in the legend without a separately printed percentage. The missing value should not be reconstructed by subtraction and presented as official. Classification variation may also contribute to some patches, so intermediate imagery and local farming, forestry, or development records are needed before assigning a cause.
Land cover does not replace crop, parcel, zoning, or shoreline records
Annual NLCD classifies the predominant surface in each 30-meter cell. Yellow does not identify a crop or farm parcel, green does not establish forest ownership, teal is not a regulatory wetland boundary, and red does not define Donalsonville or Iron City zoning.
The same caution applies around Lake Seminole. Blue water shows mapped open water, not legal shoreline rights. Property boundaries, permits, shoreline management, municipal limits, and exact road locations require current county, city, Census, U.S. Army Corps of Engineers, or other official records.
Choosing the four JPG maps for Seminole County
Start with the 2025 countywide map when the goal is to show the dominant farm landscape, Donalsonville, and Lake Seminole together. The vegetation view is better for comparing cropland with the smaller forest, grass, shrub, and wetland classes. Choose the impervious map for the town center and road hard surfaces, and reserve the endpoint map for a separate discussion of 1985–2025 class differences.
Each JPG measures 2480 × 1754 pixels and suits reports, lessons, and presentations. Test a proof before large-format printing because the package does not mark the files as A3 high-resolution assets.
Frequently Asked Questions
What is the dominant land-cover class in Seminole County?
Agriculture is the largest class in the supplied 2025 summary at 59.22%. Forest follows at 12.73%, wetlands at 10.84%, and developed land at 8.00%.
Are all teal areas around Lake Seminole open water?
No. Open water covers 4.12%, while wetlands cover 10.84%. Wetland cells may contain saturated soils and vegetation, so they should be separated from the blue open-water class.
Does the 24.16% endpoint difference measure agricultural decline?
No. It counts every cell with a different class label in 1985 and 2025. The summary separately lists 8.87% forest loss, 3.94% agricultural loss, 1.70% classified to developed, and 7.92% other difference.
Sources and Reference Data
- MRLC Annual NLCD Data – official access to annual land-cover and comparison products
- USGS Annual NLCD Land Cover Classification – definitions for agriculture, forest, wetlands, developed land, and related classes
- U.S. Census Bureau TIGER/Line Shapefiles – authoritative county, place, and transportation layers for comparison
- Georgia DCA – Seminole County, Donalsonville & Iron City Comprehensive Plan – official local context for agriculture, Donalsonville, Iron City, and Lake Seminole
- U.S. Army Corps of Engineers – Lake Seminole – official Lake Seminole, Flint-Chattahoochee river, recreation, and reservoir-management information
- UGA Extension – Seminole County Agriculture & Natural Resources – local row-crop, peanut, corn, cotton, and farm-resource information
Map File Information
The ZIP contains four original JPG maps for comparing Seminole County's 59.22% agriculture, Donalsonville development, Lake Seminole water and wetlands, forest, impervious surfaces, and 1985–2025 class differences.
- Included Files: General land cover, forest and farmland, impervious/developed surface, and land-cover change maps
- File Type: Four original JPG map files bundled in one ZIP archive
- Intended Use: Printing, education, presentations, and map-based projects
Related Maps
- Appling County Georgia Land Cover Map
- Atkinson County Georgia Land Cover Map
- Bacon County Georgia Land Cover Map
Green Map creates custom-edited map images using open geographic data sources such as geoBoundaries, Natural Earth, OpenStreetMap, and government open data. These maps are edited visual materials, not raw data files, and are provided for education, documents, presentations, and graphic reference.