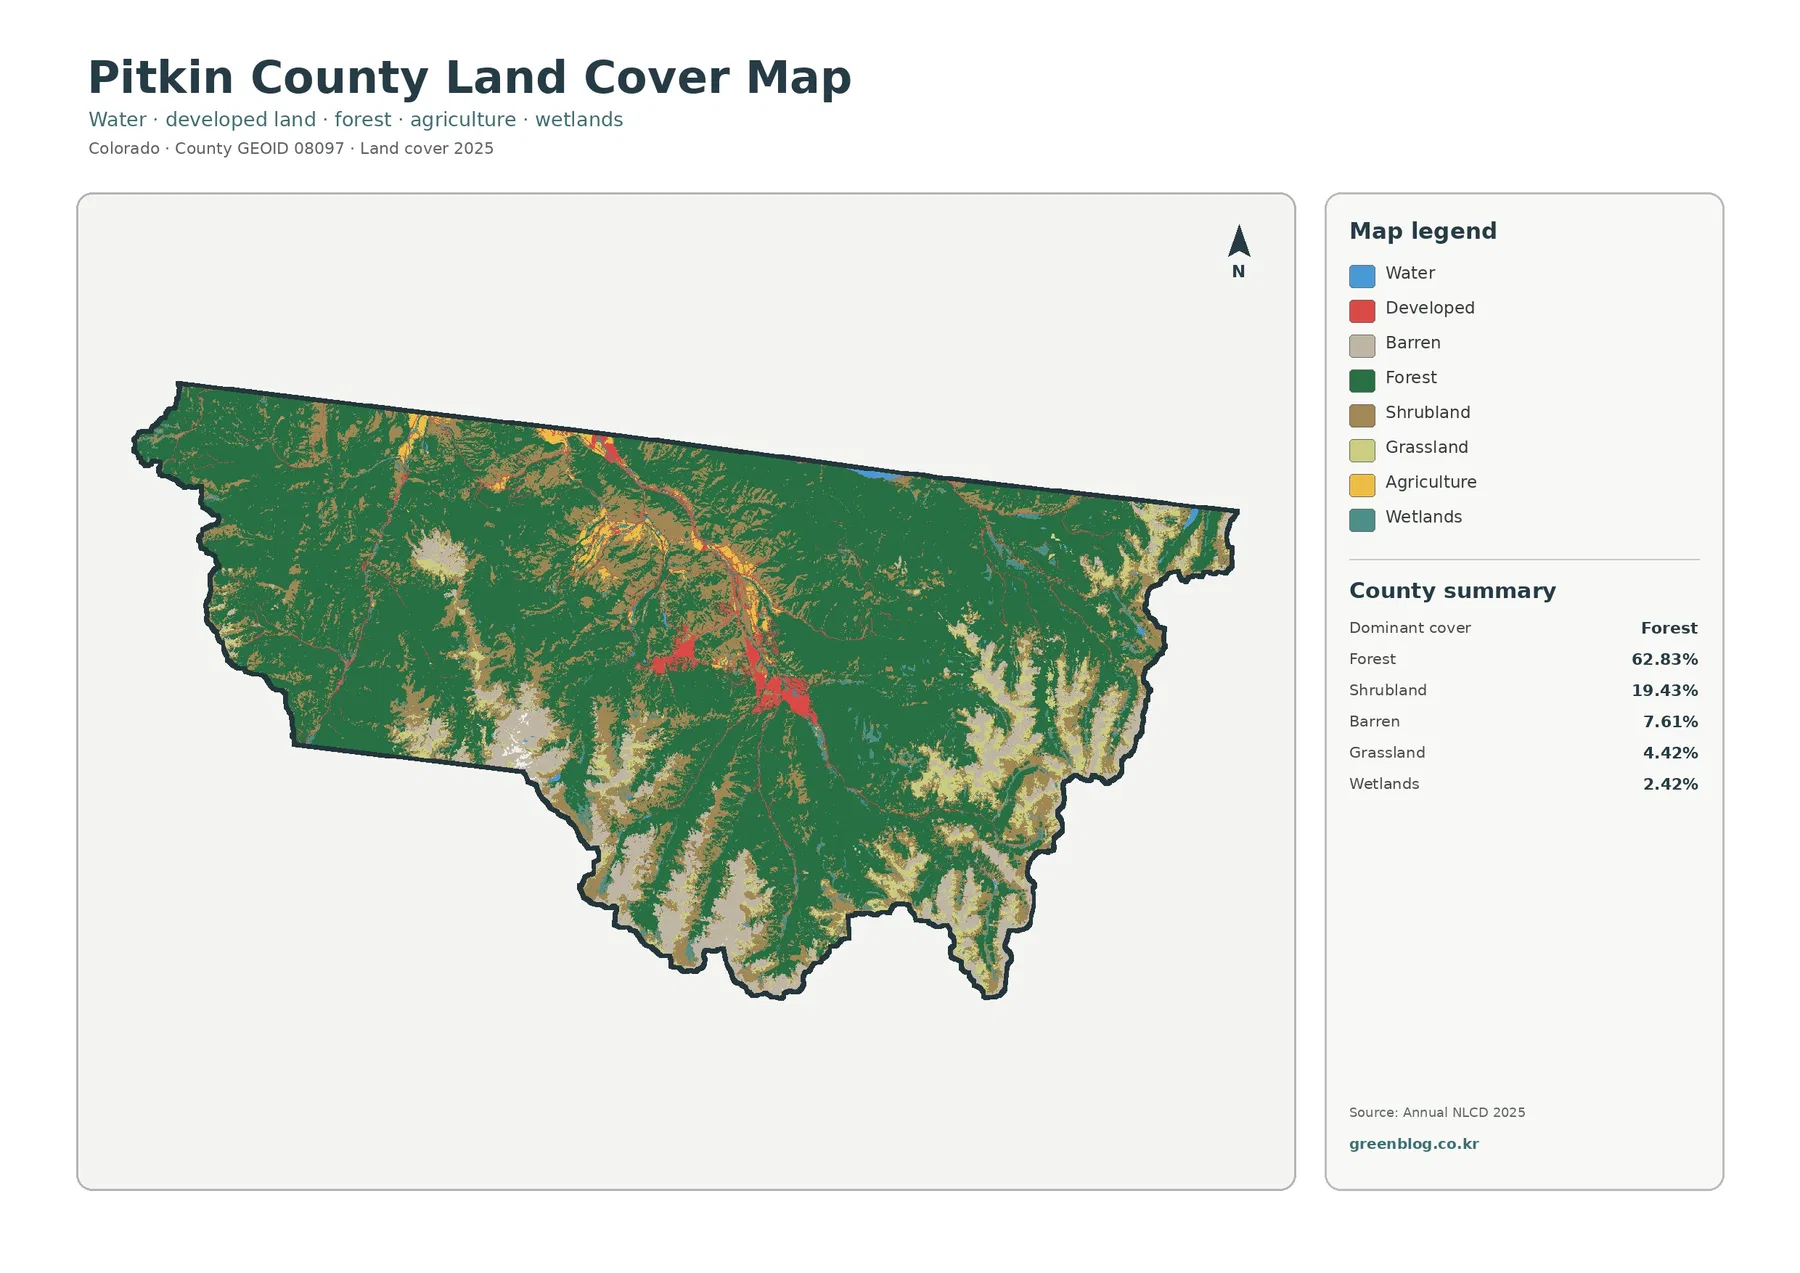
Pitkin County is overwhelmingly a mountain landscape in the 2025 land cover maps. Forest accounts for 62.83% of the county, followed by shrubland at 19.43%, barren land at 7.61%, grassland at 4.42%, wetlands at 2.42%, and developed cover at 2.10%. The broad forested area dominates the county outline, while development is compressed into a much smaller central valley pattern around Aspen and nearby communities.
This page brings together four views of the same county: current land cover, forest and farmland, impervious surface and developed land, and mapped class differences from 1985 to 2025. The WebP images are intended for quick viewing, and the four original JPG maps are available together in one ZIP for classroom use, presentations, regional comparisons, and other map-based projects.
Table of Contents
A forested mountain county with development confined to narrow valleys
The general land cover map makes Pitkin County’s basic pattern clear before any detailed reading is needed. Forest forms the largest continuous areas across the west, north, east, and much of the south. Shrubland breaks up that forest along more open slopes and upland areas, while barren land becomes more visible in the high mountains, especially toward the southern and southeastern portions of the county.
At 62.83%, forest covers well over half of the mapped county. Shrubland adds another 19.43%, so those two classes together account for most of the landscape. Barren land, at 7.61%, is also important because it marks open rocky or sparsely vegetated surfaces that are common in high-elevation terrain. Barren does not mean vacant property, damaged land, or land available for development; it is simply a physical surface class in the land cover dataset.
The smaller classes are much more concentrated. Grassland covers 4.42%, wetlands 2.42%, developed land 2.10%, agriculture 0.88%, and water 0.21%. Rather than forming broad countywide zones, many of these classes follow valley floors and relatively open terrain. The red developed patches are especially compact compared with the surrounding forest, which makes the Aspen area and the principal valley corridor stand out even though developed cover is a small share of the county total.
Pitkin County’s Natural Resources program notes that wetlands are common along streams, rivers, lakes, and ponds. The county’s North Star Nature Preserve page describes wetlands and a fen along the Roaring Fork River in a relatively flat valley near Aspen. Those official descriptions provide useful context for the thin wetland patterns visible in the map, but the map should not be used to establish legal wetland boundaries or regulatory jurisdiction.
Forest, open alpine ground, and the county’s very small agricultural footprint
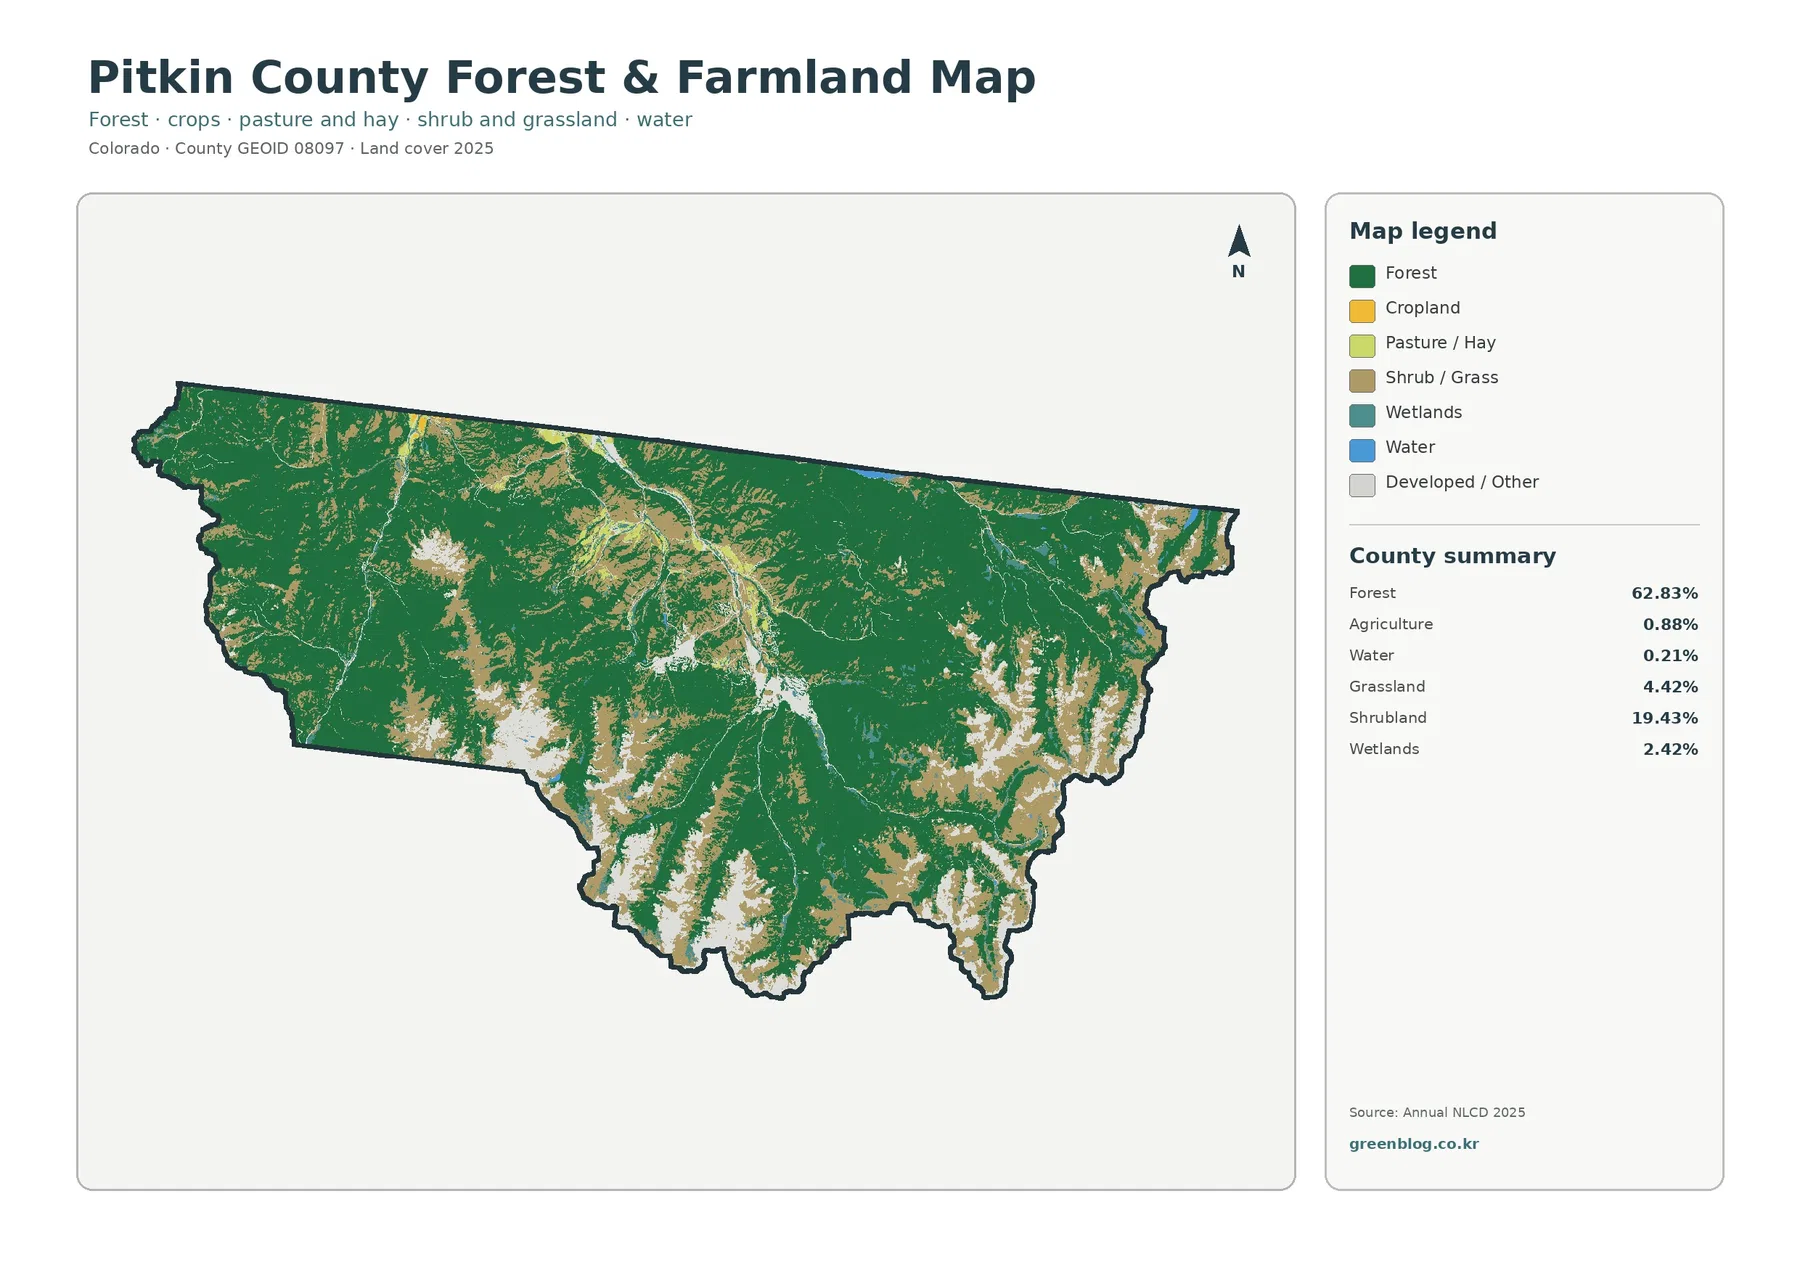
The forest and farmland map strips away some of the detail so the contrast between wooded mountains and more open land is easier to follow. Forest still controls most of the visual field, while shrub and grass classes appear around openings, valley edges, and higher terrain. Agriculture is only 0.88% of the 2025 summary, so it appears as small patches rather than a major countywide pattern.
That 0.88% figure should not be treated as a measure of the local agricultural economy or the number of working ranches. Land cover describes the physical surface assigned to raster cells at the observation date. A pasture, hay field, irrigated lease, developed parcel, or mixed-use property may be represented differently depending on the dominant surface within a cell, and the map does not contain ownership or parcel information.
Pitkin County Open Space & Trails manages a variety of properties with different landscape types. The county’s Wheatley Open Space description, for example, mentions an irrigated lease area together with Roaring Fork River frontage. That kind of valley setting helps explain why small agricultural or open classes can occur close to water and developed corridors even in a county where forest is dominant overall. The map itself does not identify individual open-space boundaries, so those relationships should be used as regional context rather than parcel-level identification.
For regional comparison, the forest and farmland view is particularly useful because Pitkin County looks very different from Colorado’s eastern plains counties. Here, agriculture occupies less than one percent while forest exceeds sixty percent. The large areas of barren and shrub cover also reflect the open high-elevation character that is mostly absent from heavily cultivated plains landscapes. Placing the maps side by side makes those differences visible without relying only on percentages.
Hard surfaces are small in area but highly concentrated around Aspen
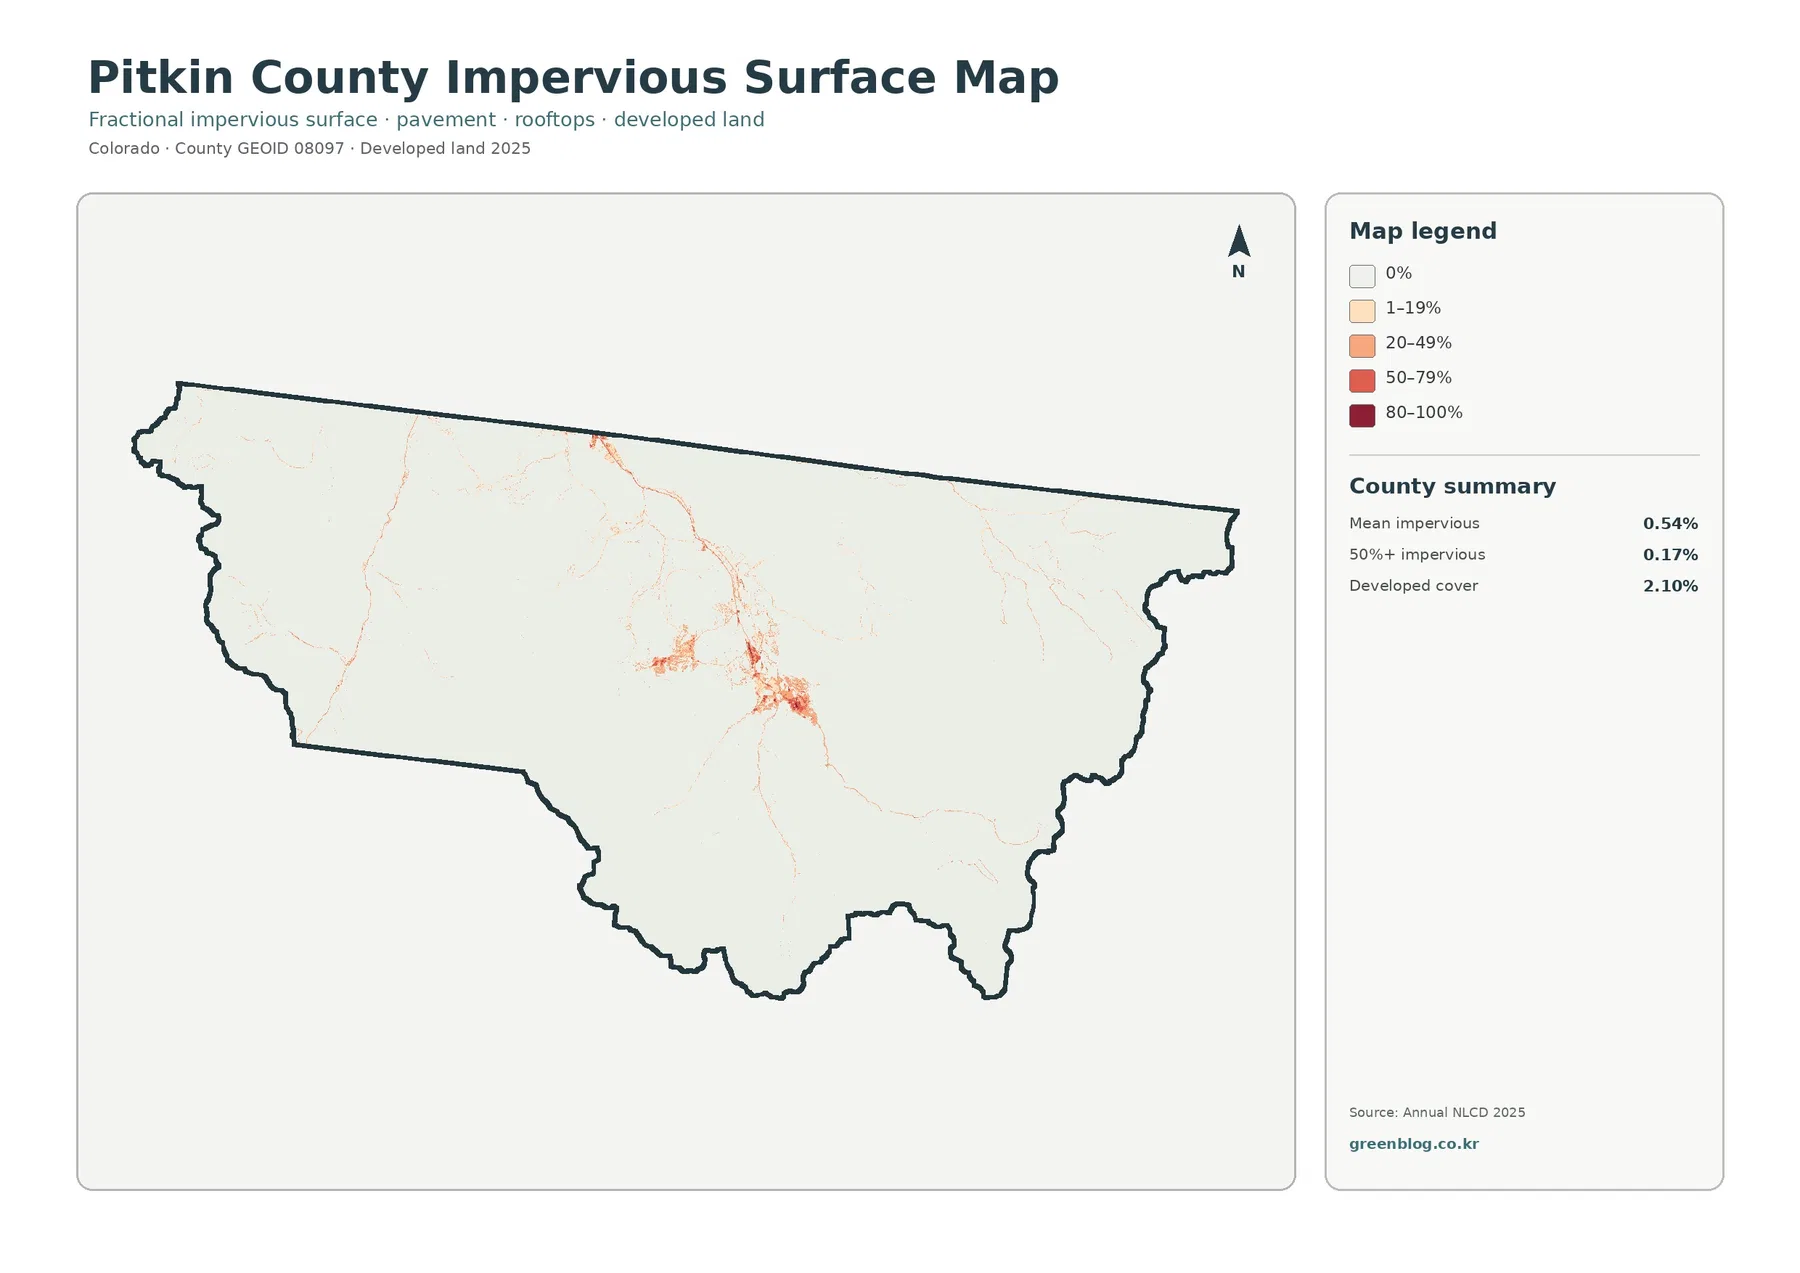
Impervious surface means pavement, rooftops, parking areas, and other surfaces that do not readily absorb water. Pitkin County’s mean impervious value is 0.54%, and only 0.17% of the county is mapped at 50% impervious or greater. Developed land cover is 2.10%, which is larger because a developed land class can still contain substantial vegetation or open ground rather than being fully paved.
The countywide average is low because most of Pitkin County is forest, shrubland, barren alpine ground, or other nonurban cover. The map shows a very different local pattern near Aspen, where the strongest impervious values form a compact cluster. Thin linear traces continue along the principal valley corridor, while most mountain areas remain nearly white on this map.
The county’s Roaring Fork Gorge page describes a corridor beginning near Aspen that includes the Roaring Fork River, the Rio Grande Trail, and connections to populated areas. That official geographic context is consistent with the narrow valley form seen in the impervious map. The map, however, does not label roads or buildings, and a red line cannot be used to identify a particular highway, street, or land-use designation without another source.
Mean impervious cover should therefore be read together with spatial concentration. A value of 0.54% does not mean every location is 0.54% paved. The Aspen cluster contains much higher values, while large mountain areas are close to zero. This distinction matters when comparing counties because two places with similar averages can have very different settlement patterns if hard surfaces are concentrated in one town versus spread among many communities.
Wetlands and water occupy little area but remain important valley features
Water accounts for only 0.21% of the 2025 summary, yet wetlands cover 2.42%. On the general map, narrow wetland traces are easier to notice than broad open-water areas because streams and river corridors occupy little space compared with the surrounding mountains. This is a useful reminder that a small percentage does not automatically mean a feature is unimportant to the county’s landscape or ecology.
North Star Nature Preserve is a concrete local example. Pitkin County describes the Roaring Fork River as meandering through a relatively flat valley with wetlands and a fen, along with habitat for a wide range of wildlife. That information supports the broader valley context seen in the land cover maps, but it should not be used to infer that every mapped wetland cell belongs to North Star or to any other specific protected property.
Raster data also generalize narrow features. A small stream, riparian strip, trail, or wet meadow can occupy only part of a cell and may be represented by the dominant surrounding class. For watershed education or countywide habitat comparison, the map is useful for showing where wet environments tend to occur. For flood studies, legal wetland delineation, water rights, or engineering work, a more detailed source is required.
What the 5.99% mapped class difference from 1985 to 2025 actually means
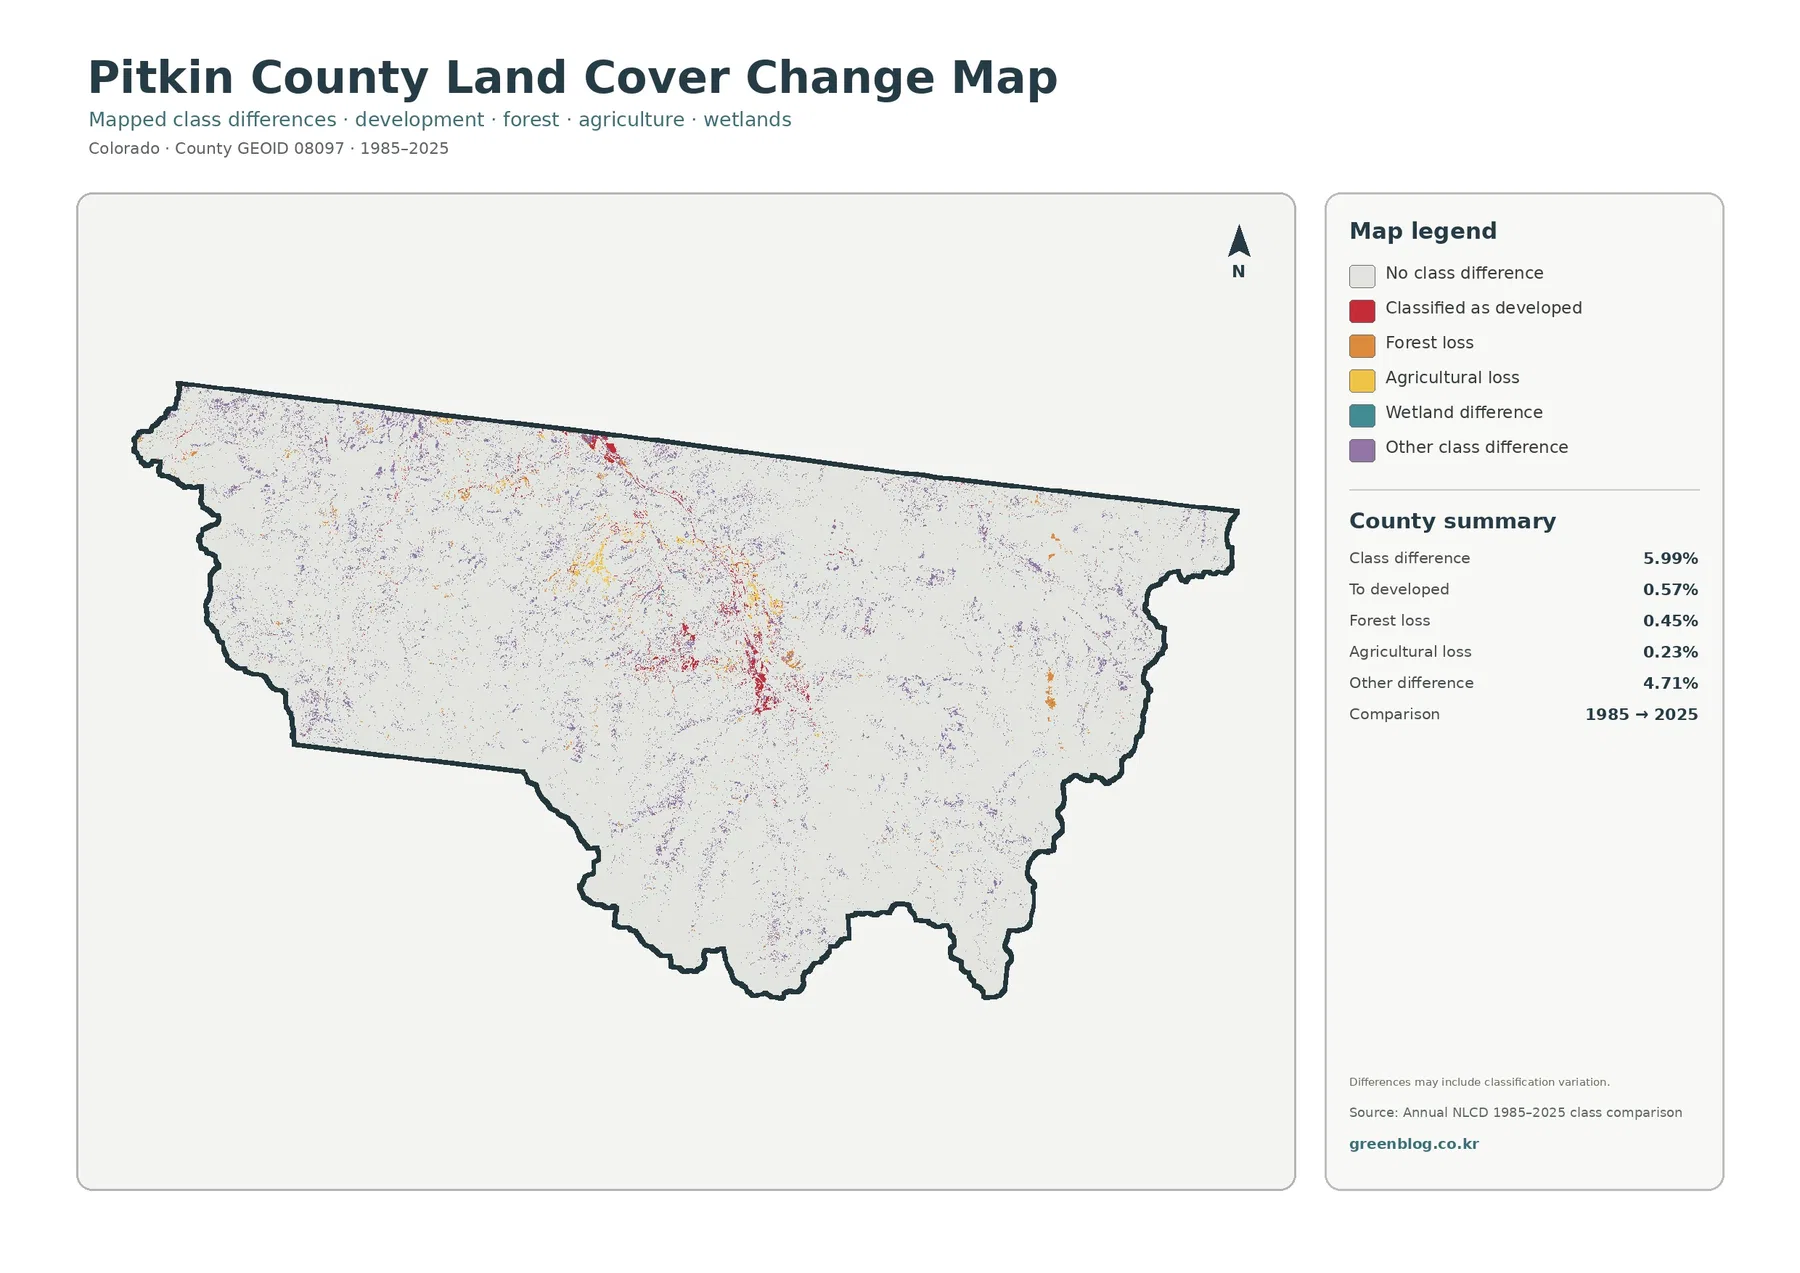
The change map compares the assigned land cover class at the same locations in 1985 and 2025. A total of 5.99% of the county is shown with a class difference. The summary separates 0.57% classified as developed, 0.45% in the forest-loss category, 0.23% in the agricultural-loss category, and 4.71% in other class differences.
Those numbers are not a damage index. They indicate that the mapped classification differs between the two comparison years. Some cells may reflect real land-cover change, but classification can also be affected by image date, sensor differences, snow cover, moisture conditions, vegetation state, and methodology. High mountains are especially sensitive to seasonal conditions because snow, exposed rock, and vegetation can shift noticeably between image dates.
The 0.45% forest-loss category should be read with the same caution. It means cells classified as forest in the earlier comparison are assigned to another class in 2025; it does not by itself identify logging, wildfire, insects, construction, or any other cause. Confirming a cause requires intermediate Annual NLCD years, aerial imagery, forest records, fire history, or field evidence.
Development-related change is most useful when cross-checked against the current impervious map. Red change cells near the central valley can be compared with present-day hard-surface concentrations to see where the two datasets align. If a change cell has little current impervious cover, a reader should consider other classification transitions or data differences before calling it urban expansion.
How to use the four maps without overreading them
The general land cover map is the best starting point because it keeps all major classes in one view. After that, the forest and farmland map simplifies the contrast between wooded mountains and open areas, while the impervious map isolates the small developed footprint around Aspen. The change map is most informative last, once the current distribution is already familiar.
- Use the 2025 land cover map for the full county pattern of forest, shrubland, barren ground, grassland, wetlands, development, agriculture, and water.
- Use the forest and farmland map to simplify the relationship between dominant forest cover and the county’s very small agricultural footprint.
- Use the impervious surface map to examine the concentration of pavement and rooftops around Aspen and along the principal valley corridor.
- Use the 1985–2025 change map to locate cells with different classifications before checking intermediate years or other evidence.
All four maps share the same county boundary, which makes them convenient for presentations, environmental education, broad watershed discussions, and visual comparison with other counties. They are not parcel surveys. They do not show ownership, zoning, building permits, legal development rights, road classifications, exact wetland jurisdiction, or property boundaries. The raster cells summarize surface conditions at a generalized scale, and mixed pixels can occur where several features occupy the same cell.
Download the four Pitkin County land cover JPG maps
The ZIP below contains the four original JPG maps described on this page: 2025 land cover, forest and farmland, impervious surface and developed land, and the 1985–2025 class comparison. Each image is 2480×1754 pixels. The supplied asset manifest does not mark these files as meeting the A3 high-resolution reference, so users preparing large prints or detailed GIS analysis should work from the underlying Annual NLCD data instead.
Frequently Asked Questions
What is the dominant land cover in Pitkin County?
Forest is the largest 2025 class at 62.83%. Shrubland follows at 19.43%, with barren land at 7.61%, grassland at 4.42%, wetlands at 2.42%, and developed cover at 2.10%.
Which map is best for seeing development around Aspen?
The impervious surface map is the clearest view of pavement, rooftops, and other hard surfaces around Aspen and the main valley corridor. Compare it with the general land cover map to see how compact development sits within a much larger forested landscape.
Does the 5.99% 1985–2025 class difference mean 5.99% of the county was damaged?
No. It is the share of mapped cells assigned to different land cover classes in the two comparison years. Forest loss is a separate 0.45% category, and the cause of any mapped difference requires additional time-series or field evidence.
Map File Information
The ZIP includes four JPG maps: 2025 land cover, forest and farmland, impervious surface and developed land, and the 1985–2025 class comparison.
- Included Files: Use only the versions confirmed in the article and supplied images
- File Type: Use the confirmed download contents
- Intended Use: Printing, education, presentations, and map-based projects
Related Maps
- Adams County Colorado Land Cover Map
- Alamosa County Colorado Land Cover Map
- Arapahoe County Colorado Land Cover Map
Sources and references
Percentages and mapped differences in this article come from the supplied Pitkin County map assets based on Annual NLCD. Pitkin County’s official Natural Resources, North Star Nature Preserve, and Roaring Fork Gorge pages were used for local context about river corridors, wetlands, and the Aspen-area valley. Land cover describes physical surface classes and should not be substituted for zoning, ownership, legal land use, or parcel information.
- MRLC Annual NLCD Data
- USGS Annual NLCD Land Cover Classification
- U.S. Census Bureau TIGER/Line Shapefiles
- Pitkin County Natural Resources
- Pitkin County – North Star Nature Preserve
- Pitkin County – Roaring Fork Gorge
Green Map creates custom-edited map images using open geographic data sources such as geoBoundaries, Natural Earth, OpenStreetMap, and government open data.
These maps are edited visual materials, not raw data files, and are provided for education, documents, presentations, and graphic reference.