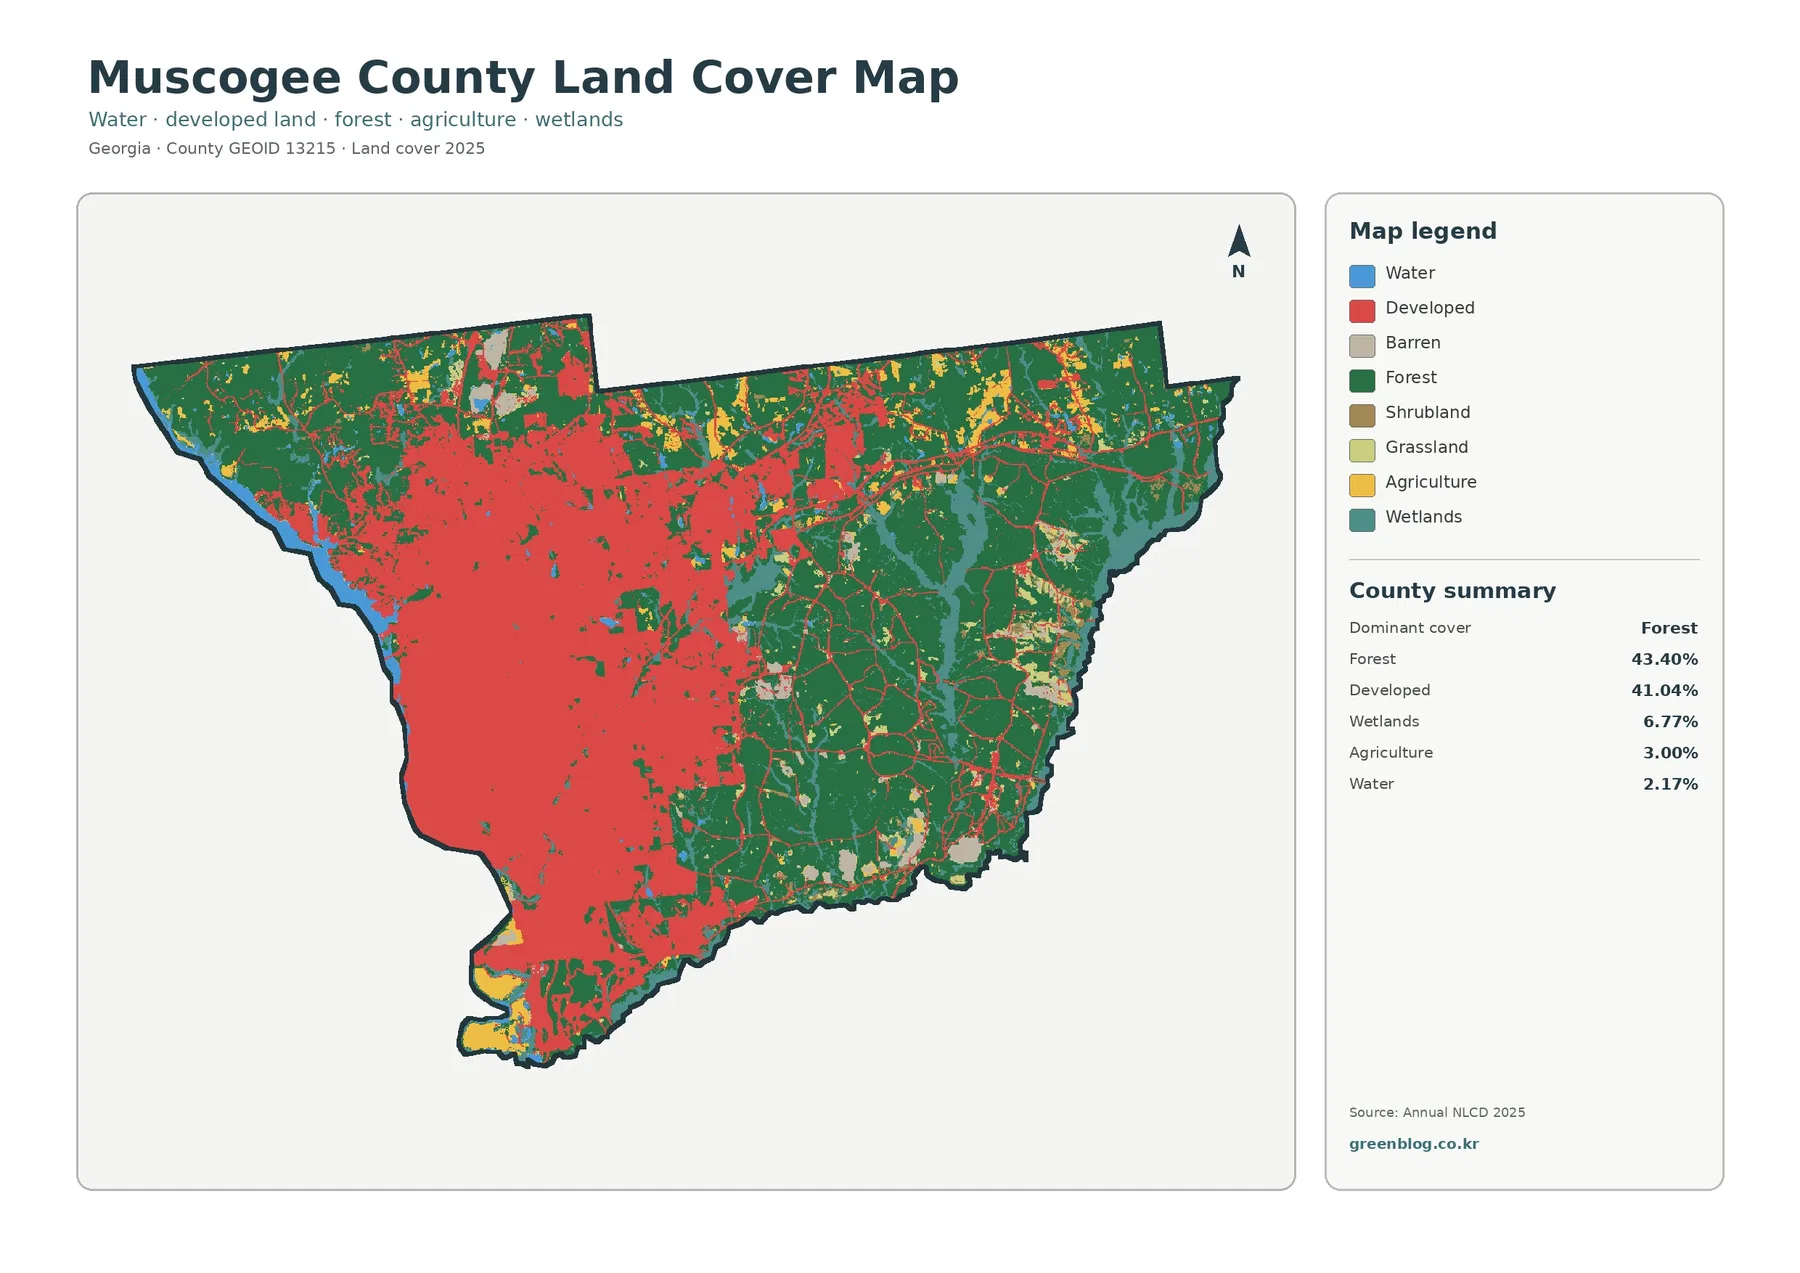
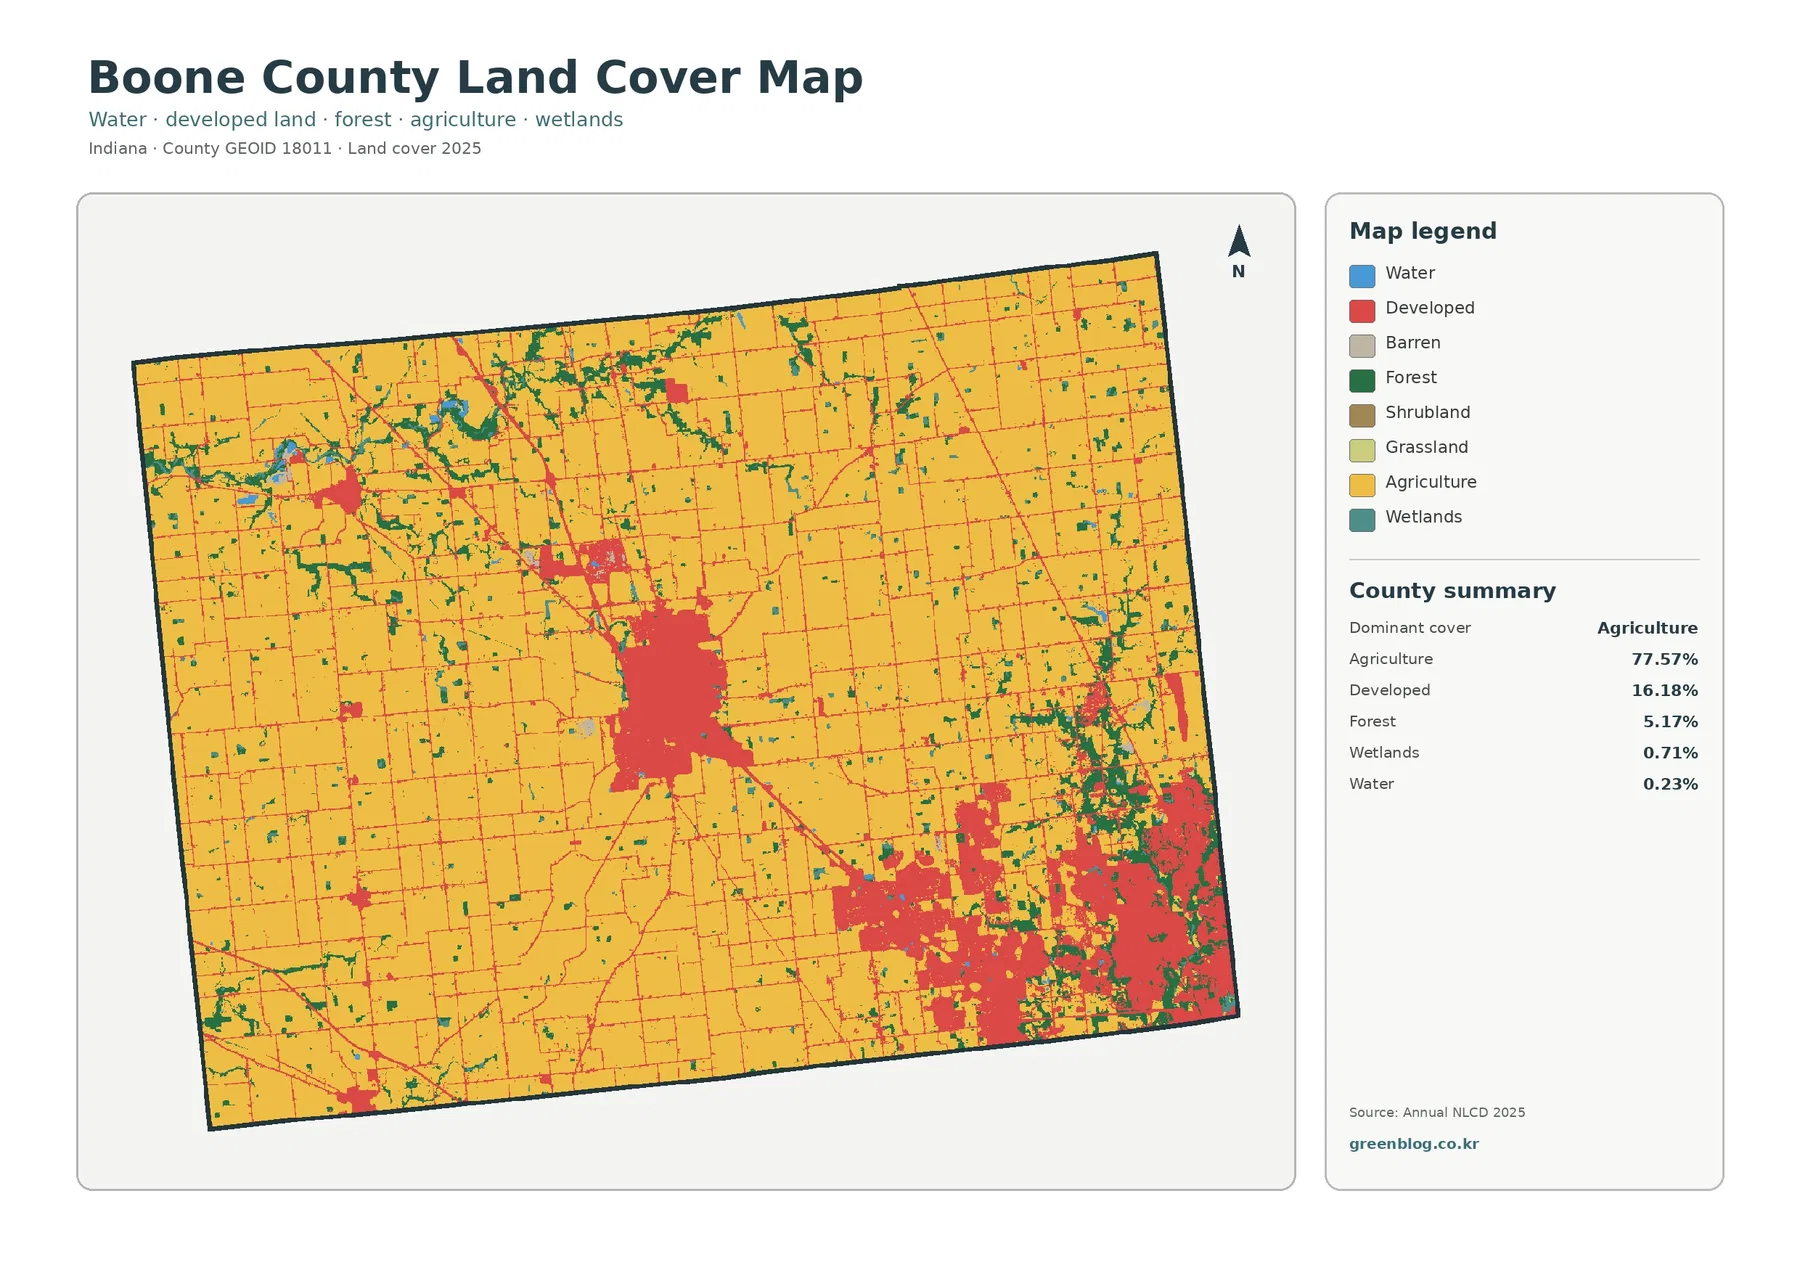
Phillips County in northeastern Colorado has a land-cover pattern that is unusually easy to recognize at county scale: cropland dominates almost every part of the map. The 2025 summary classifies 76.58% of the county as agriculture, followed by 18.63% grassland and 4.75% developed land. Barren land accounts for 0.02% and mapped water for just 0.01%. The result is a mostly yellow agricultural grid broken by prairie patches and a few compact clusters of development.
This page compares four views of the same county boundary: 2025 land cover, forest and farmland, impervious surface and developed land, and mapped class differences between 1985 and 2025. WebP previews are shown on the page, while the four original JPG maps are available together in one ZIP download below. Reading the maps as a set makes it easier to separate the county’s broad farm pattern from its remaining grassland, small-town footprint, and long-term classification differences.
Table of Contents
Cropland fills most of the county, but the prairie is not gone
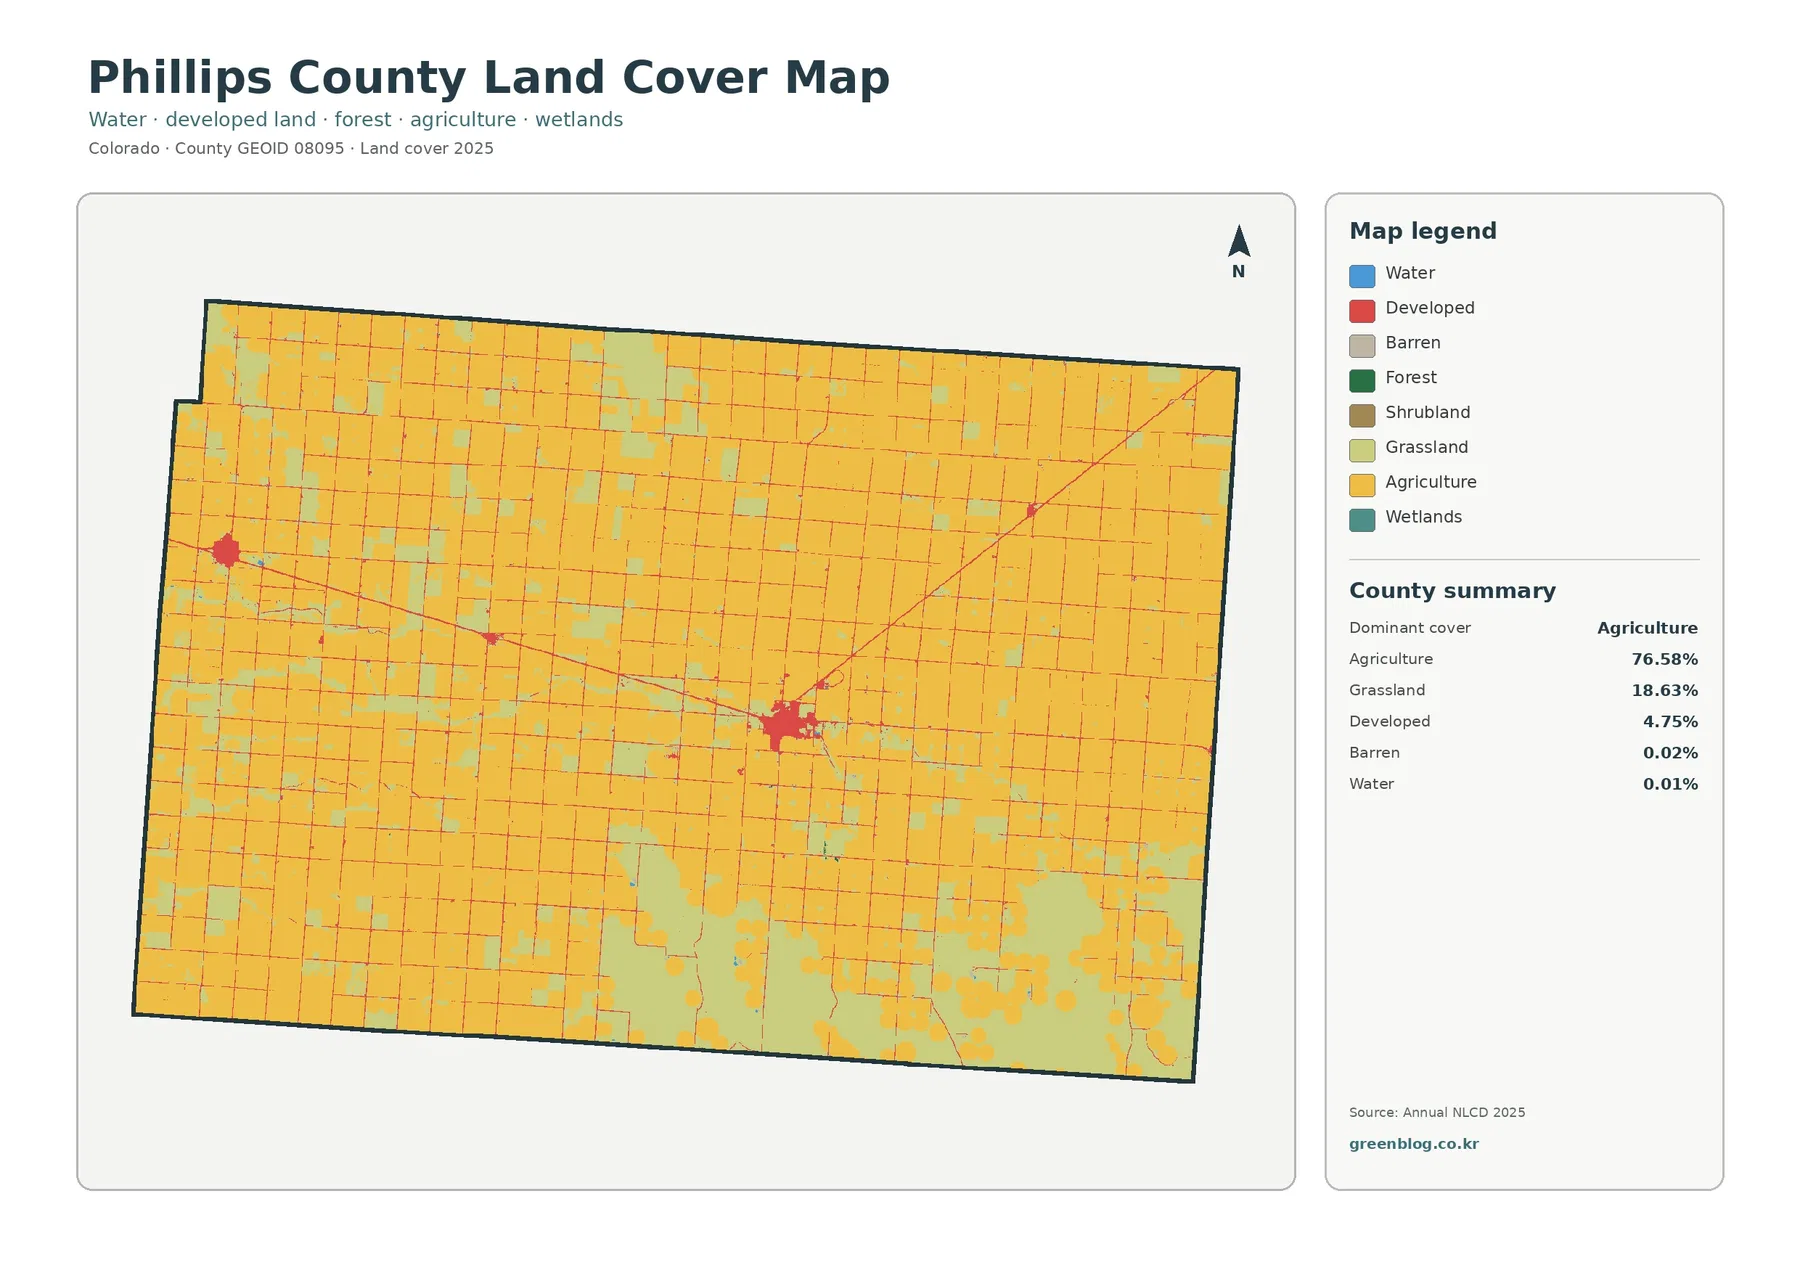
The general 2025 land-cover map is dominated by large agricultural blocks. They form a dense rectangular grid across the north, center, and east, with field boundaries creating a regular texture that is very different from the irregular shapes usually associated with forest or wetland cover. Agriculture at 76.58% is not merely the leading class; it covers roughly three quarters of the mapped county area. That scale of dominance is visible immediately, even before reading the percentages in the legend.
Grassland, at 18.63%, is the second-largest class and provides the main break in the agricultural pattern. Larger grassland patches appear especially in the southern part of the county, with additional blocks scattered among fields elsewhere. These open areas are not arranged as one continuous prairie reserve. Instead, they form a patchwork beside cultivated land, so the transition between agricultural and non-agricultural cover often follows straight or angular boundaries.
Developed land makes up 4.75% of the summary. That is a modest countywide share, yet the red development class is easy to find because it gathers into compact clusters inside the much larger farm landscape. Phillips County Economic Development identifies Holyoke, Haxtun, Paoli, and Amherst as the county’s communities and describes Holyoke as the county seat. Matching that local context to the map helps explain why a few small settlement clusters stand out so strongly against the surrounding fields.
Water and barren land are almost absent at this scale, while forest, shrubland, and wetlands round to 0.00% in the supplied summary. Those values should not be read as proof that no tree rows, wet spots, farm ponds, or narrow drainage features exist. Annual NLCD is a raster classification, so very small or narrow features can be absorbed into the class that dominates a pixel. For Phillips County, the map is best used to understand countywide cover rather than to inventory every small feature.
Small-town development stands out on an otherwise lightly paved landscape
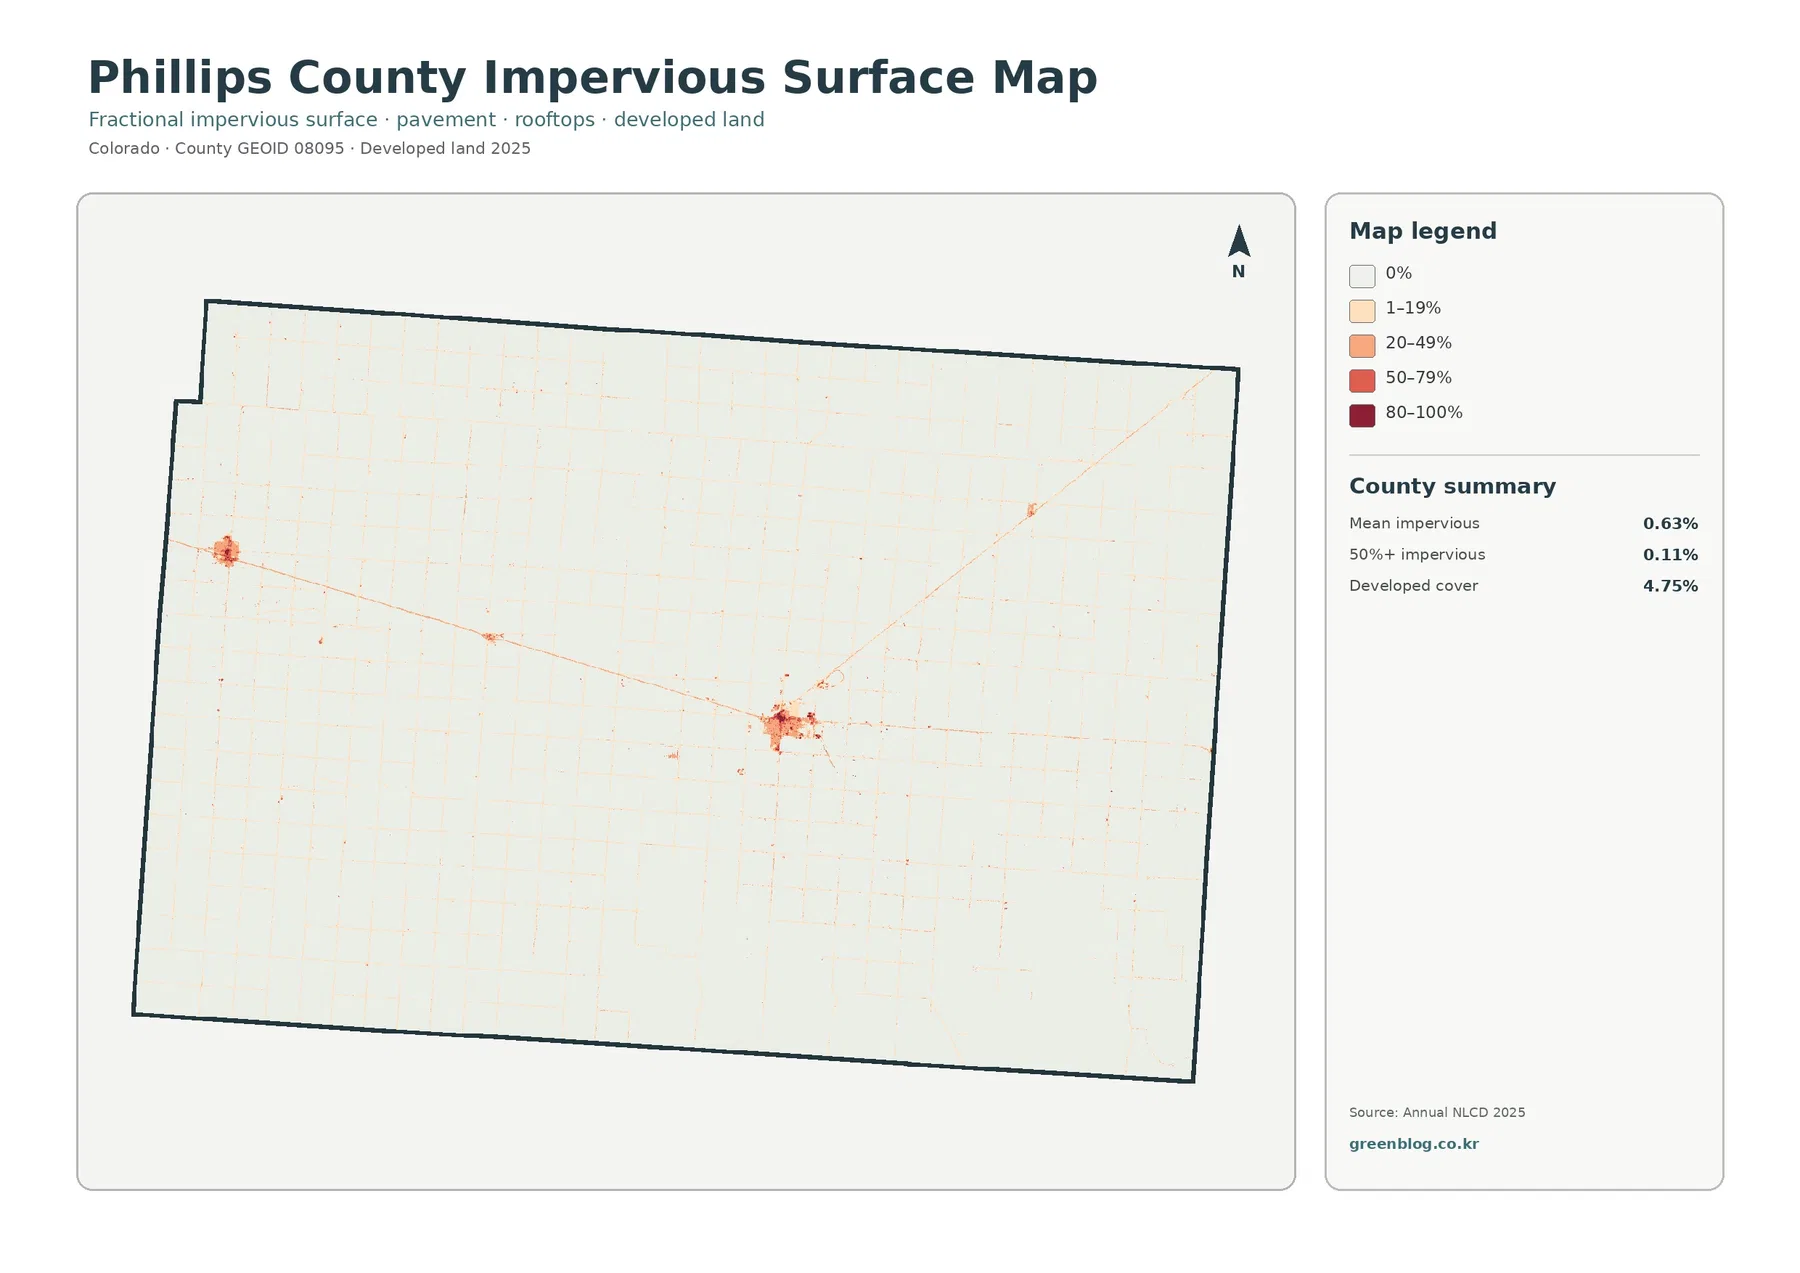
The impervious-surface map tells a different story from the colorful land-cover view. Once crops and grass are removed from the visual emphasis, most of the county becomes nearly white because pavement, rooftops, parking areas, and other hard surfaces occupy only a small share of the landscape. Mean imperviousness is 0.63%, and only 0.11% of the county is mapped at 50% impervious cover or greater. The developed land class is larger at 4.75% because developed land can also contain lawns, bare soil, and other surfaces that are not fully impervious.
The strongest impervious cluster appears around Holyoke, with another distinct concentration around Haxtun. Fine linear traces connect and extend from these settlements, reflecting the fact that roads can produce narrow impervious features even where nearby land is overwhelmingly agricultural. Phillips County Economic Development describes Haxtun as being at the junction of U.S. Highway 6 and Highway 59, which provides useful geographic context for the linework visible around the town.
A countywide mean of 0.63% should not be mistaken for a uniform surface condition. Inside the settlement cores, some pixels fall into much higher impervious classes, while vast areas of farmland remain close to zero. This contrast is the main value of the map. It shows where built surfaces cluster without allowing those small concentrations to be lost inside a countywide average.
The impervious map is not a road map or a municipal boundary map. A red or orange line does not identify a highway name, traffic volume, or land use, and a highly impervious pixel does not reveal whether the surface belongs to a house, commercial property, street, or other facility. Comparing it with the general land-cover map is more useful: the two views together show how small pockets of built land sit inside the much larger agricultural matrix.
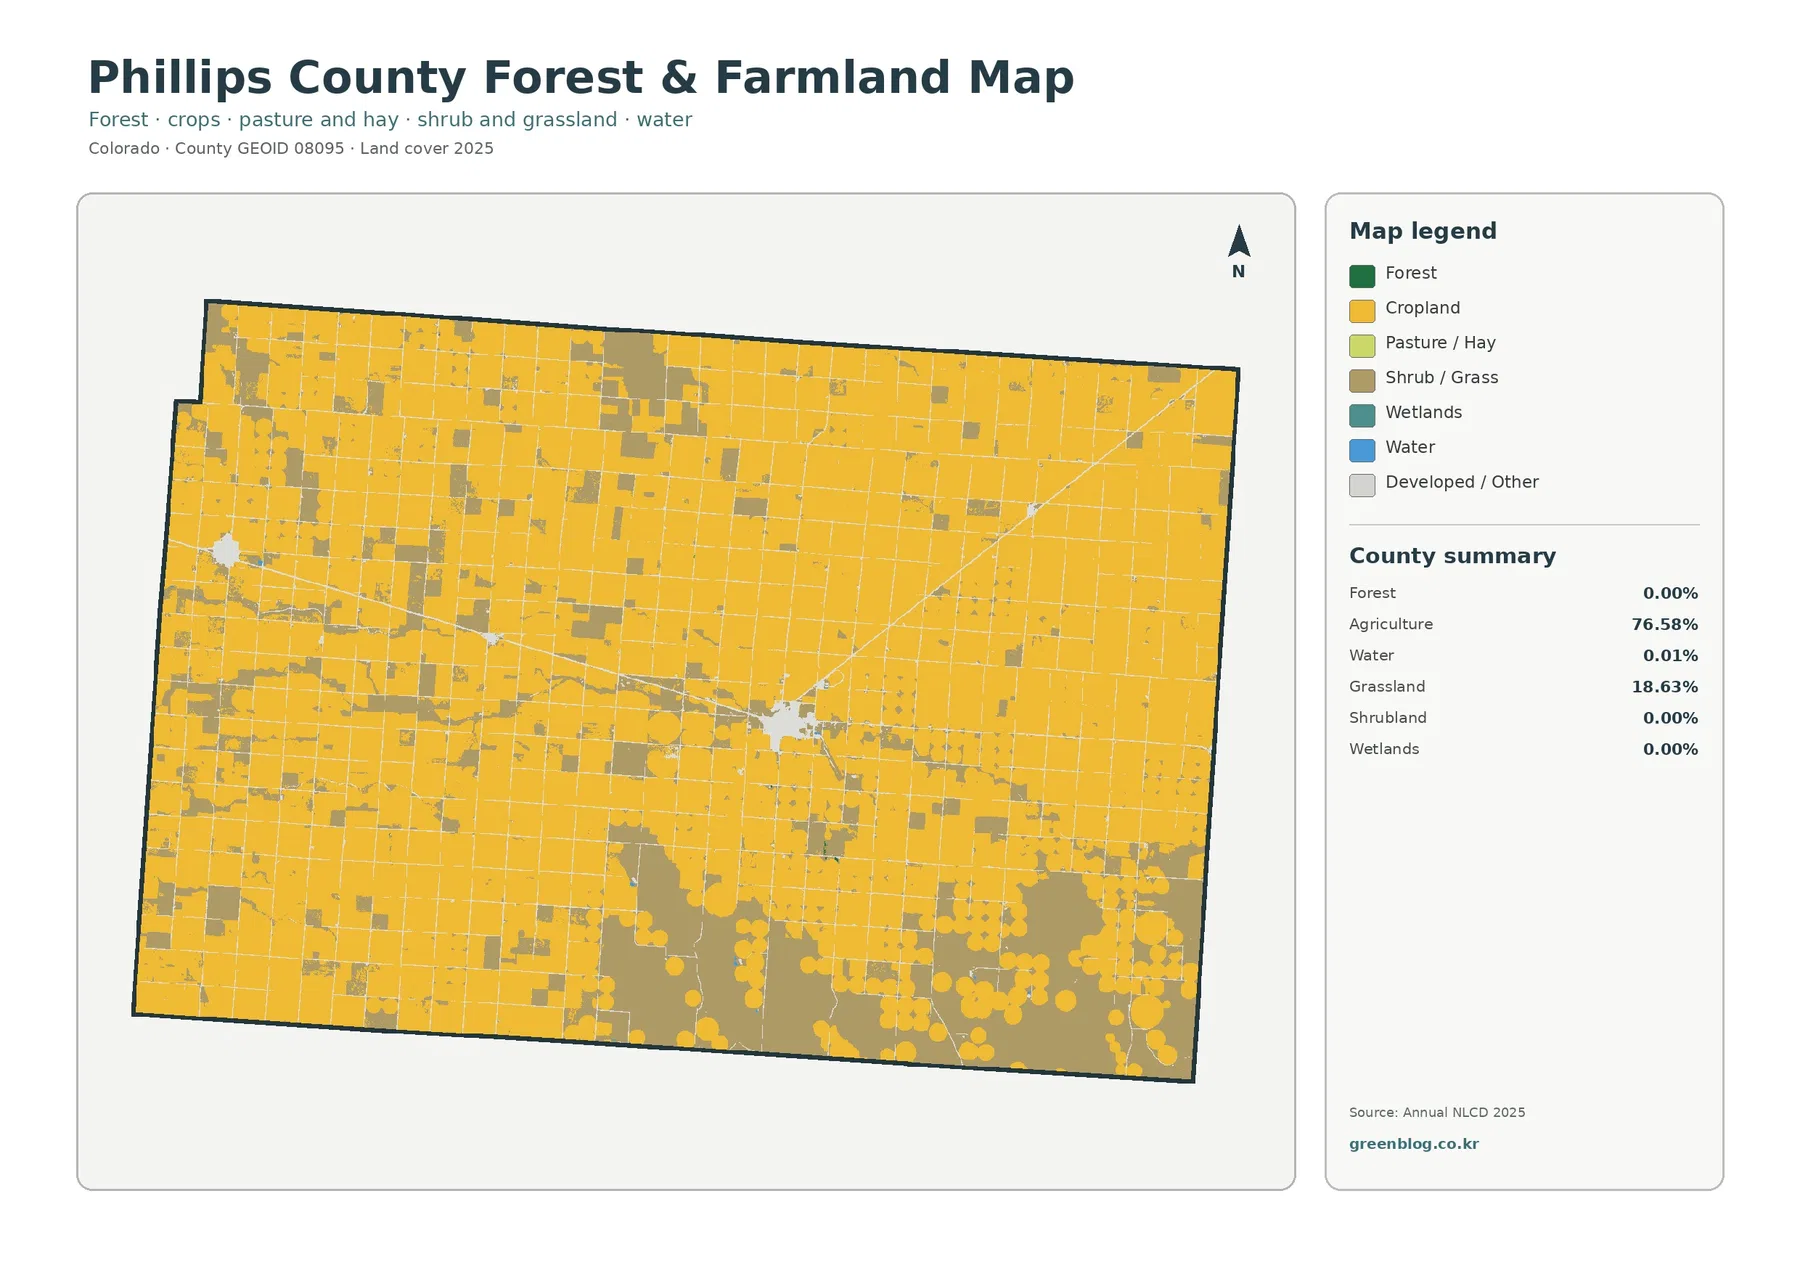
The farm-focused map makes the field-and-grassland contrast clearer
The forest-and-farmland map strips the county down to a simpler set of categories. Agriculture still covers 76.58%, while grassland accounts for 18.63%. Forest, shrubland, and wetlands each round to 0.00%, and water is 0.01%. With so few competing cover types, the map becomes an effective view of where cultivated blocks dominate and where grassland remains more extensive.
The southern part of the county contains the largest concentrations of grassland. Farther north and through much of the center, cultivated blocks become denser and more continuous. Some agricultural shapes are strongly geometric, and a number of circular or partially circular patterns are visible. Those shapes may be associated with agricultural management, but the land-cover layer does not identify irrigation systems, crops, farm ownership, or field practices. It is safer to describe the geometry than to assign a specific cause to every field shape.
Phillips County Economic Development characterizes the area as part of northeastern Colorado’s High Plains and emphasizes its farming and ranching economy. That local description fits the map’s agricultural dominance, but the map percentage still needs to be interpreted carefully. A 76.58% agricultural land-cover share is not an economic statistic. It does not tell us the value of agricultural production, the number of farms, the proportion of residents working in agriculture, or how individual parcels are legally zoned.
For comparison work, this map is especially useful because it looks very different from forested mountain counties elsewhere in Colorado. Here, forest is effectively absent from the county summary and the visual field is built around crops and grass. Using the same broad land-cover classes across counties makes it possible to show that contrast without changing the meaning of the legend from one place to another.
A 9.45% class difference does not mean 9.45% of the county was damaged
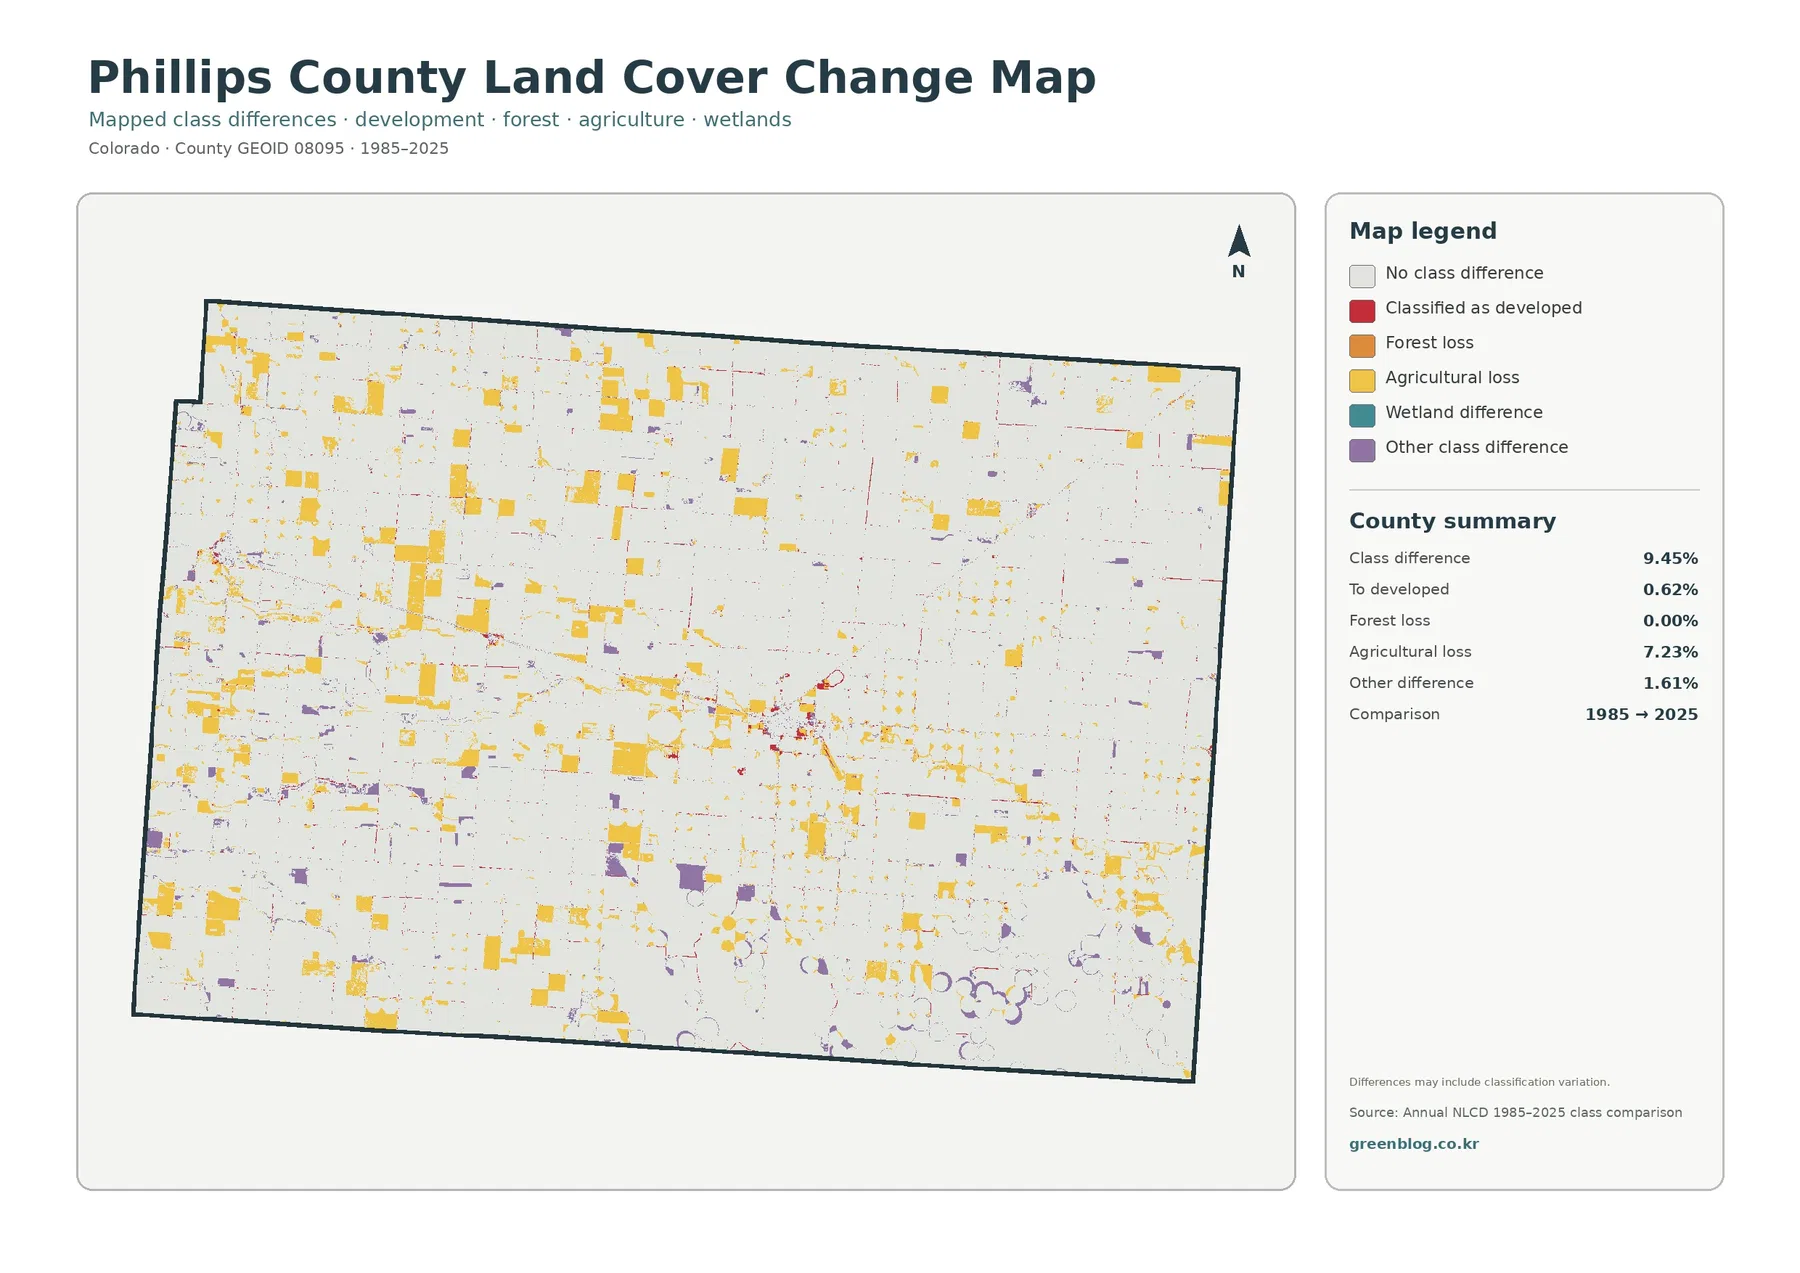
The 1985-to-2025 comparison marks 9.45% of the county as having a different mapped land-cover class between the two endpoints. The summary breaks that into 0.62% classified as developed, 0.00% forest loss, 7.23% agricultural loss, and 1.61% other class differences. Yellow agricultural-change patches are scattered across many farm blocks, while red development-related differences are more concentrated near the main settlement area.
The 9.45% figure is a classification difference, not a direct measure of degradation, construction, or permanent land conversion. A pixel can change classes because the land truly changed, but agricultural areas are also sensitive to crop condition, harvest timing, fallow periods, exposed soil, moisture, imagery date, and classification methods. Comparing only two years therefore cannot show every event that occurred during the forty-year interval.
The 7.23% agricultural-loss category deserves the same caution. It indicates locations that were classified as agriculture in the earlier map and something else in the later map under the comparison method used here. It does not prove that 7.23% of the county’s farmland permanently disappeared. Confirming a true land-use transition would require intermediate Annual NLCD years, aerial imagery, agricultural records, or other local evidence.
The 0.62% mapped to developed can be checked against the current impervious-surface layer. If a red change patch also appears as a strong impervious cluster in 2025, the two maps provide consistent clues about a built-surface transition. If a change patch has little current impervious cover, the explanation may involve a different class transition or classification variability. Using the maps together is more reliable than treating any single change color as a final diagnosis.
Why the remaining grassland matters in a county dominated by agriculture
Because agriculture covers more than three quarters of the county, the 18.63% grassland share can be easy to treat as secondary. On the map, however, the grassland is important for understanding how the landscape varies from north to south. The larger southern patches interrupt the field grid and create broad areas where the visual texture changes from small agricultural blocks to more continuous open cover.
This distinction can help when the maps are used for education or regional comparison. A viewer can see that ‘agricultural county’ does not mean every acre has the same cover. Grassland remains a substantial part of the mapped surface, and the distribution is uneven. That spatial pattern is more informative than simply listing 76.58% agriculture and 18.63% grassland in a table.
The grassland class also should not be converted automatically into a legal or management category. It does not specify whether land is private or public, grazed or ungrazed, protected or developable. Annual NLCD classifies the physical cover visible at the surface. Questions about property, zoning, conservation status, or agricultural use require separate parcel, planning, or land-management data.
Choosing the right Phillips County map for a specific question
For a quick overview, start with the 2025 land-cover map because it keeps all of the available classes visible at once. It is the best single image for showing the overwhelming agricultural share, the southern grassland patches, and the small developed clusters. The forest-and-farmland version is better when the goal is to simplify the comparison between cultivated land and open grass.
Use the impervious-surface map when settlement form matters more than the agricultural background. Holyoke and Haxtun become much easier to distinguish there because paved and built surfaces are isolated from the surrounding fields. The change map should generally come last. Once the present-day pattern is understood, the 1985–2025 difference layer can be used to locate places that deserve closer investigation.
- Use the 2025 land-cover map for the full countywide mix of agriculture, grassland, development, water, and barren cover.
- Use the forest-and-farmland map to emphasize the 76.58% agricultural share and the larger grassland blocks.
- Use the impervious-surface map to locate compact built areas around Holyoke, Haxtun, and road corridors.
- Use the change map to find locations included in the 9.45% 1985–2025 class difference before checking more detailed evidence.
All four images use the same county outline, so a field block, town cluster, or change patch can be matched from one map to another without changing geographic extent. That makes the set useful for classroom comparison, reference graphics, and preliminary landscape review. It does not replace parcel boundaries, zoning maps, crop inventories, engineering data, or current local GIS layers when precise property-level decisions are required.
Download the four Phillips County land-cover JPG maps
The ZIP below contains the four Phillips County JPG maps described on this page: 2025 land cover, forest and farmland, impervious surface and developed land, and the 1985–2025 class-difference map. Each JPG is 2480×1754 pixels. The package manifest does not mark these files as meeting its A3 high-resolution reference, so they are better suited to normal documents, classroom materials, and presentation graphics than to very large-format printing or detailed GIS analysis.
Frequently Asked Questions
What is the dominant land cover in Phillips County, Colorado?
Agriculture is the dominant 2025 class at 76.58%. Grassland accounts for 18.63% and developed land for 4.75%, while mapped water and barren land are very small.
Which map is best for seeing Holyoke and Haxtun?
The impervious surface map makes the built clusters around Holyoke and Haxtun easiest to see because pavement and rooftops stand out from the surrounding agricultural land. The general land cover map adds the surrounding field and grassland context.
Does the 9.45% 1985–2025 difference mean Phillips County lost 9.45% of its land?
No. The 9.45% value is the share of mapped cells assigned to different land cover classes in the two comparison years. It is not a direct loss or damage rate and should be checked with intermediate data before assigning a cause.
Sources and reference material
The percentages and change values in this article come from the supplied Phillips County map assets based on Annual NLCD. Land cover describes the physical surface class and should not be confused with parcel ownership, zoning, crop statistics, or development rights. County-specific community context was checked against Phillips County Economic Development, while the national data references below document the boundary and land-cover systems used for this type of map.
- MRLC Annual NLCD Data
- USGS Annual NLCD Land Cover Classification
- U.S. Census Bureau TIGER/Line Shapefiles
- Phillips County Economic Development – Our Communities
Map File Information
Download the four Phillips County JPG maps in one ZIP: 2025 land cover, forest and farmland, impervious/developed land, and the 1985–2025 class-difference map.
- Included Files: Use only the versions confirmed in the article and supplied images
- File Type: Use the confirmed download contents
- Intended Use: Printing, education, presentations, and map-based projects
Related Maps
- Adams County Colorado Land Cover Map
- Alamosa County Colorado Land Cover Map
- Arapahoe County Colorado Land Cover Map
Green Map creates custom-edited map images using open geographic data sources such as geoBoundaries, Natural Earth, OpenStreetMap, and government open data.
These maps are edited visual materials, not raw data files, and are provided for education, documents, presentations, and graphic reference.