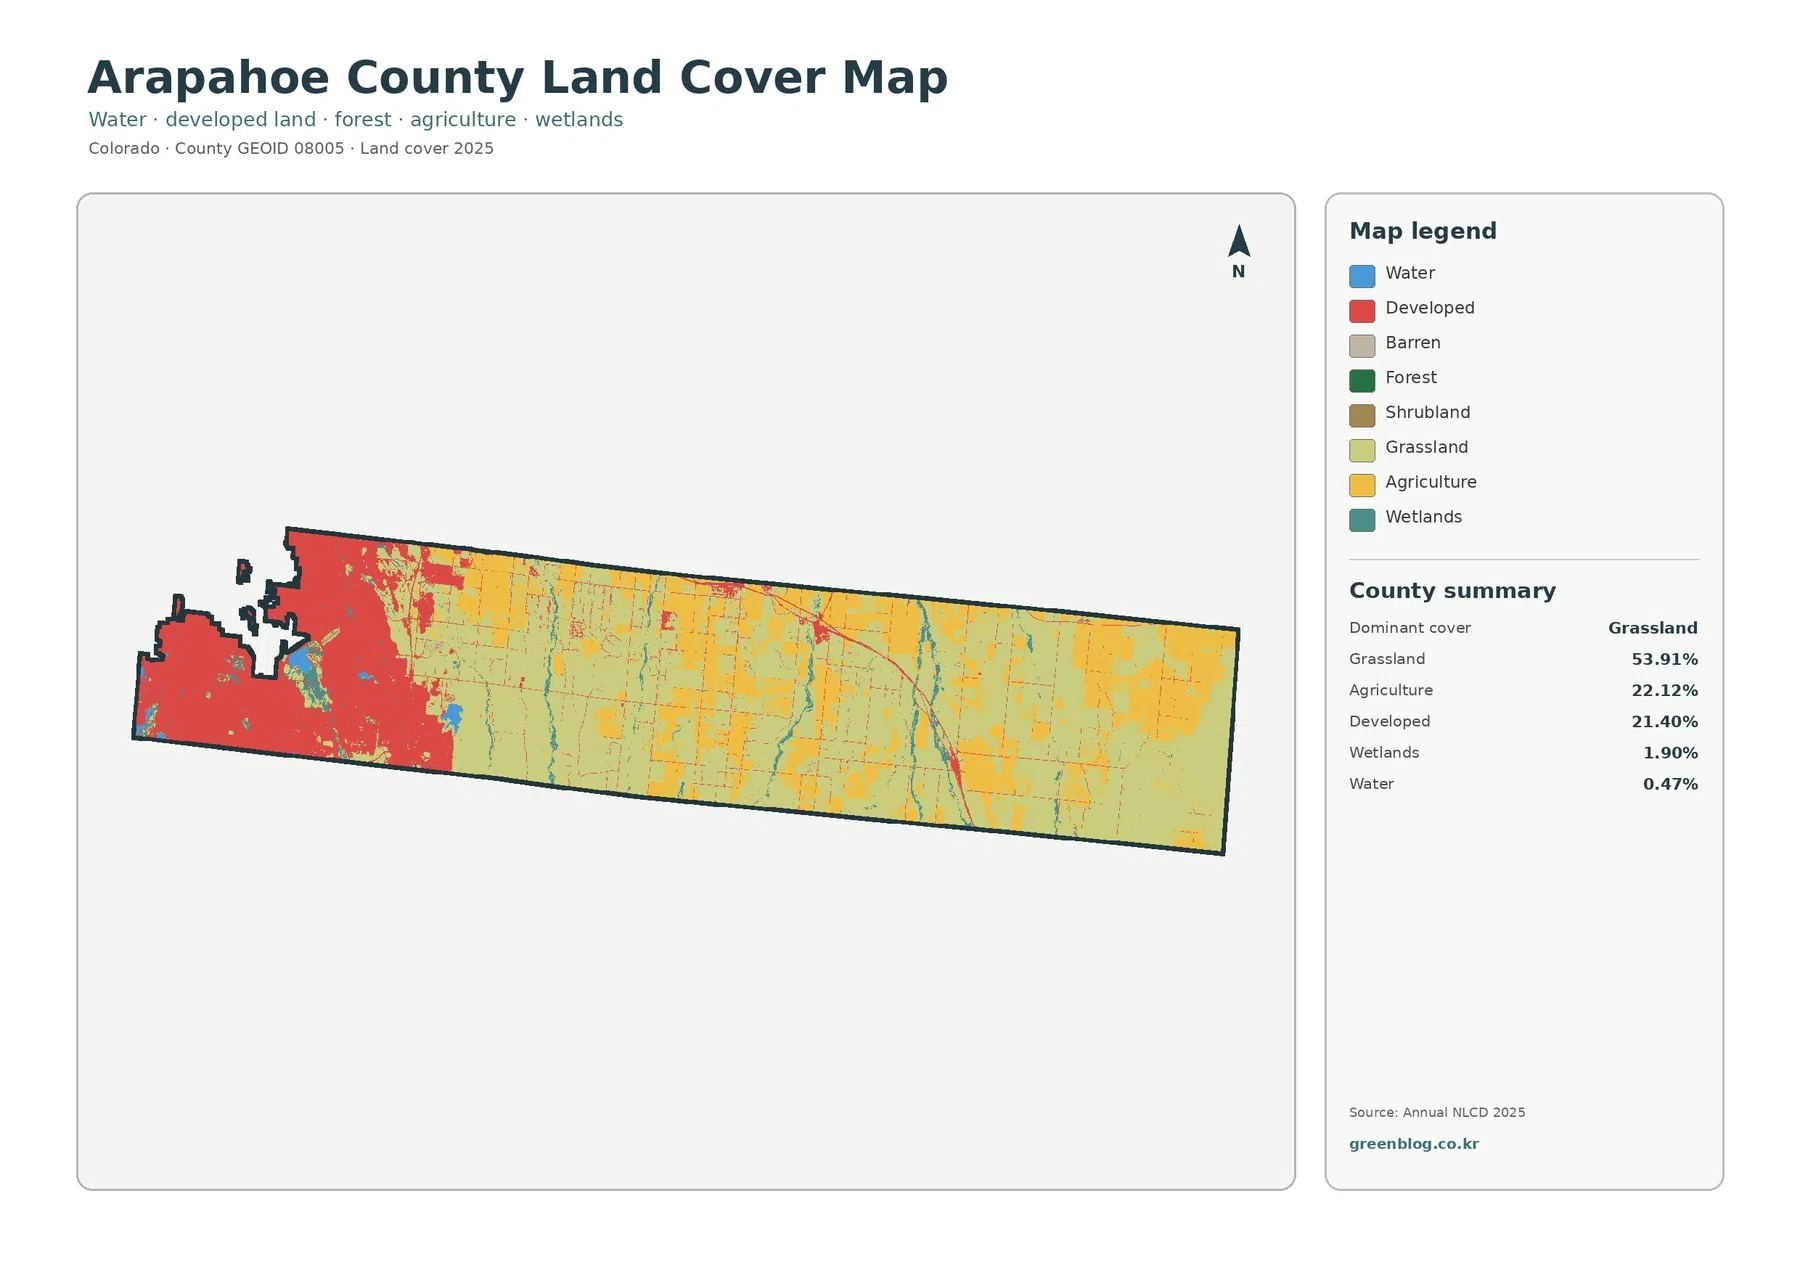
Arapahoe County stretches from a densely developed western end into a long eastern landscape where grassland and agriculture dominate. The 2025 land-cover summary puts grassland at 53.91%, agriculture at 22.12%, and developed cover at 21.40%. Those percentages make more sense when they are read with the map, because the developed share is heavily concentrated in the west while open cover occupies much of the center and east.
This page compares the general land-cover map, the forest and farmland view, the impervious-surface map, and the 1985–2025 class-difference map. The four original JPG maps are available together in one download below. Land cover describes what is physically covering the ground in the imagery; it is not a zoning map, property map, ownership record, or statement about what development is legally allowed on a parcel.
Table of Contents
A compact urban west gives way to a long grassland and farm belt
The county’s shape makes its internal contrast unusually easy to see. At the western end, red developed classes form a broad, connected area with only small breaks. Moving east, that dense block quickly thins. Pale grassland colors take over much of the map, while agricultural areas appear as repeated yellow fields and blocks across the central and eastern portions. The result is not a gradual uniform transition but a county with two very different visual characters joined within one boundary.
The 2025 summary lists grassland at 53.91%, agriculture at 22.12%, developed cover at 21.40%, wetlands at 1.90%, and water at 0.47%. The forest-and-farmland map also reports only 0.01% forest and 0.15% shrubland. A countywide average therefore describes Arapahoe County as mostly open land, but it can hide how intensely development is clustered in the west. Reading both the percentage and its location is essential here.
Arapahoe County’s Comprehensive Plan provides useful background for that split. It describes the western Urban Area as the part of the county where existing urban-level development is concentrated and where additional urban growth is expected. Outside designated growth areas, the plan emphasizes agricultural resources, open lands, and sensitive areas. The plan is not the same dataset as NLCD, but its regional description helps explain why the land-cover map has such a strong west-to-east contrast.
| 2025 class | County share |
|---|---|
| Grassland | 53.91% |
| Agriculture | 22.12% |
| Developed | 21.40% |
| Wetlands | 1.90% |
| Water | 0.47% |
| Shrubland | 0.15% |
| Forest | 0.01% |
The table is useful for a quick countywide comparison, but it should not replace the map. Developed cover is not spread evenly across 21.40% of every part of the county, and grassland does not appear uniformly across 53.91% of the surface. The western end is far more built up, while the central and eastern sections contain much larger open areas. Classes that appear in the legend without a verified summary percentage are not estimated here.
Grassland is the dominant eastern setting, with agriculture woven through it
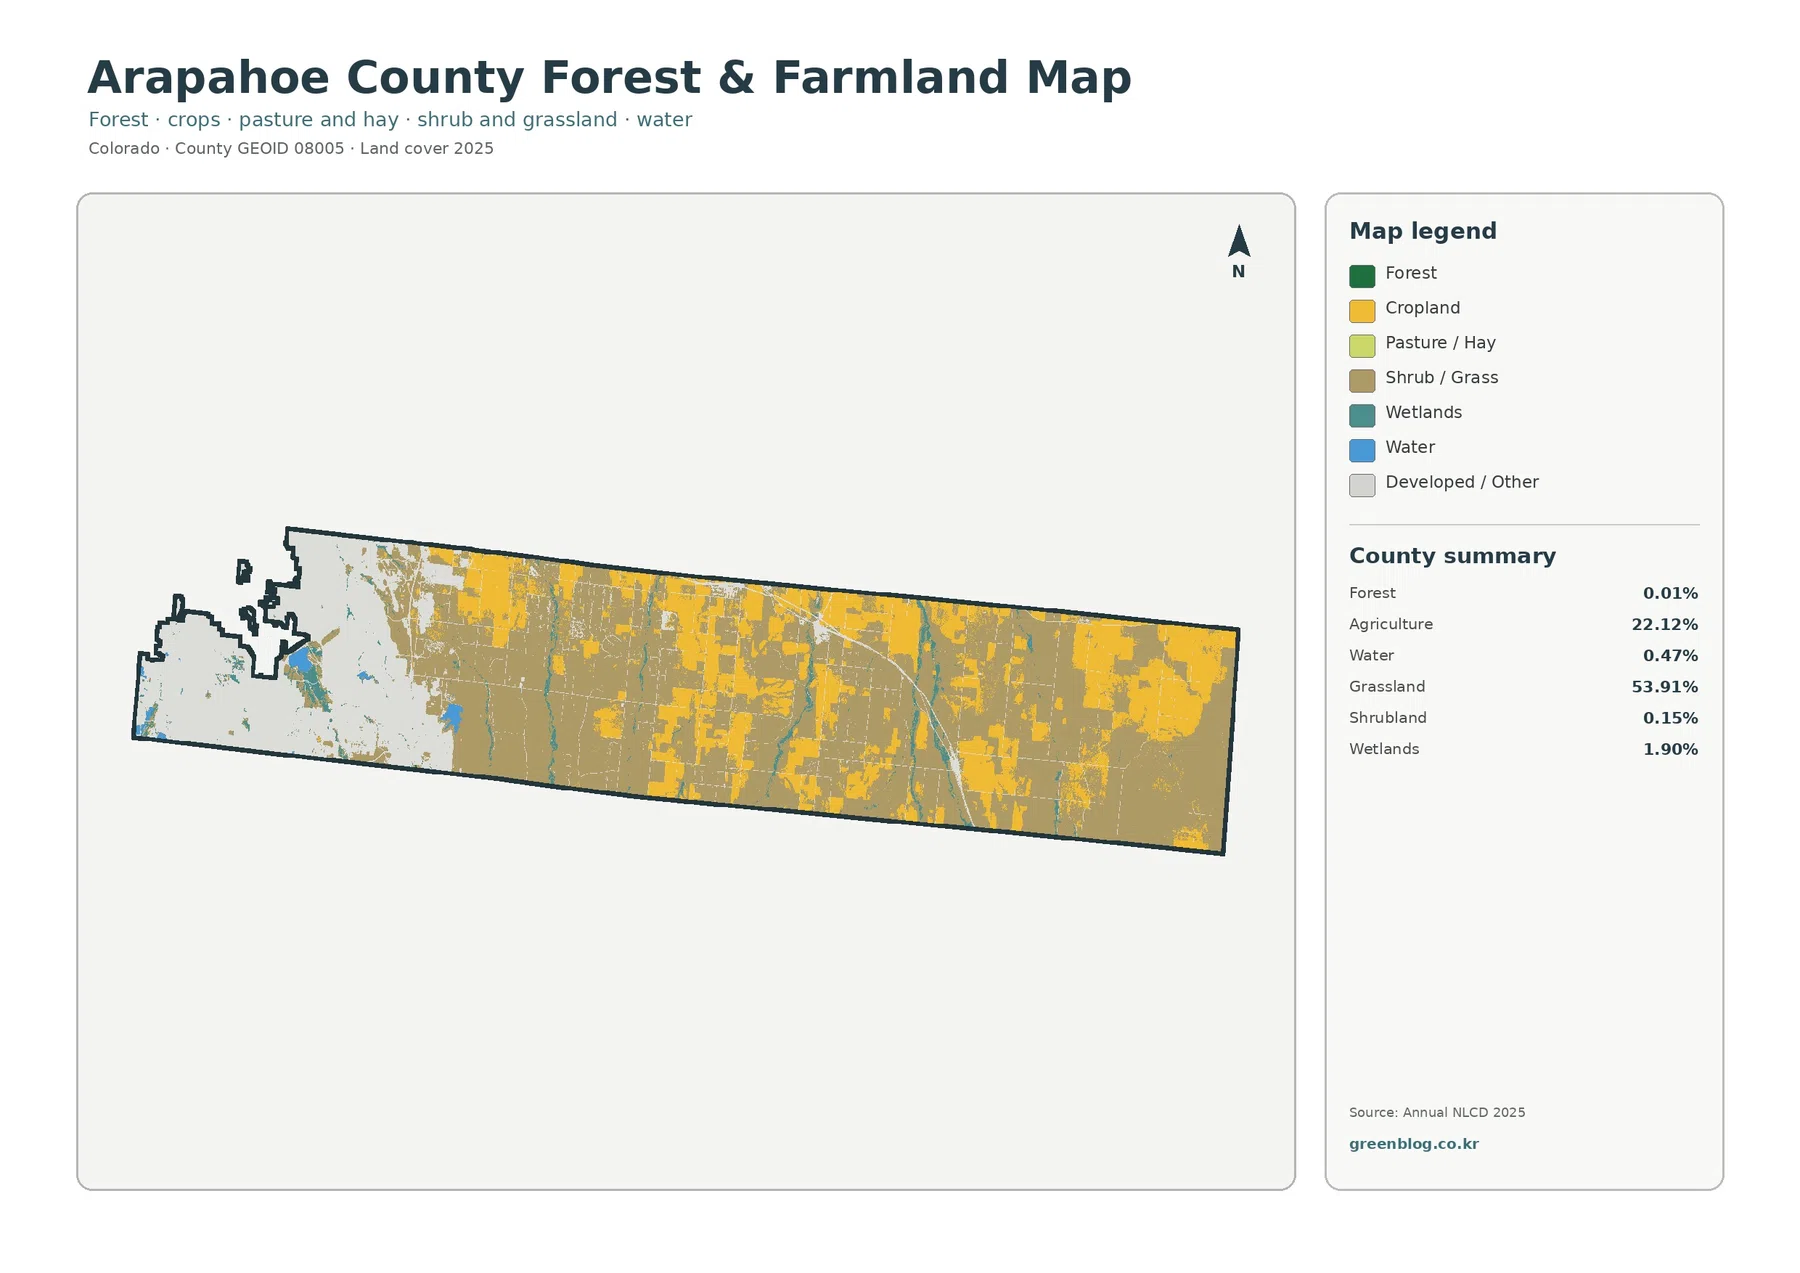
The forest-and-farmland view strips away some of the general-map complexity and makes the eastern pattern easier to follow. Grassland covers the largest continuous areas, and agricultural land appears as many large blocks within that open setting. This is where the 53.91% grassland share becomes visually convincing. Agriculture at 22.12% is also substantial, but it is distributed as a mosaic rather than a single uninterrupted belt.
A county-specific example comes from Arapahoe County Open Spaces. The department describes Bijou Basin Open Space as a roughly 2,800-acre property on the eastern plains with native prairie scenery, while also noting ongoing grazing and agricultural use. That property does not represent every grassland cell on the NLCD map, but it gives a concrete local reference for the broad prairie-and-working-land character visible in the eastern half of the county.
The agricultural polygons often look rectangular because cropland and managed fields follow human land divisions, but the map should not be treated as a parcel layer. A yellow cell means that the surface was classified as agricultural cover for the mapped year; it does not identify the landowner, the crop, a conservation easement, or a legal agricultural designation. Field conditions can also change from year to year with crop rotation, fallow periods, or different vegetation states.
Forest is almost absent in the countywide summary at 0.01%, and shrubland is only 0.15%. That is a striking contrast with Colorado counties in or near the mountains, where forest can dominate the landscape. Arapahoe County’s open natural cover is much more strongly associated with grassland. For classroom comparisons of Colorado geography, this map is a useful example of how an eastern plains county can differ from the forested high country even within the same state.
An 8.83% mean impervious value hides a much harder western surface
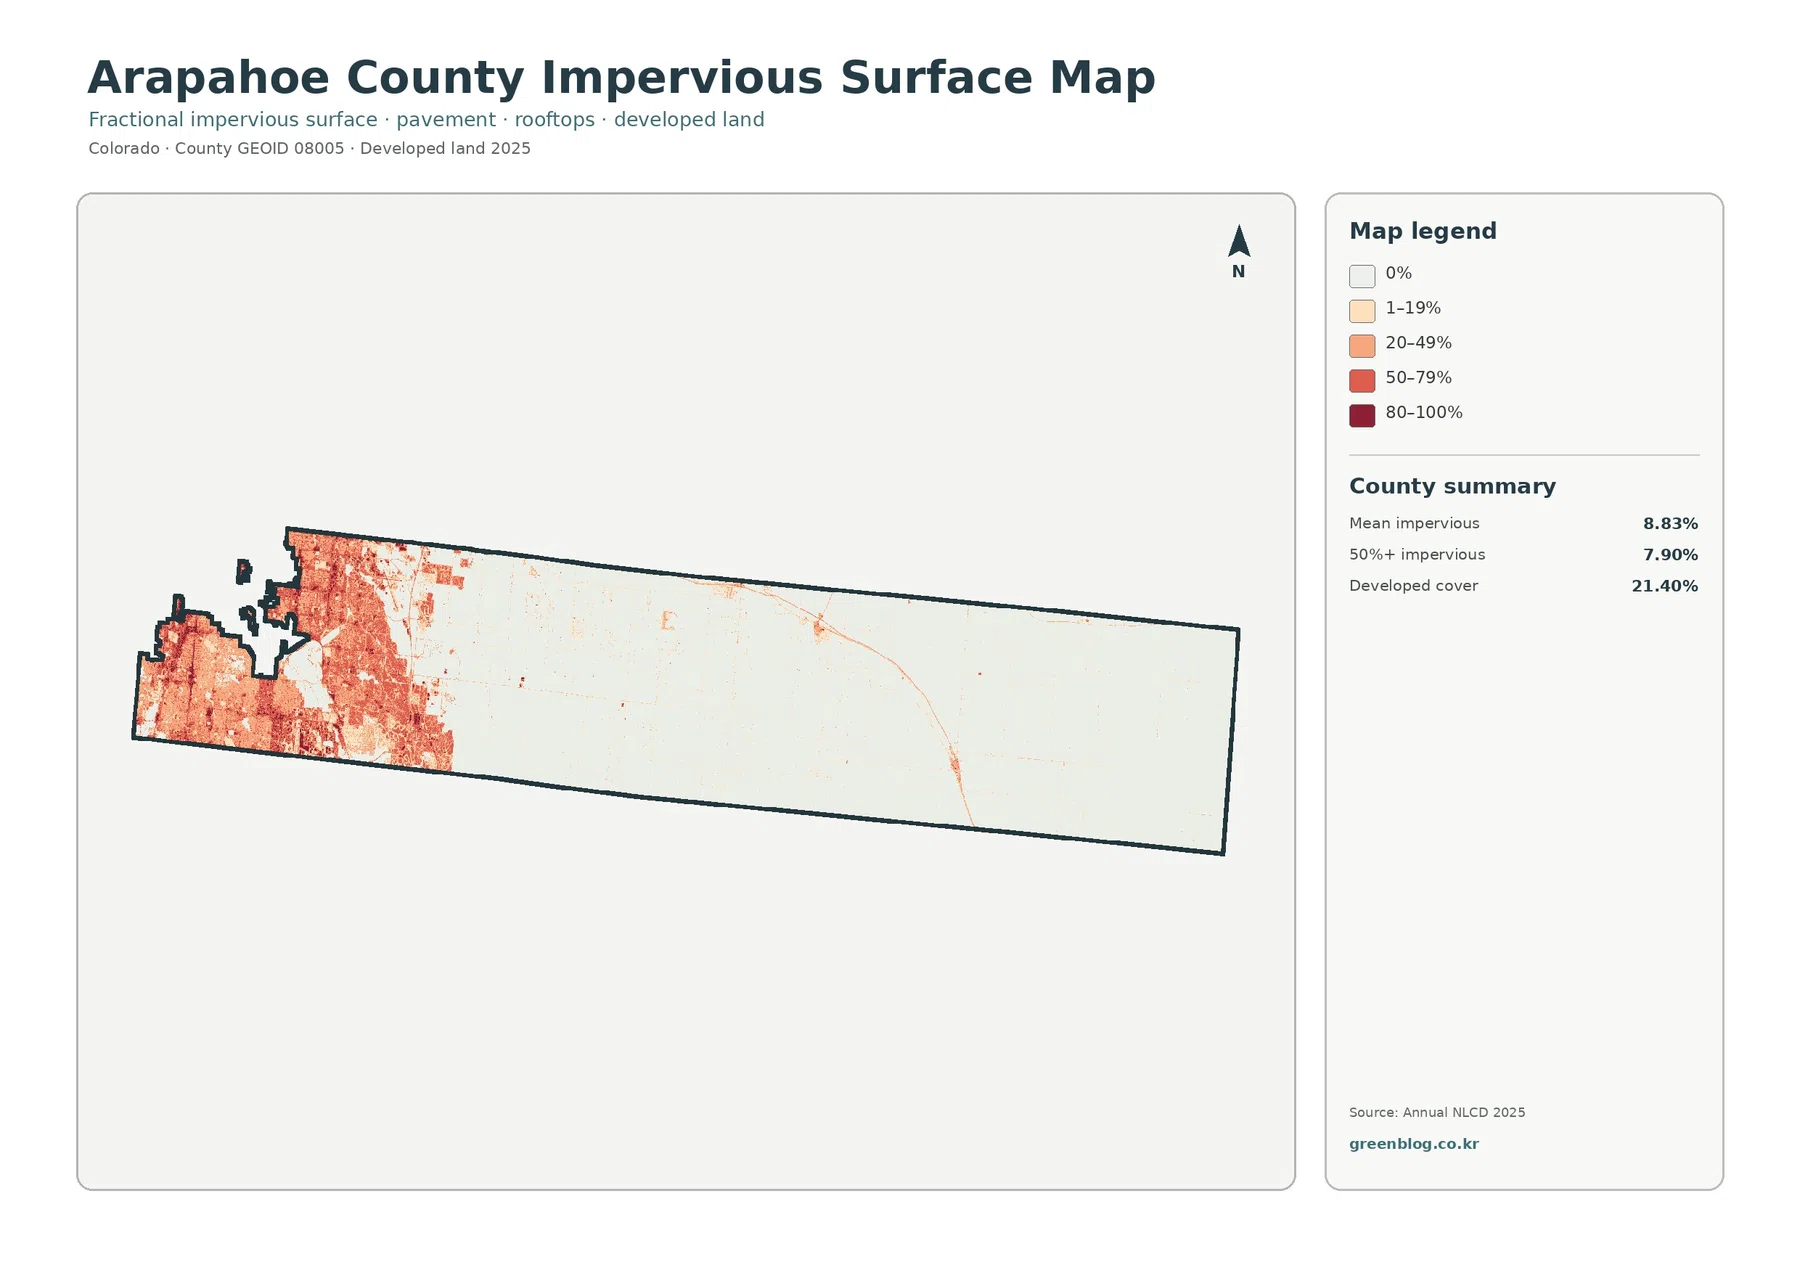
Impervious surface means pavement, rooftops, parking lots, and other surfaces that do not readily absorb water. Arapahoe County’s mean impervious value is 8.83%, while 7.90% of the county is mapped at 50% impervious or higher. Those numbers are not the same as the 21.40% developed-cover share. A developed land-cover class can include lawns, trees, bare ground, and other permeable surfaces around streets and buildings.
The impervious map makes the concentration of built surfaces especially clear. Orange and dark red values occupy much of the western end, where streets and dense development create connected hard-surface patterns. Those colors fade rapidly moving east. Across the central and eastern plains, most of the map is white or very lightly shaded, with roads and isolated facilities appearing as thin lines or small spots. The countywide mean is therefore the result of very high western values combined with very low values across a much larger eastern area.
This pattern is consistent with the county’s planning description of a western urban area and more open land beyond the main growth areas. The planning document and the impervious map answer different questions, so they should not be merged into one classification. Still, they point in the same broad geographic direction: the western part of Arapahoe County contains far more built and paved surface, while the eastern part remains predominantly open.
Impervious cover can be useful when discussing runoff or the physical footprint of urbanization, but it is not a flood-hazard map. Drainage depends on terrain, soils, storm intensity, channels, detention systems, and other factors that are not shown here. For site-level flood or drainage questions, this map should be paired with official hydrologic and hazard information rather than used as a stand-alone conclusion.
Small water and wetland percentages still form visible local corridors
Water accounts for 0.47% of the county and wetlands for 1.90%, both much smaller than grassland, agriculture, or developed cover. Even so, the blue and teal classes are not meaningless. They appear in localized reservoirs, channels, and narrow linear features that cut through other land-cover types. Because those features are concentrated rather than evenly scattered, their local importance can be greater than the countywide percentages suggest.
Arapahoe County’s Open Spaces program provides useful context for why narrow natural corridors matter. The department’s work includes natural and heritage areas, parks, trails, and riparian restoration, and it reports more than 32,500 acres of open space conserved through the program and its partners. That acreage is not an NLCD wetland statistic and should not be compared directly with the 1.90% wetland share. It simply shows that local land management treats natural corridors and open landscapes as more than leftover space.
NLCD wetland cells are also not regulatory wetland boundaries. A raster classification can flag places with wetland-like cover, but legal determinations may depend on field conditions, jurisdiction, hydrology, and agency rules. Anyone evaluating a specific property for permitting or development should use the land-cover map as a screening reference and then consult the appropriate official sources.
The 1985–2025 map highlights where classifications differ, not a simple growth rate
The long-term comparison marks 31.51% of the mapped county as a class difference between 1985 and 2025. Within that total, 7.11% is shown as classified to developed, 19.76% as agricultural loss, and 4.44% as other class difference. Forest loss is reported as 0.00%. Wetland difference appears in the legend, but the summary does not provide a separate verified percentage, so no number is inferred for it.
In the west, red developed-difference areas cluster in and around the same side of the county that now has the strongest developed and impervious patterns. Farther east, yellow agricultural-loss differences are much more widespread and scattered among open areas. Purple other differences appear in smaller patches. The map therefore shows more than one kind of long-term difference: the western urban story is important, but the agricultural and grassland landscape also contains many cells whose classifications do not match between the two dates.
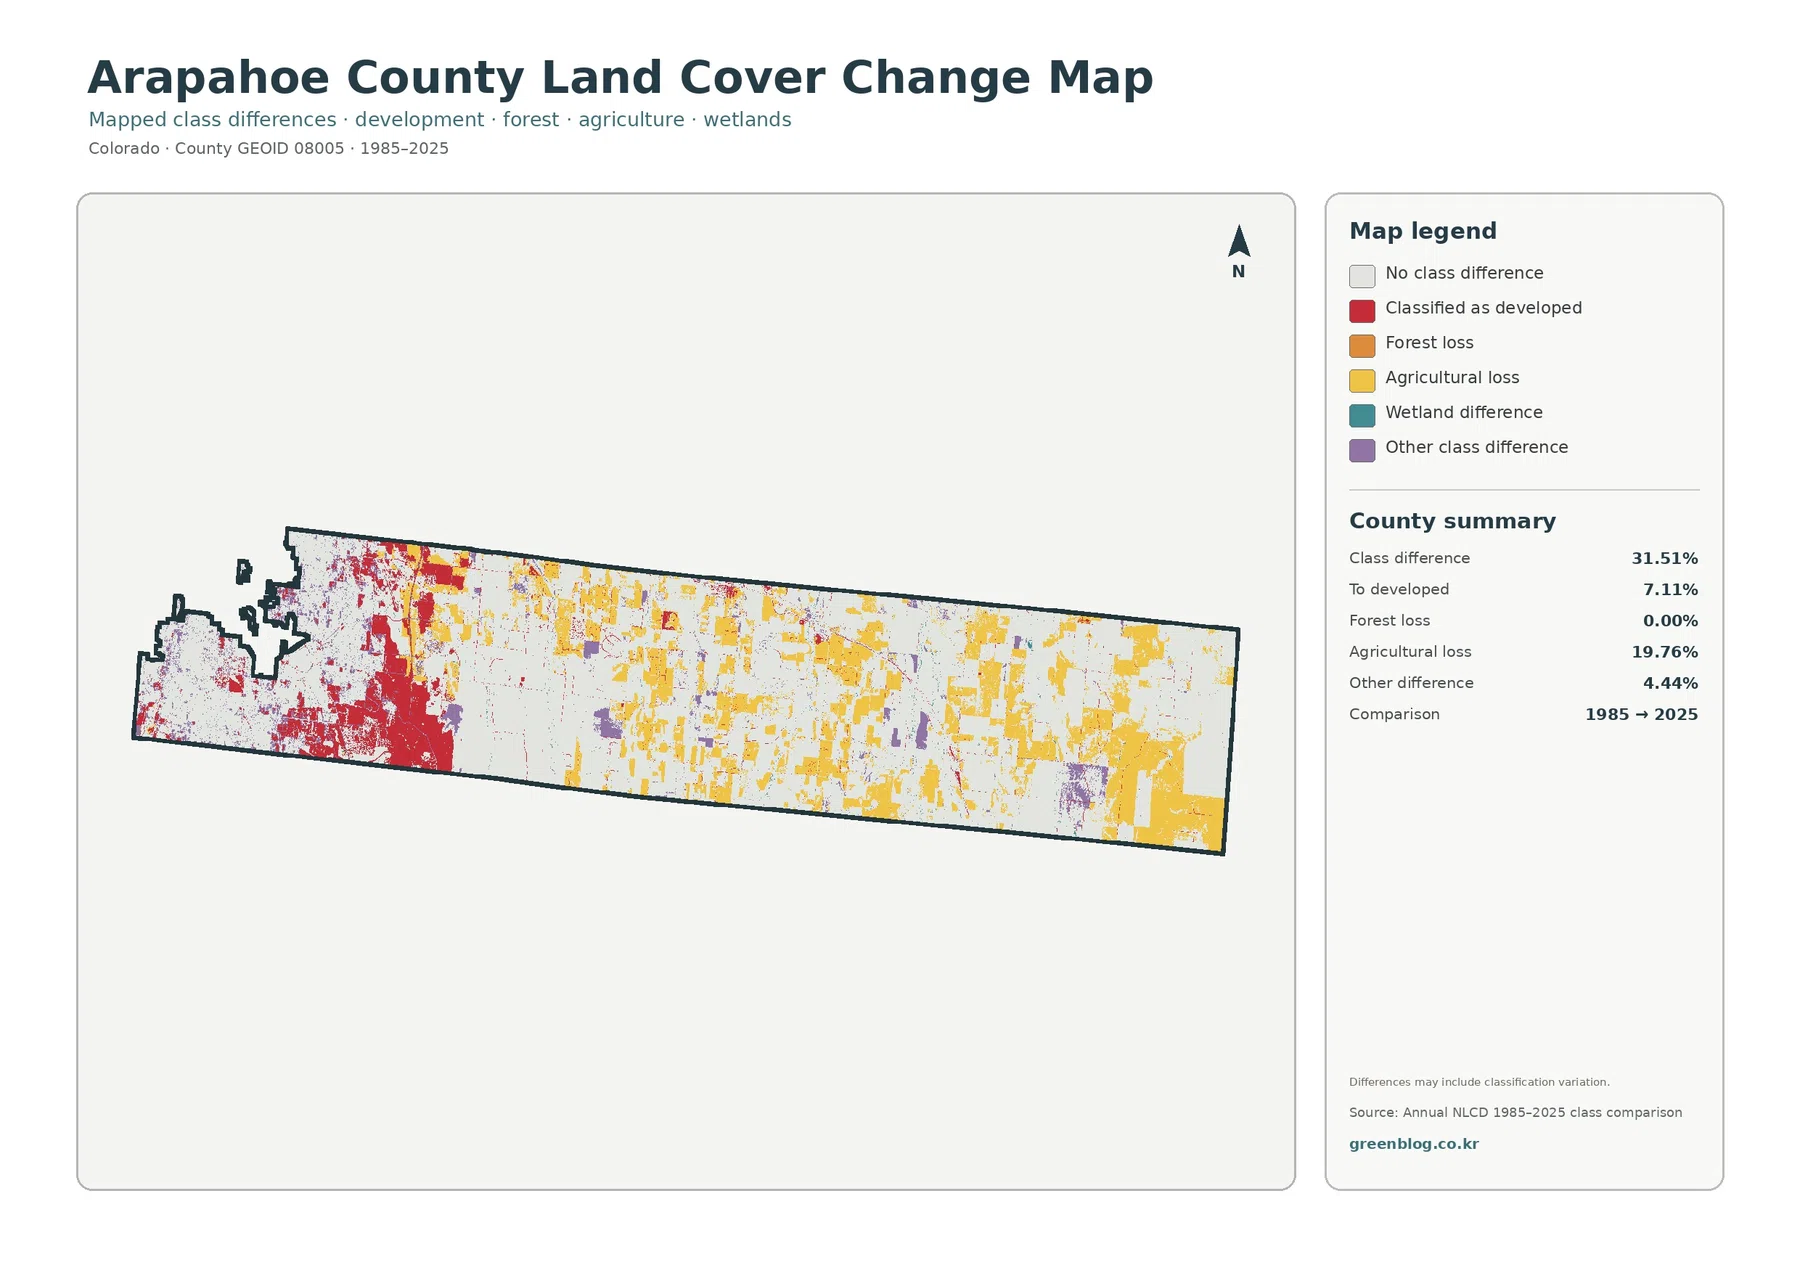
The 31.51% figure should not be quoted as “31.51% of the land physically changed” without qualification. The map itself notes that differences may include classification variation. Imagery from two years can differ because of season, vegetation condition, crop stage, sensor characteristics, processing methods, and classification boundaries. Those effects matter especially in agricultural and grassland settings where surface appearance can change substantially without a permanent land-use conversion.
The 19.76% agricultural-loss category deserves the same caution. It is a class-difference result from this comparison, not an official statement that Arapahoe County permanently lost exactly 19.76% of its farmland. A rigorous farmland trend would require agricultural census data, land-use records, historical imagery, and a consistent method for distinguishing temporary crop conditions from conversion. This map is better used to identify areas that merit a closer look.
Use the four views in sequence to separate present cover from historical difference
For a first look at Arapahoe County, start with the general land-cover map. It gives the clearest overview of the western developed area, eastern grassland, agricultural blocks, and smaller water and wetland classes in one view. The forest-and-farmland map is useful next because it simplifies the open-land side of the county and makes the grassland-agriculture mosaic more obvious.
The impervious map is the best choice when the question is specifically about hard urban surfaces. It distinguishes the western built footprint more sharply than the general developed class. The 1985–2025 difference map should come last and should be compared with the current map rather than interpreted alone. That sequence keeps “what the surface is now” separate from “where the two mapped years differ.”
Together, the maps work well for county overviews, environmental education, regional planning context, presentations, and classroom comparisons. They are not substitutes for parcel surveys, zoning maps, wetland delineations, building-permit records, or ownership data. The scale is countywide and the classifications are generalized, so small roads, narrow channels, field edges, and mixed surfaces can be simplified or absorbed into neighboring classes.
Download the four Arapahoe County land-cover JPG maps
The download ZIP contains one original JPG for each view: general land cover, forest and farmland, impervious surface and developed land, and land-cover change. Each file is 2480×1754 pixels and is kept at the supplied source size. The asset manifest does not mark these files as meeting the package’s A3 high-resolution reference, so large-format printing should be judged by the actual pixel dimensions and the intended viewing distance.
The WebP images in the article are convenient for on-page viewing, while the JPG files are better suited to presentations or documents that need the original supplied dimensions. For a comparison graphic, placing the 2025 cover map next to the 1985–2025 difference map works especially well. Before printing, check whether the legend, small linear water features, and the fine eastern road traces remain readable at the chosen size.
Why the map should not be treated like a parcel survey
Annual NLCD is raster data, which means the surface is divided into grid cells and each cell receives a class or value. That approach is powerful for consistent regional comparison, but it cannot preserve every small feature. In western Arapahoe County, a cell can contain pieces of a street, a lawn, trees, rooftops, and bare ground. In the east, a cell near a field edge can mix crops, a road, grass, and a drainage strip.
Those mixed cells help explain why boundaries can look smoother or less precise than what someone sees on aerial imagery or a property map. The same limitation applies to the change product twice, once for each comparison year. A difference between two classified cells may represent genuine change, a mixed-pixel effect, or a classification shift. The map is therefore strongest for broad patterns and screening, not legal or engineering decisions.
The complex municipal geography in the western county is another reason to use the right tool for the question. Land-cover colors do not show which city has jurisdiction over a neighborhood or parcel. If the goal is to determine an address’s municipal boundary, zoning, or development rules, an official administrative or planning map is required even when the land-cover image clearly shows a developed surface.
Frequently Asked Questions
Why does the county look so urban in the west if grassland covers 53.91%?
Grassland occupies a very large area across the central and eastern plains, while development is concentrated in a much smaller western portion. The western developed and impervious surfaces are visually dense, so they stand out strongly even though open land occupies more of the county overall. The percentage and the location need to be read together.
Does the 31.51% class difference mean that 31.51% of the county was permanently transformed?
No. It means the mapped classifications differ between the 1985 and 2025 comparison layers for 31.51% of the area. The map notes that classification variation can be part of that result. Permanent land-use change requires additional evidence from consistent historical data, records, or imagery.
What files are included in the download?
The ZIP contains four original JPG maps: general land cover, forest and farmland, impervious/developed land, and 1985–2025 land-cover change. Each image is 2480×1754 pixels. Raw GIS layers, parcel boundaries, and source raster datasets are not included.
Map File Information
The download contains four original Arapahoe County land-cover JPG maps in one ZIP file.
- Printable Size: 2480×1754 pixels each
- File Type: four JPG files in one ZIP
Related Maps
Sources and Further Reading
- MRLC Annual NLCD Data – official access to Annual NLCD land-cover and developed-surface products.
- USGS Annual NLCD Land Cover Classification – definitions and documentation for the land-cover classes.
- U.S. Census Bureau TIGER/Line Shapefiles – official county-boundary reference data.
- Arapahoe County Open Spaces – county information on eastern-plains open space, Bijou Basin, grazing, agriculture, and conservation.
- Arapahoe County Comprehensive Plan – county planning context for the western Urban Area and agricultural/open lands outside growth areas.
Green Map creates custom-edited map images using open geographic data sources such as geoBoundaries, Natural Earth, OpenStreetMap, and government open data.
These maps are edited visual materials, not raw data files, and are provided for education, documents, presentations, and graphic reference.