Download the high-resolution A3 JPG ZIP for the Hamilton County Tennessee Map directly from this page; it includes the county, city, water, and elevation maps shown below. Chattanooga is by far the largest city reference, with East Ridge, Red Bank, Signal Mountain, Soddy-Daisy, and Collegedale spread around it in different directions. The Tennessee River curves through the county and opens into several named bays, while high ridges rise quickly west and northwest of the Chattanooga valley.
Hamilton County is unusually easy to recognize once three features are connected: Chattanooga, the Tennessee River, and the mountain ridges west of the city. The urban center occupies lower terrain, but Signal Mountain and Lookout Mountain rise close by, and the northwestern half of the county contains another broad belt of high ground. North toward Soddy-Daisy, the river and creek valleys narrow between those ridges, while the southeastern side around Collegedale and Apison has a different pattern of smaller streams and long, lower ridges.
Table of Contents
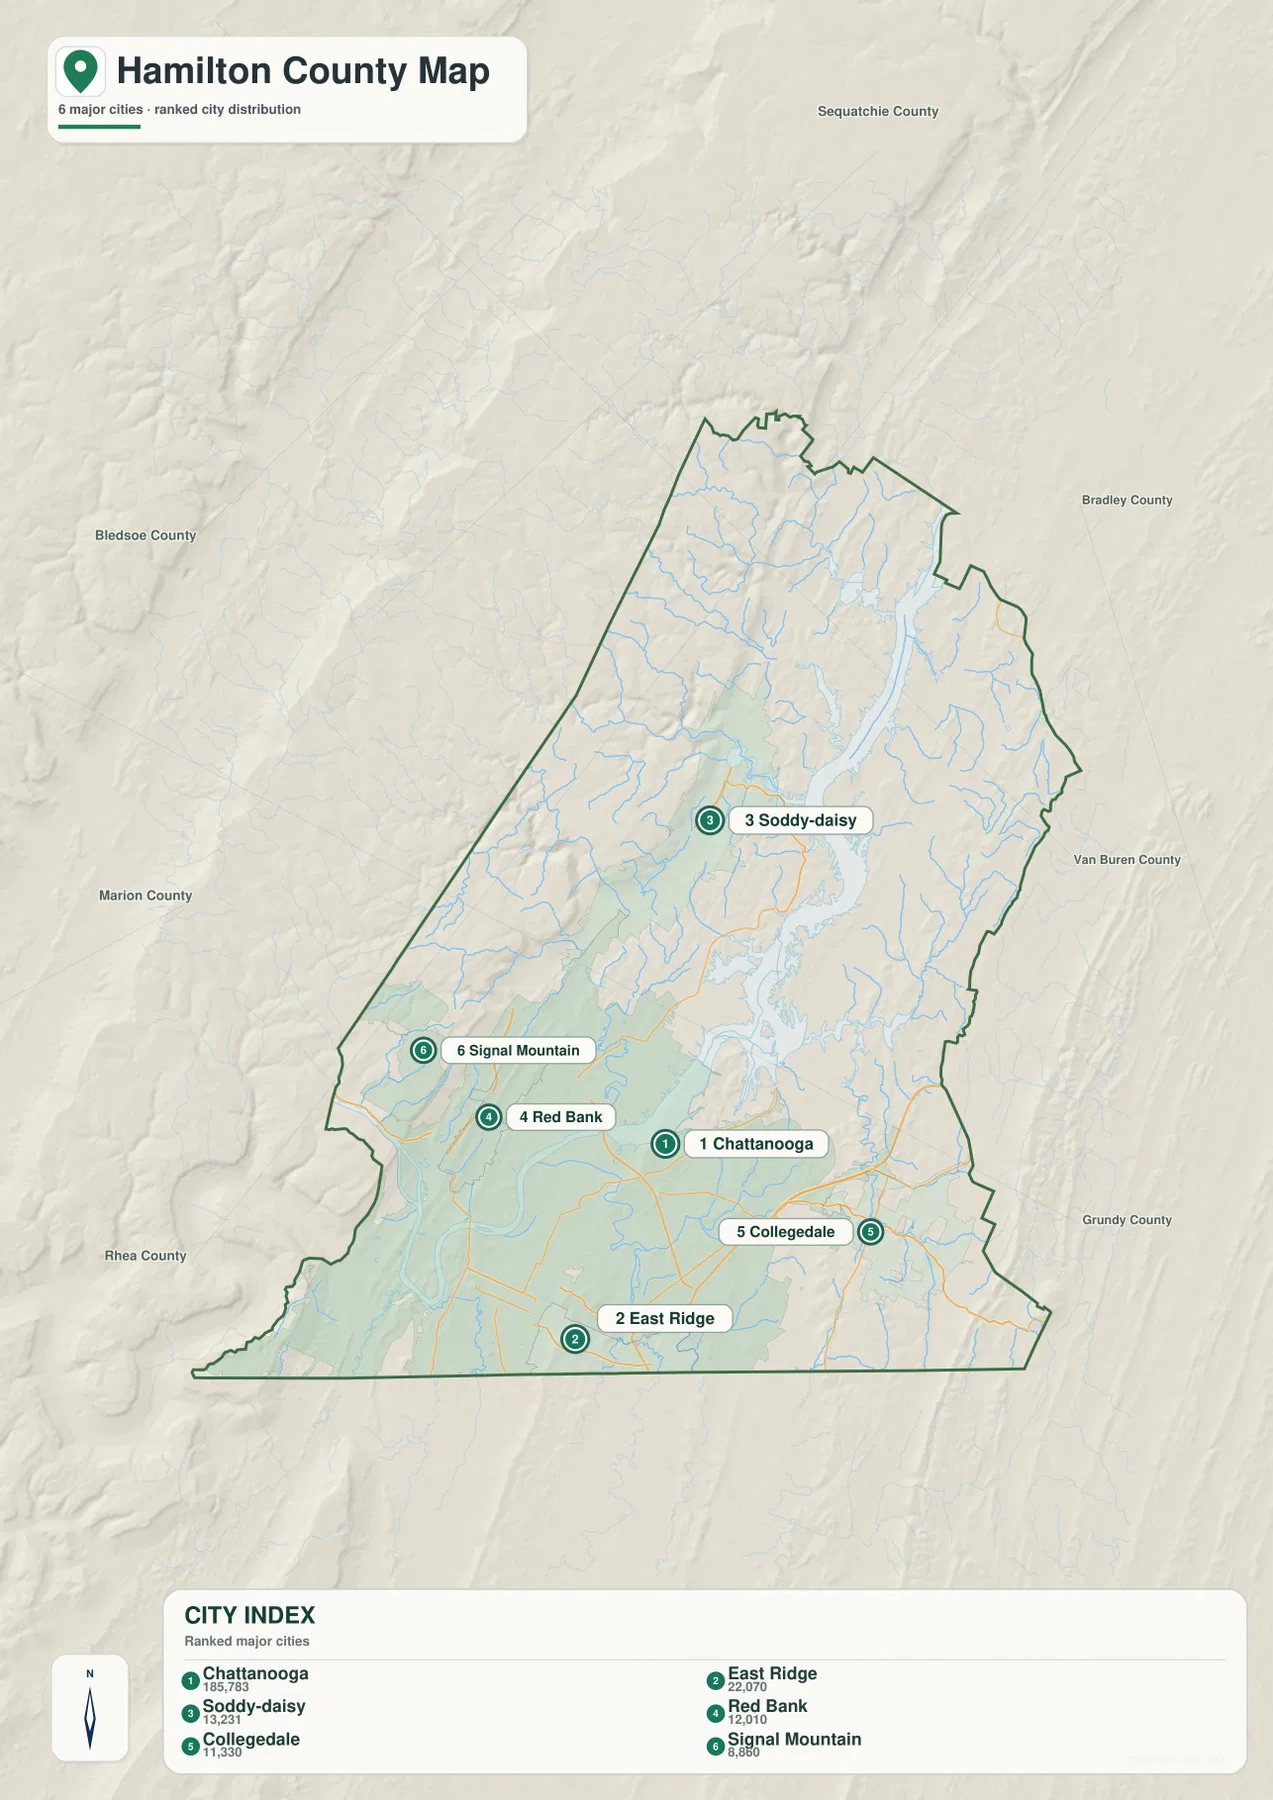
Chattanooga dominates the city ranking, but the outer cities define the county’s directions
The city map ranks Chattanooga at 185,783 residents. East Ridge is second at 22,070, followed by Soddy-Daisy at 13,231, Red Bank at 12,010, Collegedale at 11,330, and Signal Mountain at 8,860. The population gap is large, yet the smaller cities remain important because each marks a different part of the county rather than simply forming one continuous ring around Chattanooga.
East Ridge sits directly south of Chattanooga, while Red Bank is close to the northwestern side of the main urban area. Signal Mountain is farther west on higher ground. Soddy-Daisy provides the strongest city reference in the north-central county near the Tennessee River, and Collegedale anchors the southeast. Those positions make the six ranked cities more useful for orientation than the population numbers alone.
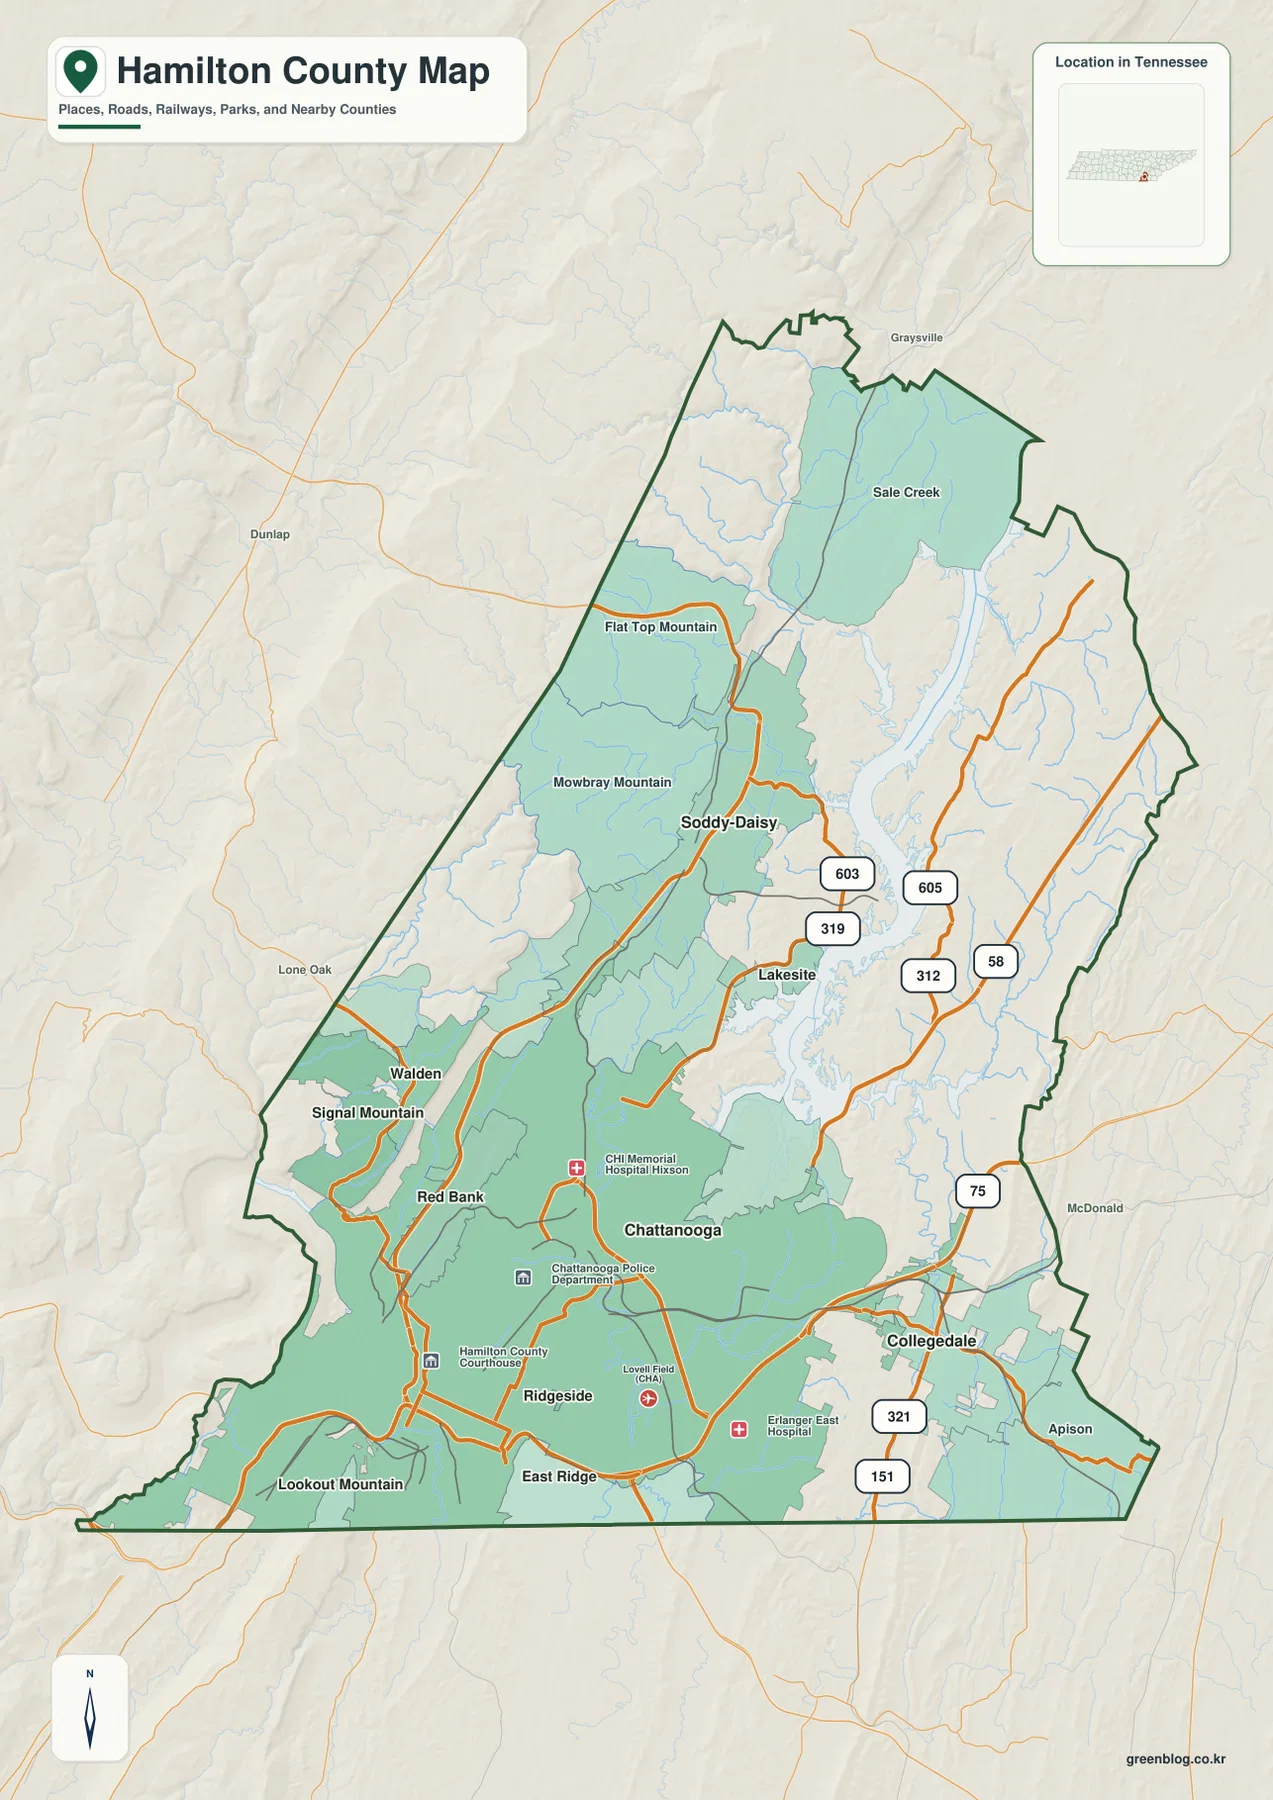
The base map adds more place names that help fill the gaps between those ranked cities. Sale Creek appears in the north, Lakesite near Soddy-Daisy, and Walden on the higher western side. Ridgeside lies south of Chattanooga, while Apison is near the southeastern edge. Flat Top Mountain, Mowbray Mountain, Signal Mountain, and Lookout Mountain also appear as named terrain references, making it clear that settlement and topography are closely interwoven.
Roads leave Chattanooga through river valleys, ridge gaps, and the southeastern corridor
The county map is densest around Chattanooga, where several major roads meet before spreading into the rest of Hamilton County. Route 319 is labeled near Soddy-Daisy, while Routes 603 and 605 appear around the Lakesite side. Routes 312 and 58 are visible farther east, and Routes 75, 321, and 151 provide clear references around Collegedale, Apison, and the southeastern edge.
The western side looks different because roads must work around high ground. Signal Mountain and Walden sit on or near the elevated ridges, while Red Bank and Chattanooga occupy lower terrain to the east. North of them, Flat Top Mountain and Mowbray Mountain create another high belt beside the Tennessee River corridor. Roads near Soddy-Daisy therefore fit into a narrower space between steep slopes, river water, and creek valleys.
The southeast uses a separate set of landmarks. Collegedale and Apison are away from the main river bend, and Routes 75 and 321 become stronger references than the western mountain roads. Smaller streams and long ridges cross this part of the county, so the road network bends around local relief rather than following one simple grid. Comparing the base map with the elevation layer makes those route choices much easier to understand.
Tennessee River bends, bays, and Chickamauga creeks organize the water map
The Tennessee River is the dominant water feature. It enters the county from the north, runs through the central portion, and bends strongly toward Chattanooga before continuing southwest. Jones Bay, Dallas Bay, Harrison Bay, and Savannah Bay are labeled along the broader river water, showing that the shoreline reaches deeply into nearby valleys rather than forming one narrow channel.
Possum Creek and Soddy Creek are the main named streams in the northern half of the water map. Soddy Creek provides a particularly useful reference around the Soddy-Daisy side, where stream valleys meet the Tennessee River corridor. Possum Creek lies farther north and helps define the drainage near the Sale Creek side of the county.
Closer to Chattanooga, North Chickamauga Creek and South Chickamauga Creek follow separate low corridors. North Chickamauga Creek reaches the Dallas Bay side, while South Chickamauga Creek crosses lower ground south and east of the main Chattanooga area. Wolftever Creek and Poe Branch are labeled farther east, adding a distinct drainage pattern around the Collegedale side.
Baylor Lake and Lake Junior are smaller named waters near the western and south-central urban area, and Wolf Pond appears in the eastern half. A practical way to read this map is to begin with the Tennessee River, identify the four named bays, and then add the creek closest to the city or road being studied. That keeps the dense water network understandable without treating every tributary as equally important.
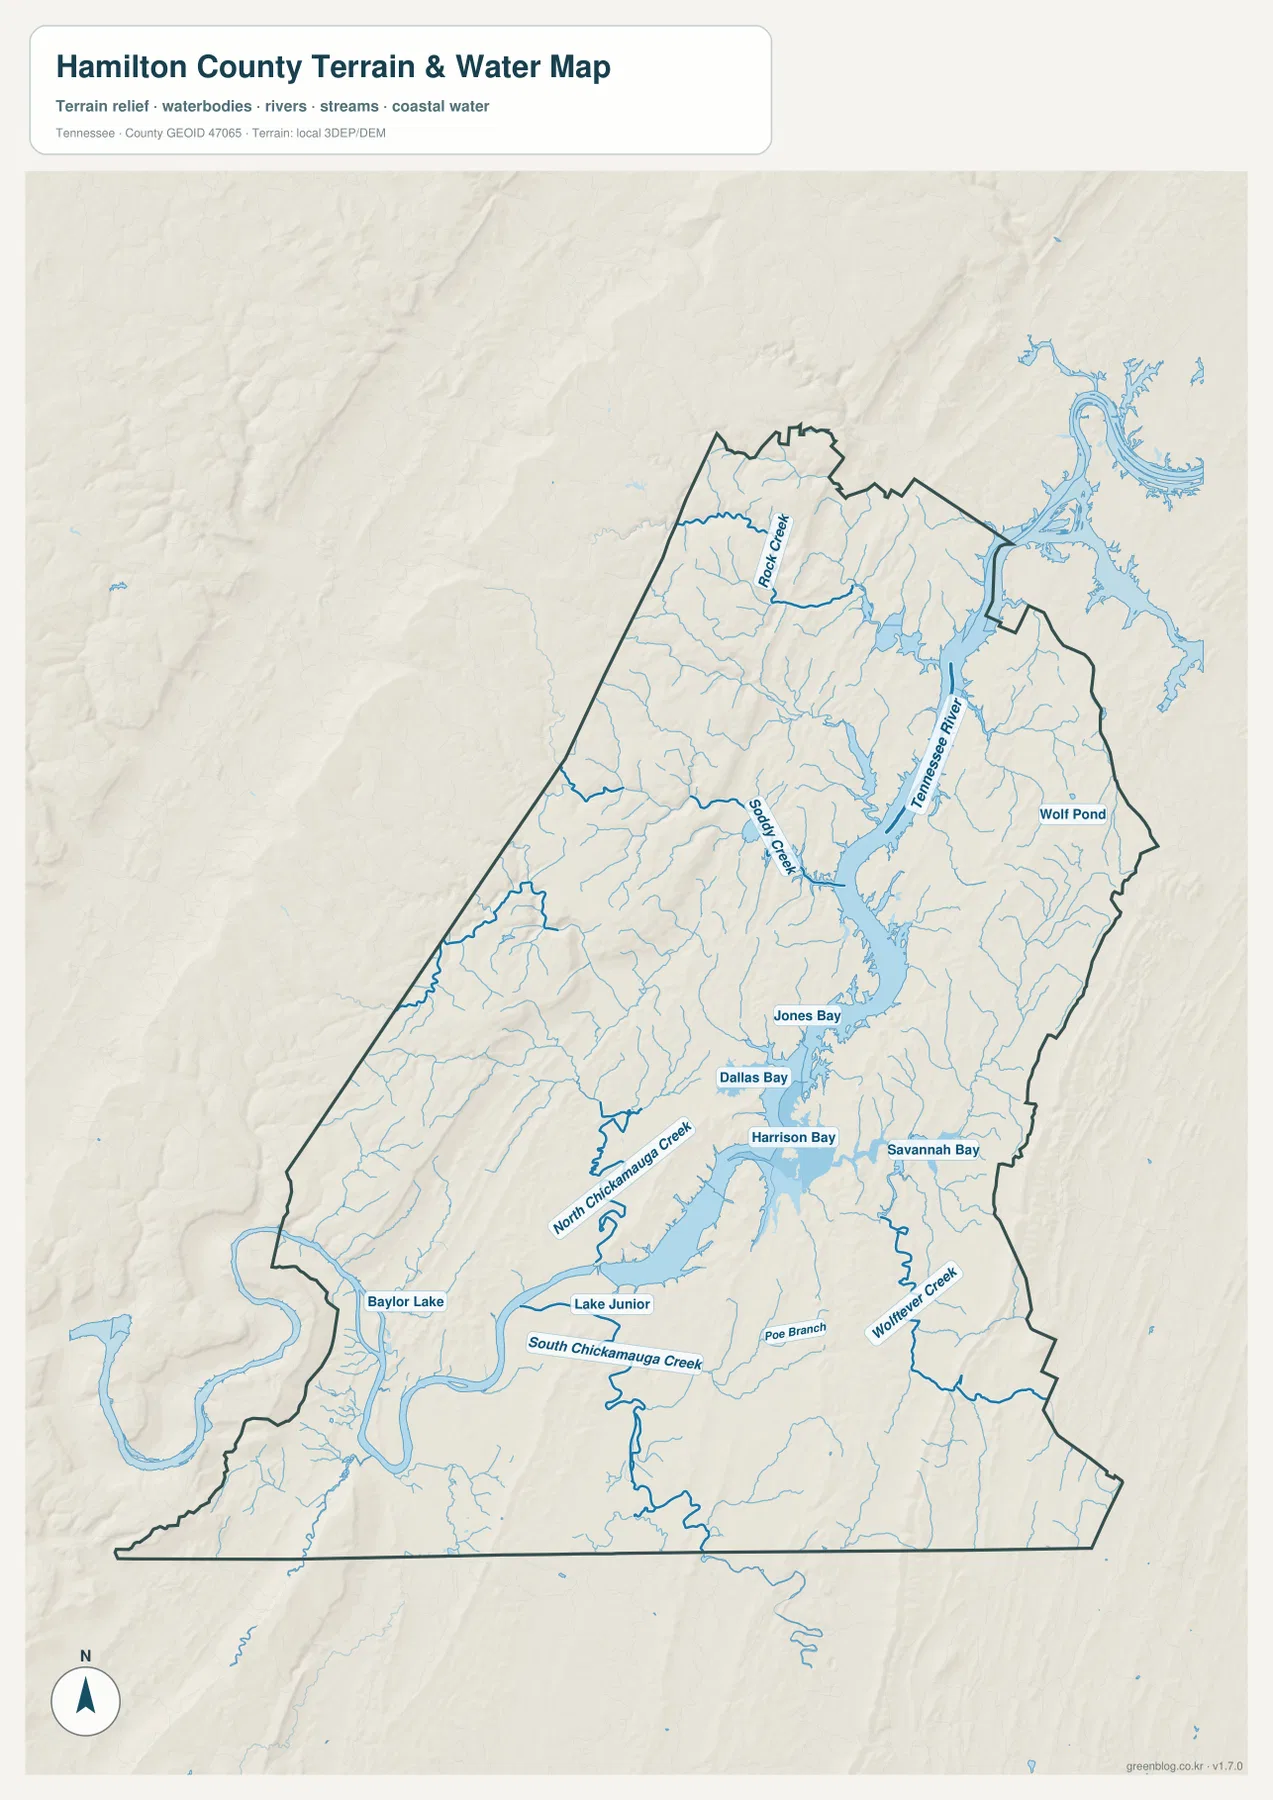
This water layer is intended for geographic reference rather than current water conditions. It does not establish flood limits, boating access, shoreline ownership, or a water level for a particular date. Its main value here is showing where the river, bays, and creek valleys sit in relation to Chattanooga, the outer cities, and the surrounding ridges.
A 136–655 m range separates the Chattanooga valley from western mountain ridges
The elevation map shows an actual range of about 136 to 655 meters, with a mean near 294 meters. Broad green lowland covers much of the Chattanooga and Tennessee River corridor. Moving west and northwest, the colors change quickly into tan and brown across the high ridges around Signal Mountain, Lookout Mountain, Flat Top Mountain, and Mowbray Mountain.
The northwestern high ground is especially extensive. Creek valleys cut narrow green lines into the brown terrain, and the surface drops sharply toward the Tennessee River side. This helps explain why the Sale Creek and Soddy-Daisy areas are not simply flat river country: they sit beside strong relief, with water and roads using the lower passages between ridges.
Eastern Hamilton County is lower overall than the broad western mountain belt, but it still contains many long narrow ridges. Around Collegedale and Apison, lower creek valleys alternate with raised terrain. South of Chattanooga, East Ridge appears close to the urban area, while Lookout Mountain creates another abrupt high feature near the southwestern edge.
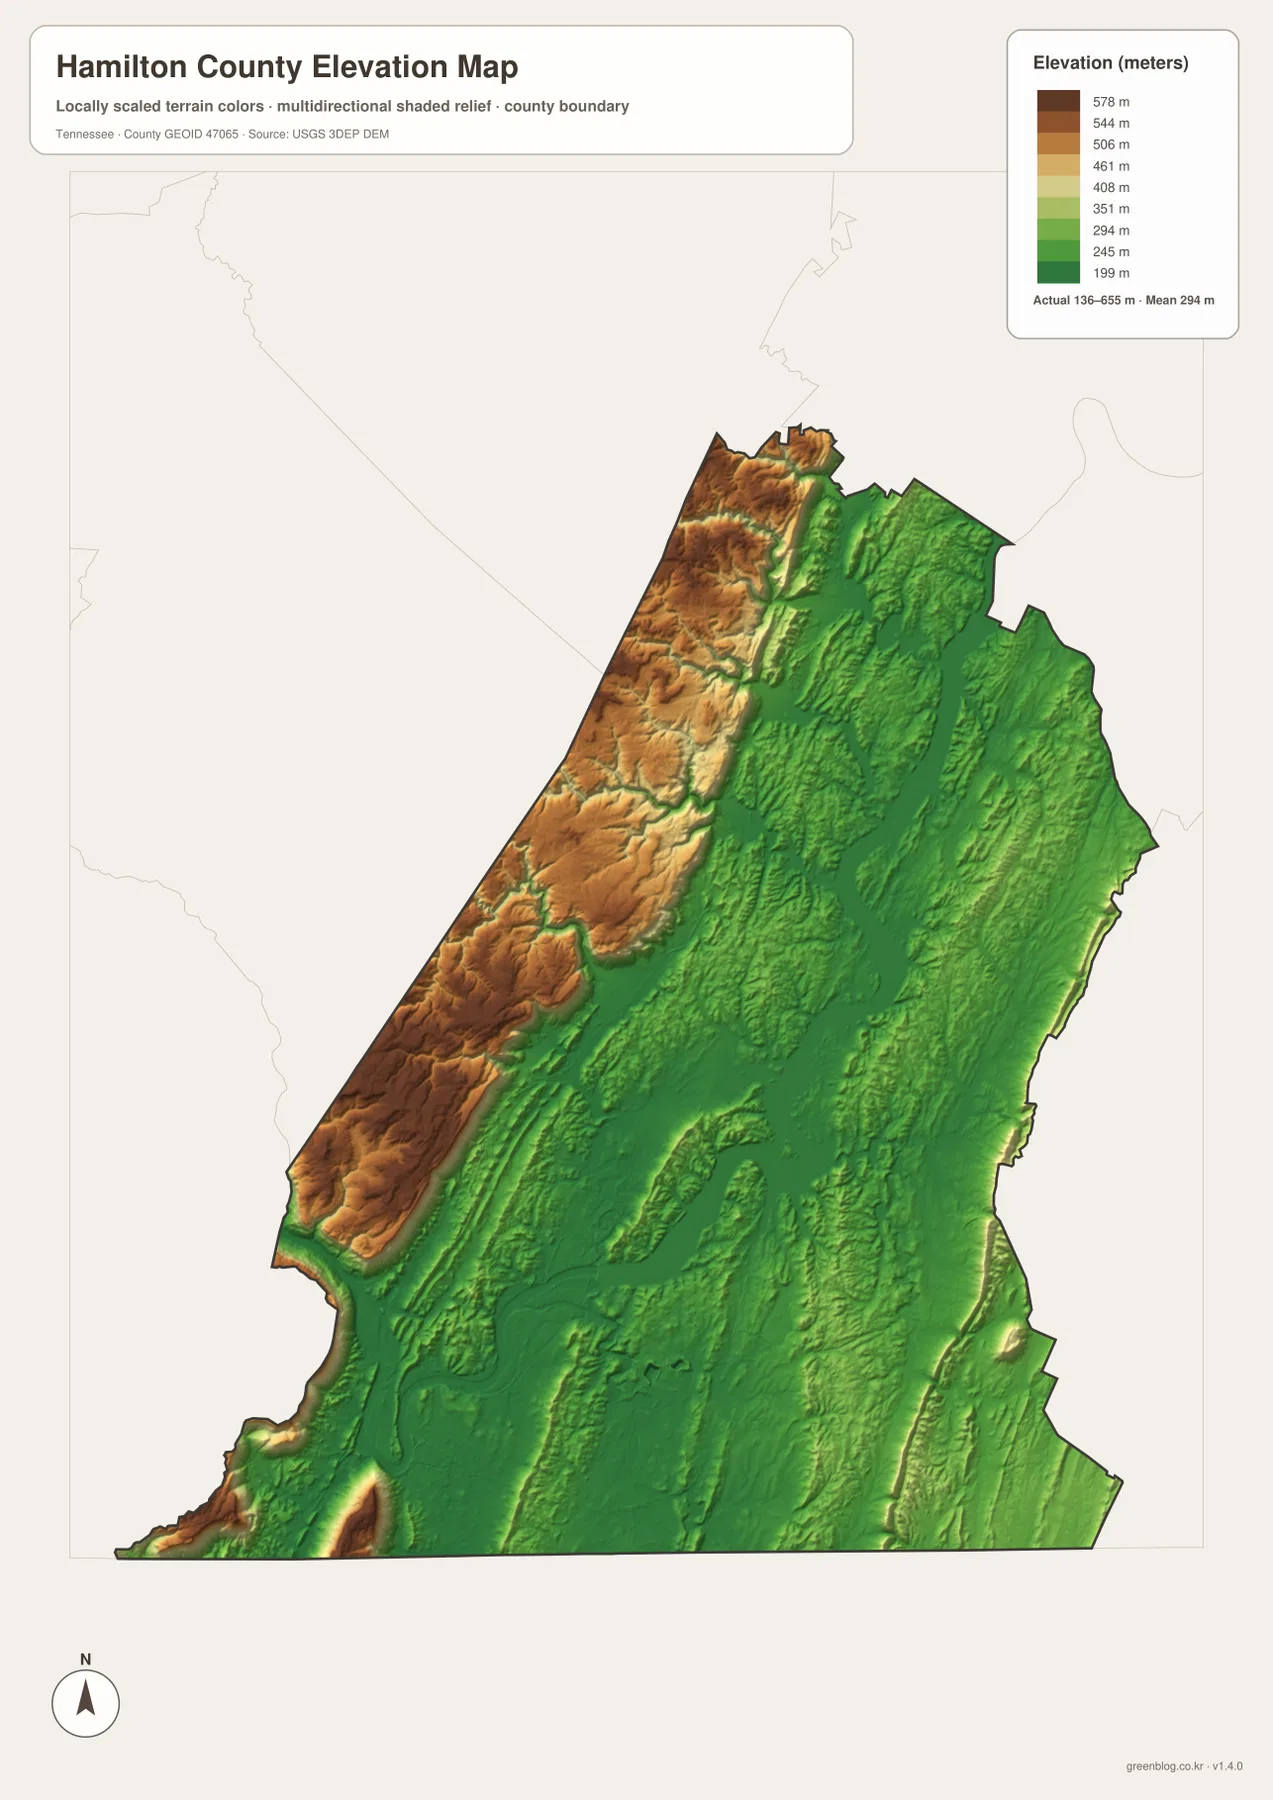
The colors are intended for relative terrain comparison across the county, not for a survey-grade elevation at a specific property. They are useful for explaining why the river and creeks occupy broad green corridors and why mountain-side roads bend around steep ground instead of crossing the ridges directly.
Chattanooga, the Tennessee River, and the ridges create several different map-reading zones
The city map first establishes Chattanooga as the dominant population center and uses East Ridge, Red Bank, Signal Mountain, Soddy-Daisy, and Collegedale to divide the county into recognizable directions. The county map then adds the roads and smaller communities, while the water map shows that the Tennessee River and its bays form a second set of boundaries through the same urban and suburban area.
Adding elevation explains why nearby places can have very different surroundings. Red Bank remains close to the lower Chattanooga valley, but Signal Mountain rises sharply to the west. Soddy-Daisy sits between the Tennessee River and higher terrain, while Collegedale and Apison are influenced more by smaller creeks and eastern ridges than by the main river bend. The county therefore changes quickly over short distances despite Chattanooga’s large urban footprint.
Choose the map according to the question. The city map is cleanest for comparing the six ranked cities. The base map is better for road numbers and smaller places, the water map is best for the Tennessee River, named bays, and creek systems, and the elevation map makes the valley-versus-mountain contrast easiest to see.
The WebP images in the article are convenient for quick viewing, while the JPG originals in the ZIP are better for printing, enlargement, and offline reference. For route notes, use the county map and mark only Chattanooga, the destination, and the roads needed. Keep river, bay, and creek labels on the water map so they do not cover the road network.
The elevation image is especially useful in color because the low Chattanooga valley and high Signal Mountain–Lookout Mountain side are separated by strong terrain shading. A3 output also provides more room for labels such as Dallas Bay, Harrison Bay, Savannah Bay, Soddy Creek, and the smaller route numbers than the browser preview.
The downloadable ZIP contains the high-resolution A3 JPG originals for the county, city, water, and elevation maps shown on this page. They can be used for classroom comparison, presentations, route notes, regional study, or personal offline storage when a larger image is more useful than the web preview.
Frequently Asked Questions
How are Chattanooga and the other ranked cities shown on the map?
The city map ranks Chattanooga at 185,783, East Ridge at 22,070, Soddy-Daisy at 13,231, Red Bank at 12,010, Collegedale at 11,330, and Signal Mountain at 8,860. Chattanooga is much larger, but the outer cities are useful for identifying the south, north, west, and southeast parts of the county.
How large is the elevation difference between the Tennessee River corridor and the mountain side?
The elevation map shows roughly 136–655 meters. Chattanooga and the Tennessee River occupy broad lower terrain, while Signal Mountain, Lookout Mountain, and the northwestern ridges rise much higher within a short horizontal distance.
Sources and reference data
County boundaries and general location can be compared with U.S. Census Bureau TIGER/Line. Local history and county reference material are available from the Tennessee State Library and Archives Hamilton County fact sheet, and regional geology can be compared with the Tennessee government geology reference.
For broader hydrography reference, see USGS National Hydrography. Elevation data can be compared with the USGS 3D Elevation Program. The descriptions on this page are based on the cities, roads, water features, and elevation patterns visible in the supplied Hamilton County maps.
Map File Information
Download the high-resolution A3 JPG originals for the Hamilton County county, city, water, and elevation maps shown in this article.
- Included Files: County map, city map, water map, elevation map
- File Type: ZIP containing 4 JPG files
Related Maps
Green Map creates custom-edited map images using open geographic data sources such as geoBoundaries, Natural Earth, OpenStreetMap, and government open data. These maps are edited visual materials, not raw data files, and are provided for education, documents, presentations, and graphic reference.