Download the high-resolution A3 JPG ZIP for the Hamblen County Map directly from this page; it includes the county, city, water, and elevation maps shown below. Morristown is the only ranked major city on the city map, while the base map adds Russellville and Whitesburg farther east. A broad reservoir shoreline enters the county from the northwest and north, and long ridges cross the interior, creating a strong contrast between low water-side valleys and higher central ground.
Hamblen County is easiest to read from Morristown outward. West and northwest lead toward the deeply indented reservoir edge, east follows the Russellville–Whitesburg side, and south reaches I-81 near the county boundary. The elevation map adds the missing explanation for those patterns: ridges run through the county in long bands, while creeks and road corridors occupy lower gaps between them.
Table of Contents
Morristown is the main city anchor, with Russellville and Whitesburg extending the map eastward
The city map ranks only one major city in Hamblen County: Morristown at 31,527 residents. That makes the city layer unusually simple compared with counties that contain several ranked municipalities. Morristown sits slightly west of the county’s center and works well as the first reference for roads, nearby counties, and the transition from the reservoir side to the ridge-filled interior.
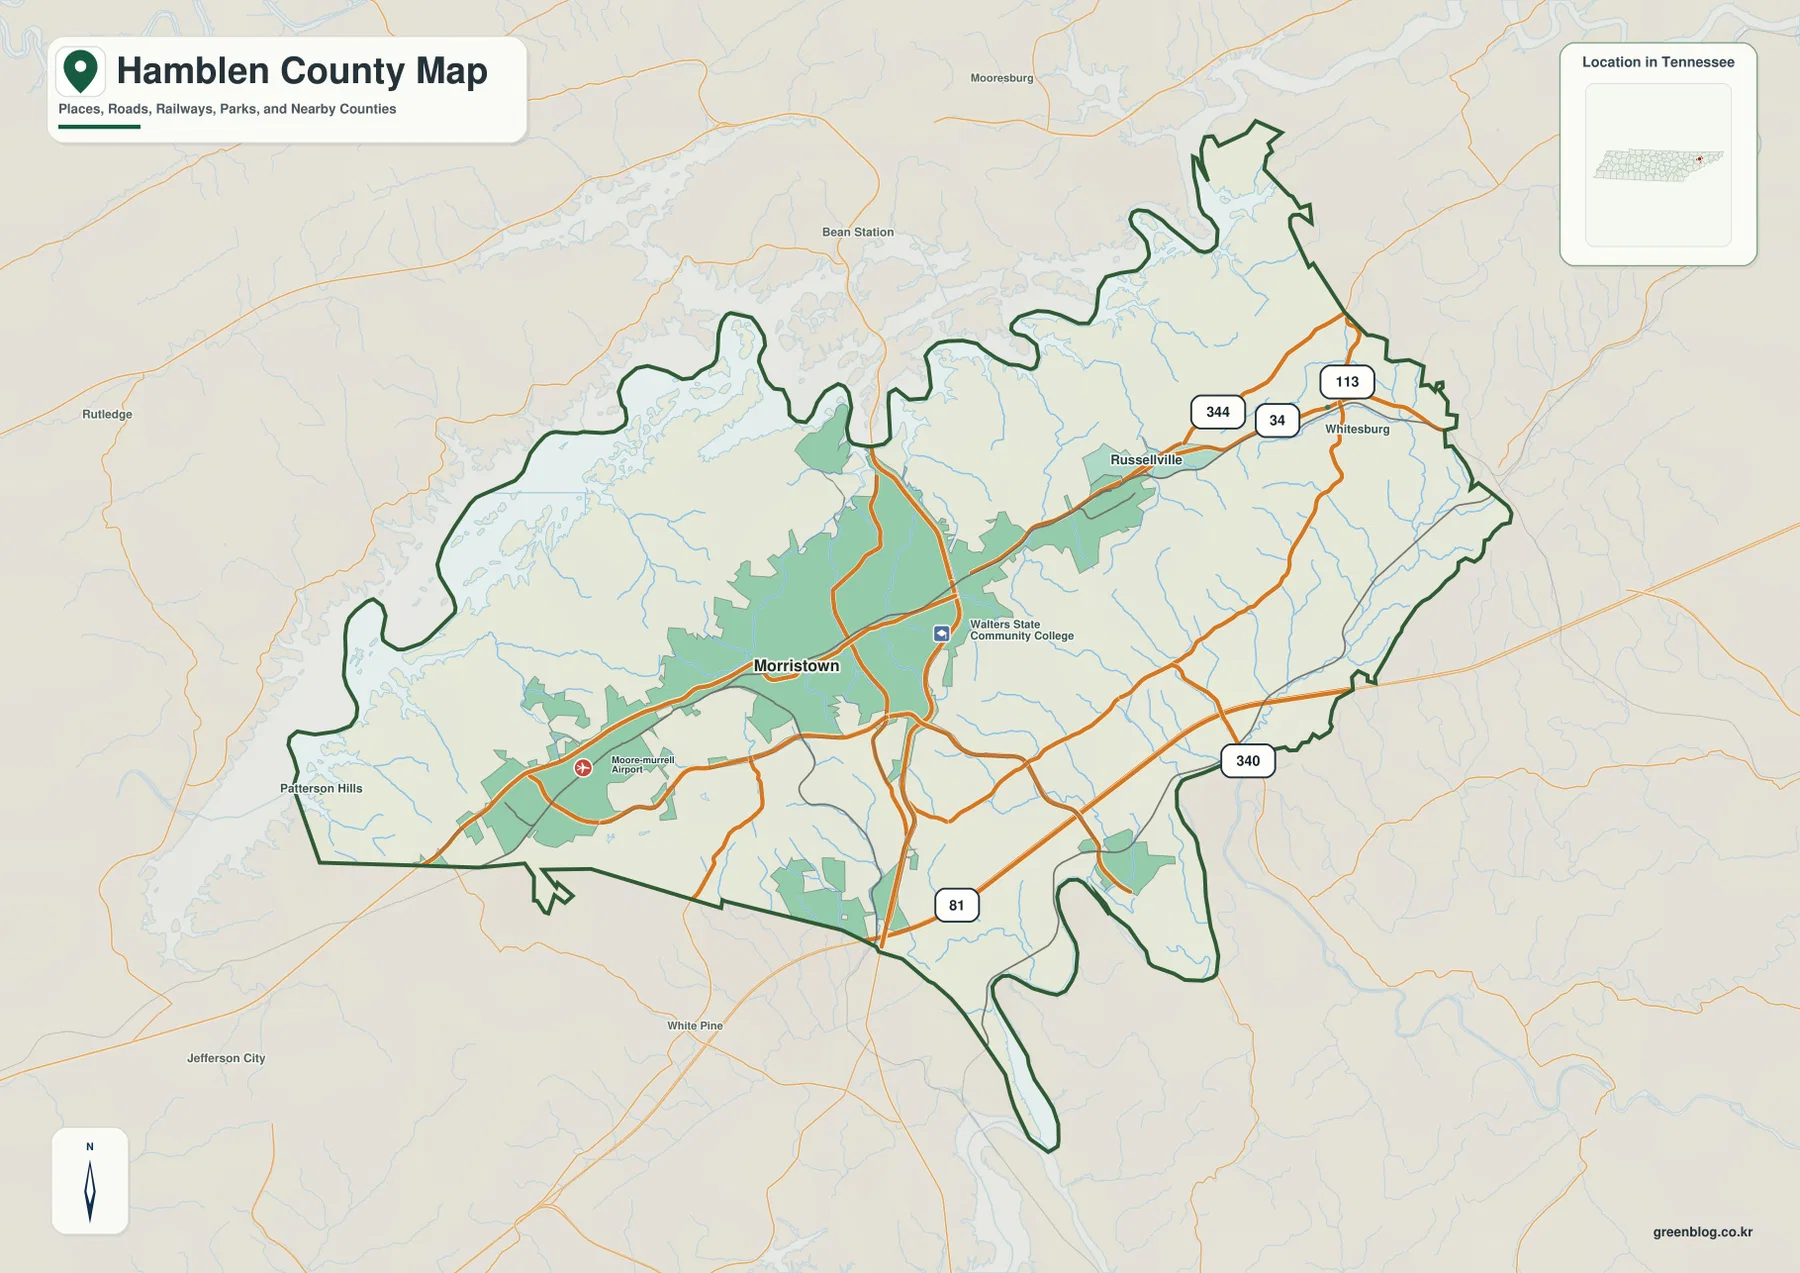
The base map adds Russellville to the east of Morristown and Whitesburg farther east. Those labels form a useful east–west sequence across the county. Walters State Community College is marked near the central road network, and Moore-Murrell Airport appears southwest of Morristown, giving the map two additional local reference points around the main urban area.
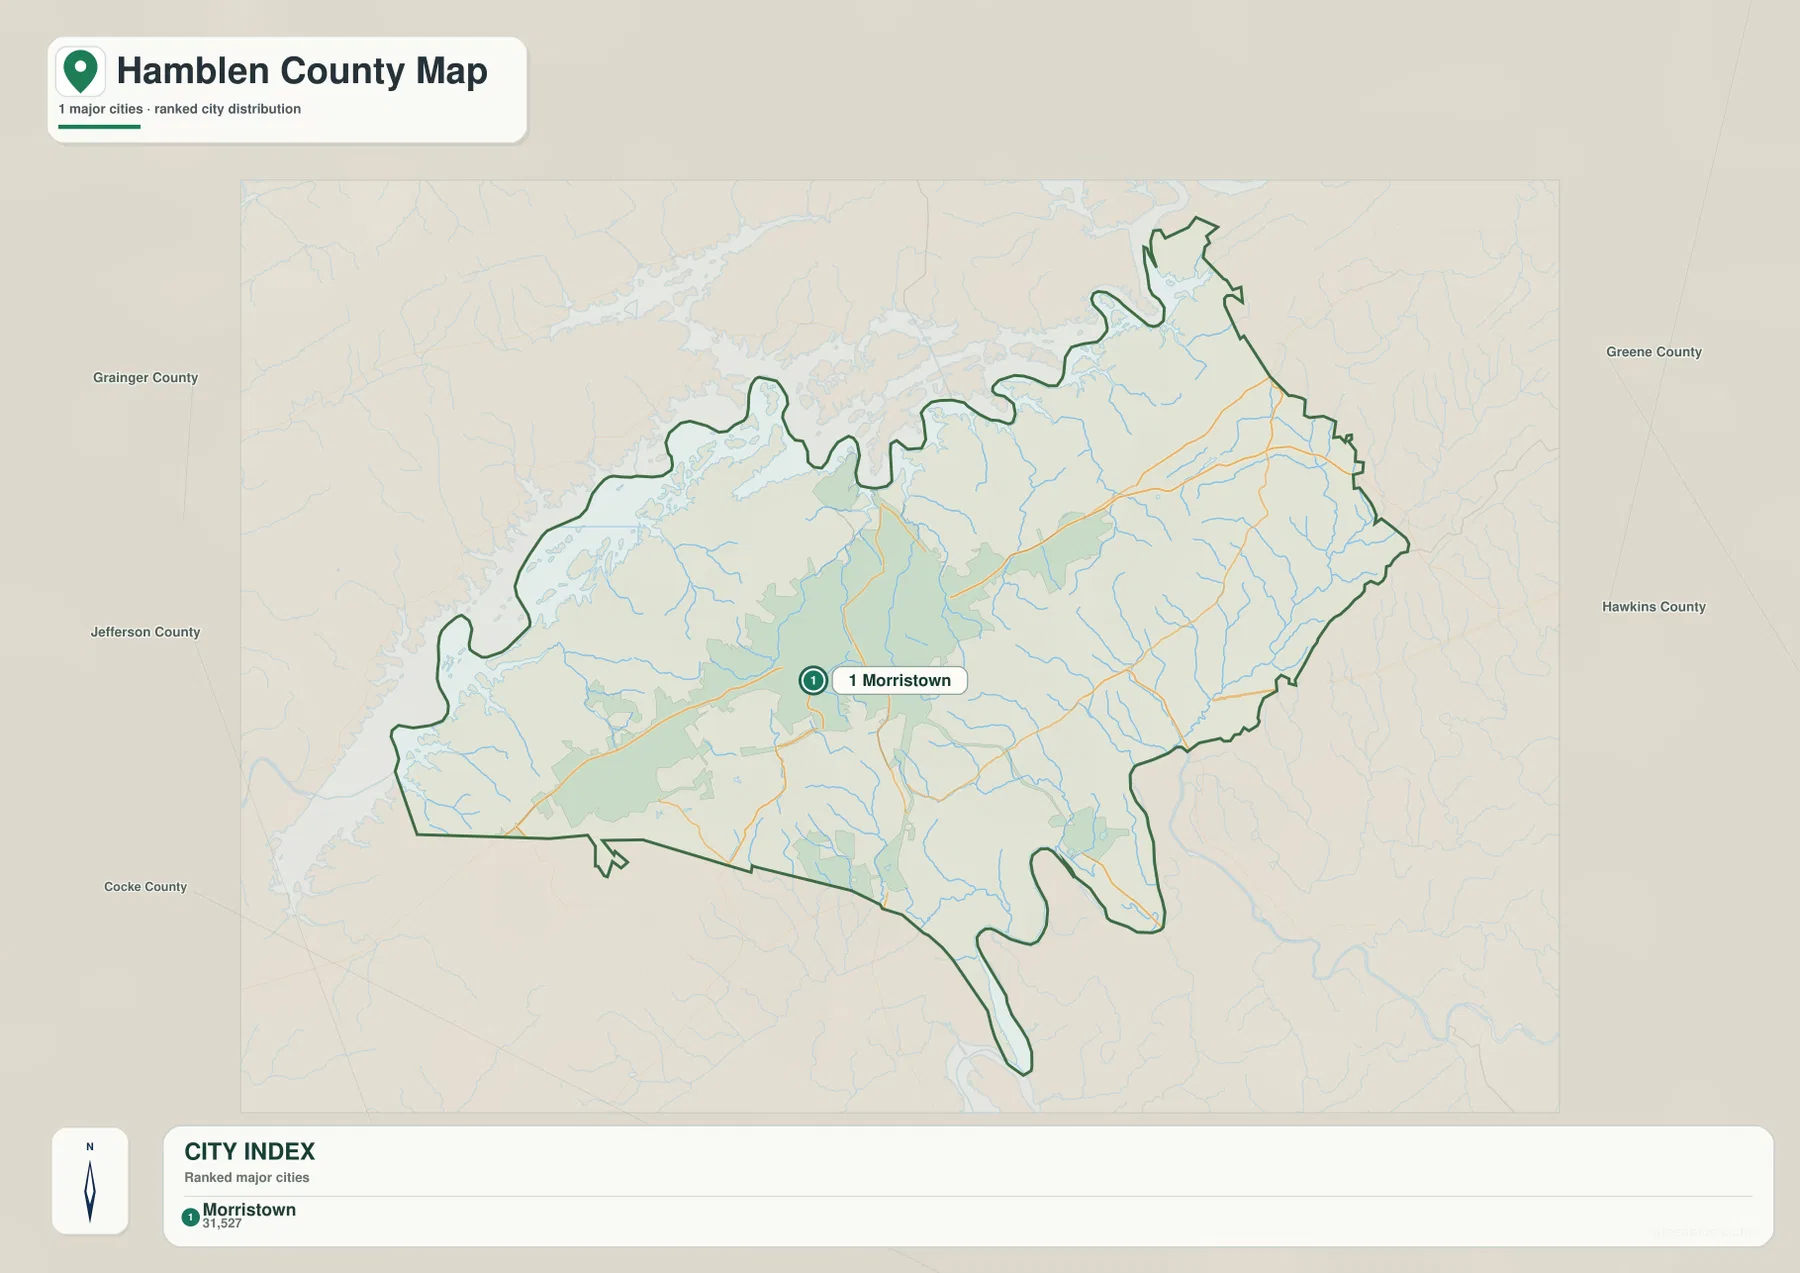
The surrounding labels include Jefferson County to the west, Grainger County to the northwest, Greene and Hawkins counties to the east, and Cocke County to the south. These outside references help explain why the county outline is so irregular along its northern and eastern sides. Morristown remains the clearest internal anchor, while Russellville and Whitesburg are better for reading the eastern road corridor.
Roads spread east from Morristown and south toward I-81
The base map labels Route 34 across the Morristown–Russellville–Whitesburg side of the county. Route 344 appears around Russellville, Route 113 is visible in the northeast, and Route 340 serves the southeastern side. I-81 crosses close to the southern boundary and provides the clearest large-scale travel corridor on the map.
The road pattern changes by direction. South of Morristown, several roads converge toward the I-81 side, while the eastern half has longer corridors passing through Russellville and Whitesburg. None of these lines crosses a perfectly flat surface. The elevation layer shows parallel ridges and lower gaps that explain why roads bend, merge, or follow particular valleys instead of running straight across the county.
The northwestern side has fewer prominent road labels because the reservoir shoreline and steeply broken terrain occupy much of the edge. For quick orientation, Morristown and I-81 work best on the southern side, while Russellville, Whitesburg, and Routes 34, 344, and 113 are more useful in the east. That division keeps the base map readable without treating every road as equally important.
Reservoir arms and named creeks fill the gaps between the ridges
The water map is dominated by the broad reservoir shoreline along the northwest and north. Long arms of water reach into valleys along the county boundary, creating a much more complex edge than the southern side. Panther Lake appears in the west, while Mayes Lake and Masengill Lake provide smaller named water references closer to the central-western interior.
Several creeks run through the ridge-and-valley terrain. Stubblefield Creek and Cedar Creek are labeled in the north-central area. Turkey Creek, Robertson Creek, and Flint Creek appear farther southeast, while Bent Creek follows a pronounced valley near the eastern edge. Hale Branch is marked nearby and helps identify the smaller drainage network on that side.
Sinking Creek runs toward the southern boundary, Dickenson Pond is labeled in the northeast, and Cluck Ponds appear in the southwest. These features show that Hamblen County’s water pattern is not limited to the large reservoir edge. Smaller streams repeatedly occupy the low spaces between ridges across the central and eastern parts of the county.
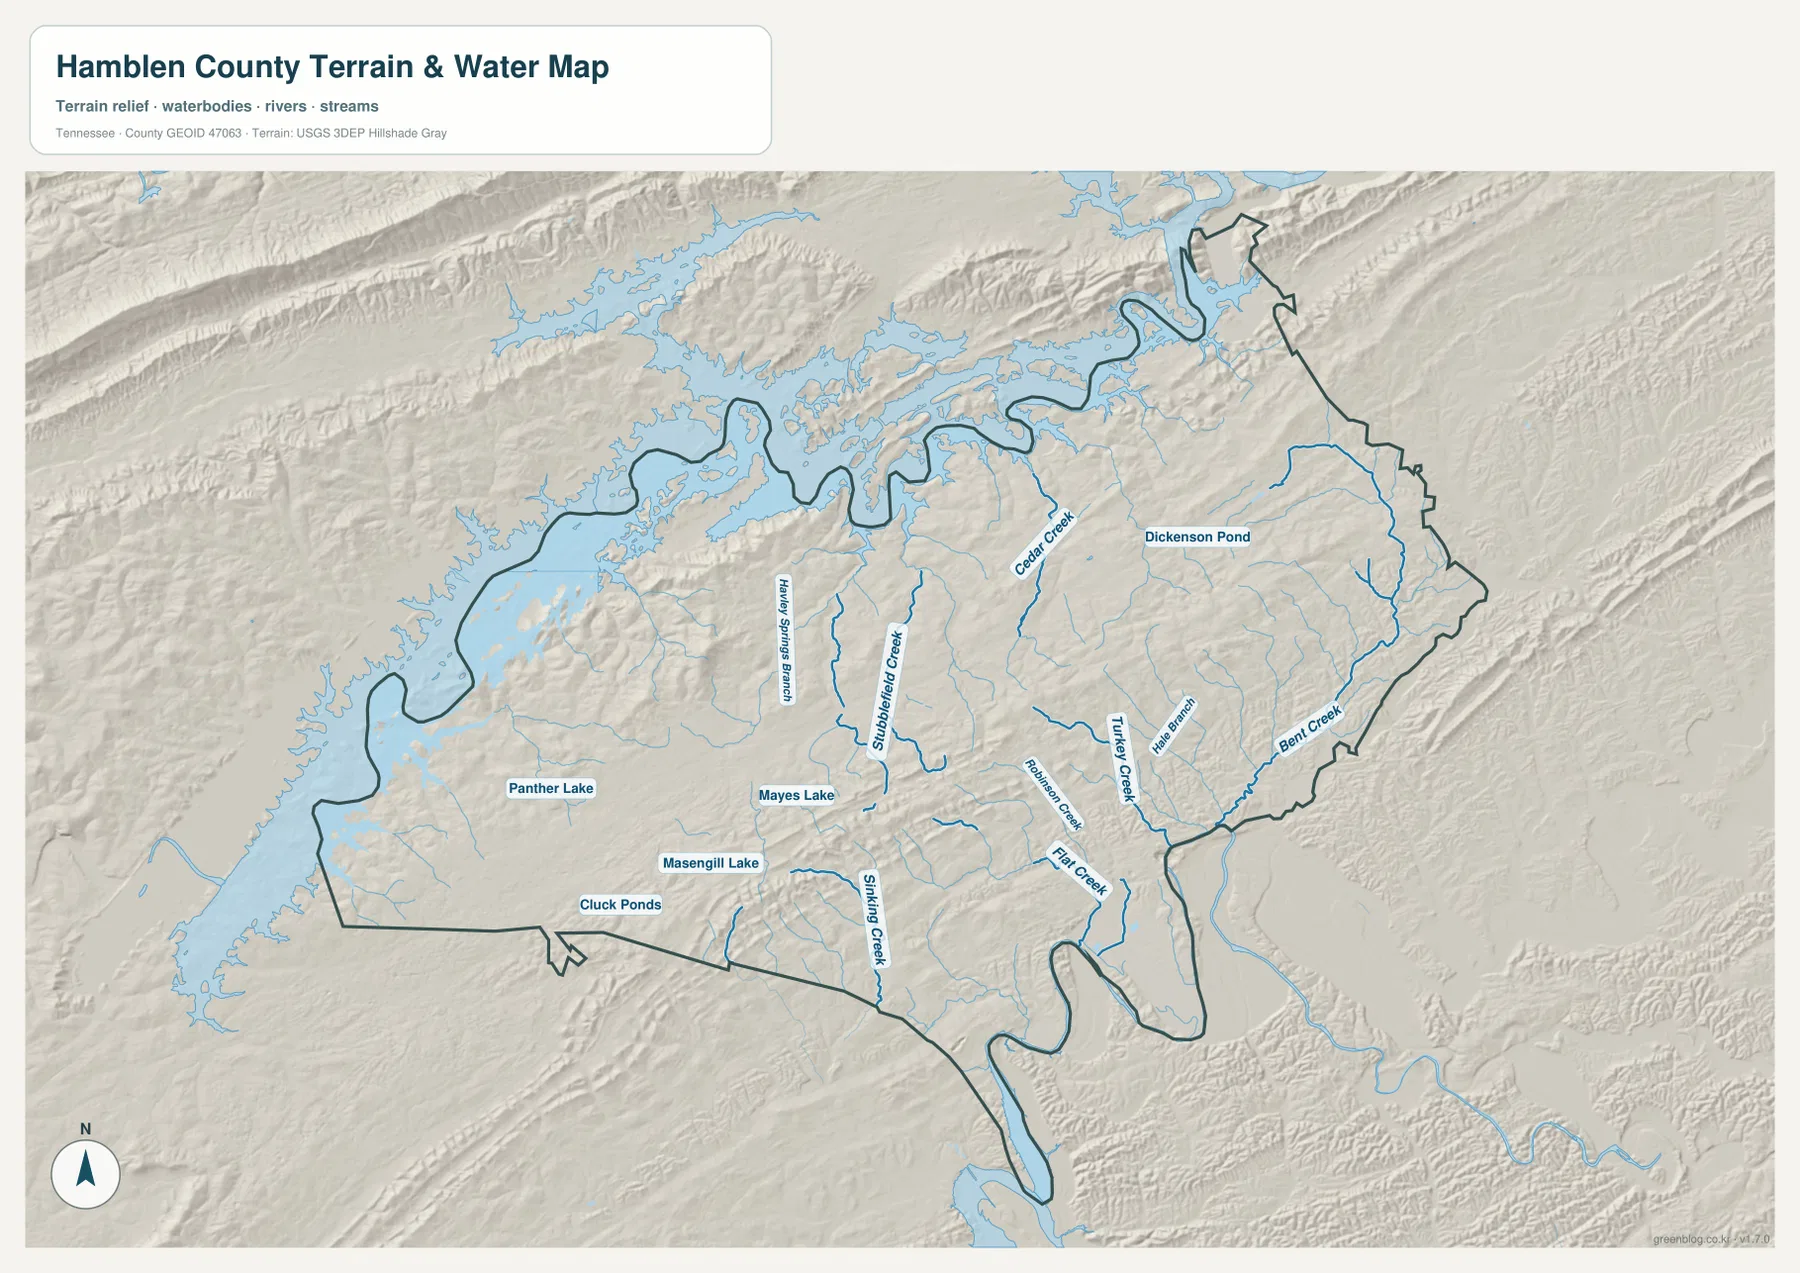
This layer is intended for geographic comparison rather than current water conditions. It does not establish flood limits, boating access, shoreline ownership, or a water level for a specific date. Its main purpose here is to show how creeks and reservoir arms fit between the ridges, roads, and settlement areas visible on the other maps.
A 275–593 m range turns the interior into a sequence of ridges and low corridors
The elevation map shows an actual county range of about 275 to 593 meters, with a mean near 380 meters. Long brown ridges run from southwest toward northeast through the interior. Green and yellow-green valleys lie between them, while the reservoir edge in the northwest and several southeastern drainage corridors occupy some of the lower terrain.
The central high ground is not one isolated hill. Several narrow ridges run roughly parallel, separated by creek valleys and road corridors. Morristown itself sits within this uneven terrain rather than on a broad flat plain. East toward Russellville and Whitesburg, the ridge pattern continues and helps explain the bends visible in the road network.
Lower land becomes more continuous around the northwestern water edge and along parts of the southern and southeastern boundary. Higher ridges reappear between those low areas, so the county does not simply slope from one side to the other. The defining pattern is repetition: ridge, valley, stream, and road corridor occur again and again across a relatively compact county.
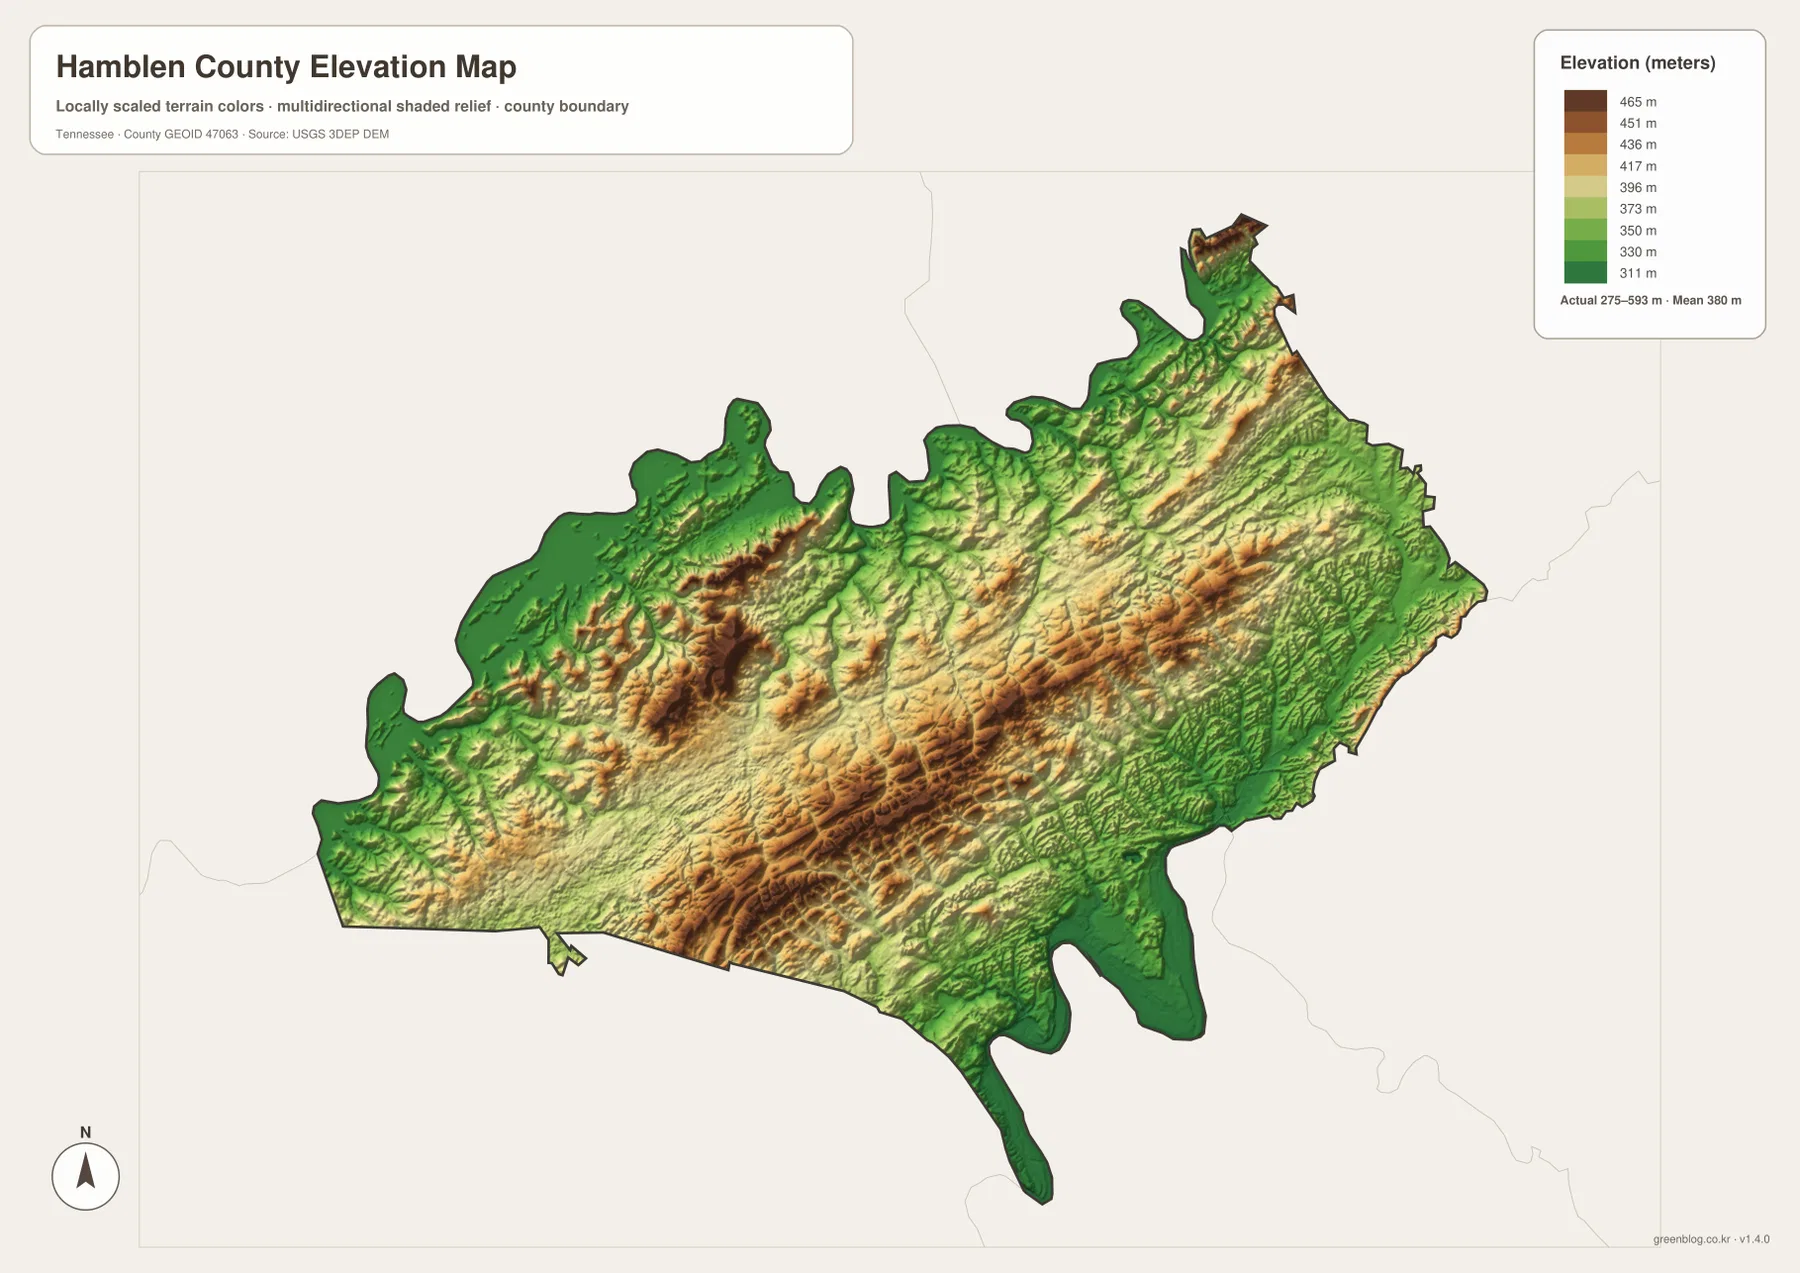
The terrain colors are designed for relative comparison across the county, not for a survey-grade elevation at a specific property. They are especially useful when compared with Cedar Creek, Turkey Creek, Bent Creek, and the road map, because many of the mapped roads and streams share the same lower corridors between ridges.
Morristown, the eastern road corridor, and the reservoir side tell three different parts of the county
The city map makes Morristown look like the entire story because it is the only ranked major city. The county map broadens that view by adding Russellville and Whitesburg, and the water map changes it again by showing how much of the northwest is shaped by reservoir arms and steep shoreline valleys. The elevation layer connects all three views with the long ridge pattern running through the interior.
Looking west from Morristown brings the reservoir side into focus, where water and irregular shorelines are stronger references than town labels. Looking east emphasizes Russellville, Whitesburg, and the numbered routes. Looking south brings I-81 and lower travel corridors into view. Each direction uses a different set of landmarks, which is why one map alone cannot describe the county as clearly as the four supplied layers together.
Choose the layer that matches the task. The city map is cleanest for Morristown and neighboring-county orientation. The base map is better for Russellville, Whitesburg, and road numbers. The water map is the best choice for reservoir arms and named creeks, while the elevation map makes the ridge-and-valley terrain easiest to explain.
Choosing and downloading the A3 JPG maps
The WebP images in the article are convenient for quick viewing, while the JPG originals in the ZIP are better for printing, enlargement, and offline reference. For a road-focused page, mark Morristown and only the needed destination or route on the county map. Keep creek and shoreline notes on the water map so they do not cover the road network.
The elevation image is most useful in color because the central ridges and lower water-side valleys are separated by terrain shading. A3 output also leaves more room for smaller labels such as Cedar Creek, Bent Creek, Dickenson Pond, and Routes 344 or 340 than the browser preview.
The downloadable ZIP contains the high-resolution A3 JPG originals for the county, city, water, and elevation maps shown on this page. They can be used for classroom comparison, presentations, route notes, regional study, or personal offline storage when a larger image is more useful than the web preview.
Frequently Asked Questions
Why does the city map rank only Morristown?
The supplied city layer ranks Morristown at 31,527 and does not list another major city inside the county. Russellville and Whitesburg still appear on the base county map, so a ranked-city index should not be treated as a complete list of every settlement label.
What is the clearest terrain feature on the elevation map?
The map shows about 275–593 meters of elevation. Long interior ridges stand above lower reservoir-side and creek valleys, and streams such as Cedar Creek, Turkey Creek, and Bent Creek generally follow those lower corridors between the higher bands.
Sources and reference data
County boundaries and general location can be compared with U.S. Census Bureau TIGER/Line. Local county history and reference material are available from the Tennessee State Library and Archives Hamblen County fact sheet, and the road network can be compared with the Tennessee Department of Transportation Hamblen County map.
For broader hydrography reference, see USGS National Hydrography. Elevation data can be compared with the USGS 3D Elevation Program. The descriptions on this page are based on the towns, roads, water features, and elevation patterns visible in the supplied Hamblen County maps.
Map File Information
Download the high-resolution A3 JPG originals for the Hamblen County county, city, water, and elevation maps shown in this article.
- Included Files: County map, city map, water map, elevation map
- File Type: ZIP containing 4 JPG files
Related Maps
- Alamo to Gadsden: A Crockett County Tennessee Map
- Altamont, Monteagle, and Plateau Valleys — Grundy County Tennessee Map
- Bedford County Tennessee Map
Green Map creates custom-edited map images using open geographic data sources such as geoBoundaries, Natural Earth, OpenStreetMap, and government open data. These maps are edited visual materials, not raw data files, and are provided for education, documents, presentations, and graphic reference.