The Del Norte County California Land Cover Map is dominated by forest rather than urban or agricultural cover. In the 2025 summary, forest accounts for 67.13% of the county, followed by grassland at 13.52% and shrubland at 11.41%. Developed land is 3.54%, agriculture 1.88%, wetlands 1.28%, and water 0.77%. The maps make those percentages easier to understand because the forest is not evenly mixed with every other class: development is compact along the Pacific side, while broader grass and shrub areas stand out in the north and northeast.
Four related views are provided here: the full 2025 land-cover map, a simplified forest-and-farmland map, an impervious-surface and developed-land map, and a 1985–2025 land-cover-change comparison. The on-page WebP images are convenient for reading, and the four original JPG maps are available together in one download for printing, presentations, classroom work, or offline reference. These are physical land-cover maps, not parcel, zoning, ownership, or development-permit maps.
Table of Contents
A forest county with most hard-surface development compressed near the coast
The most useful first observation is the scale of the forest block. Dark green occupies most of the central and southern county and continues through large parts of the east and north. Grass and shrub classes interrupt that green in several broad areas, but they do not replace the overall forest character. At county scale, the contrast between the interior and the Pacific side is stronger than the contrast between many individual vegetation patches.
That pattern fits the broader regional setting documented by the National Park Service. Redwood National and State Parks protect old-growth coast redwood forest along with prairies, streams, seashore, and other woodlands, and the NPS reports that 49,935 acres of the parklands lie in Del Norte County. The NLCD map should not be treated as a park-boundary map, yet the official park description provides useful context for why extensive forest cover is a defining feature of this far-northern California county.
Developed cover is visually concentrated on the western edge rather than spread evenly across the county. The largest red cluster sits in the coastal settlement area around Crescent City, with smaller concentrations and thin linear features extending away from it. The Del Norte County planning and GIS offices are based in Crescent City, reinforcing its role as the county’s main administrative and built center. Inland areas, by comparison, contain very little continuous developed cover.
A developed land class should not be read as a map of concrete. NLCD developed classes can include lawns, trees, bare ground, and other pervious surfaces within a built setting. This distinction matters especially in Del Norte County because developed cover is 3.54%, while the separate impervious product reports a much smaller countywide mean. Looking at both maps prevents the urban class from being interpreted too literally.
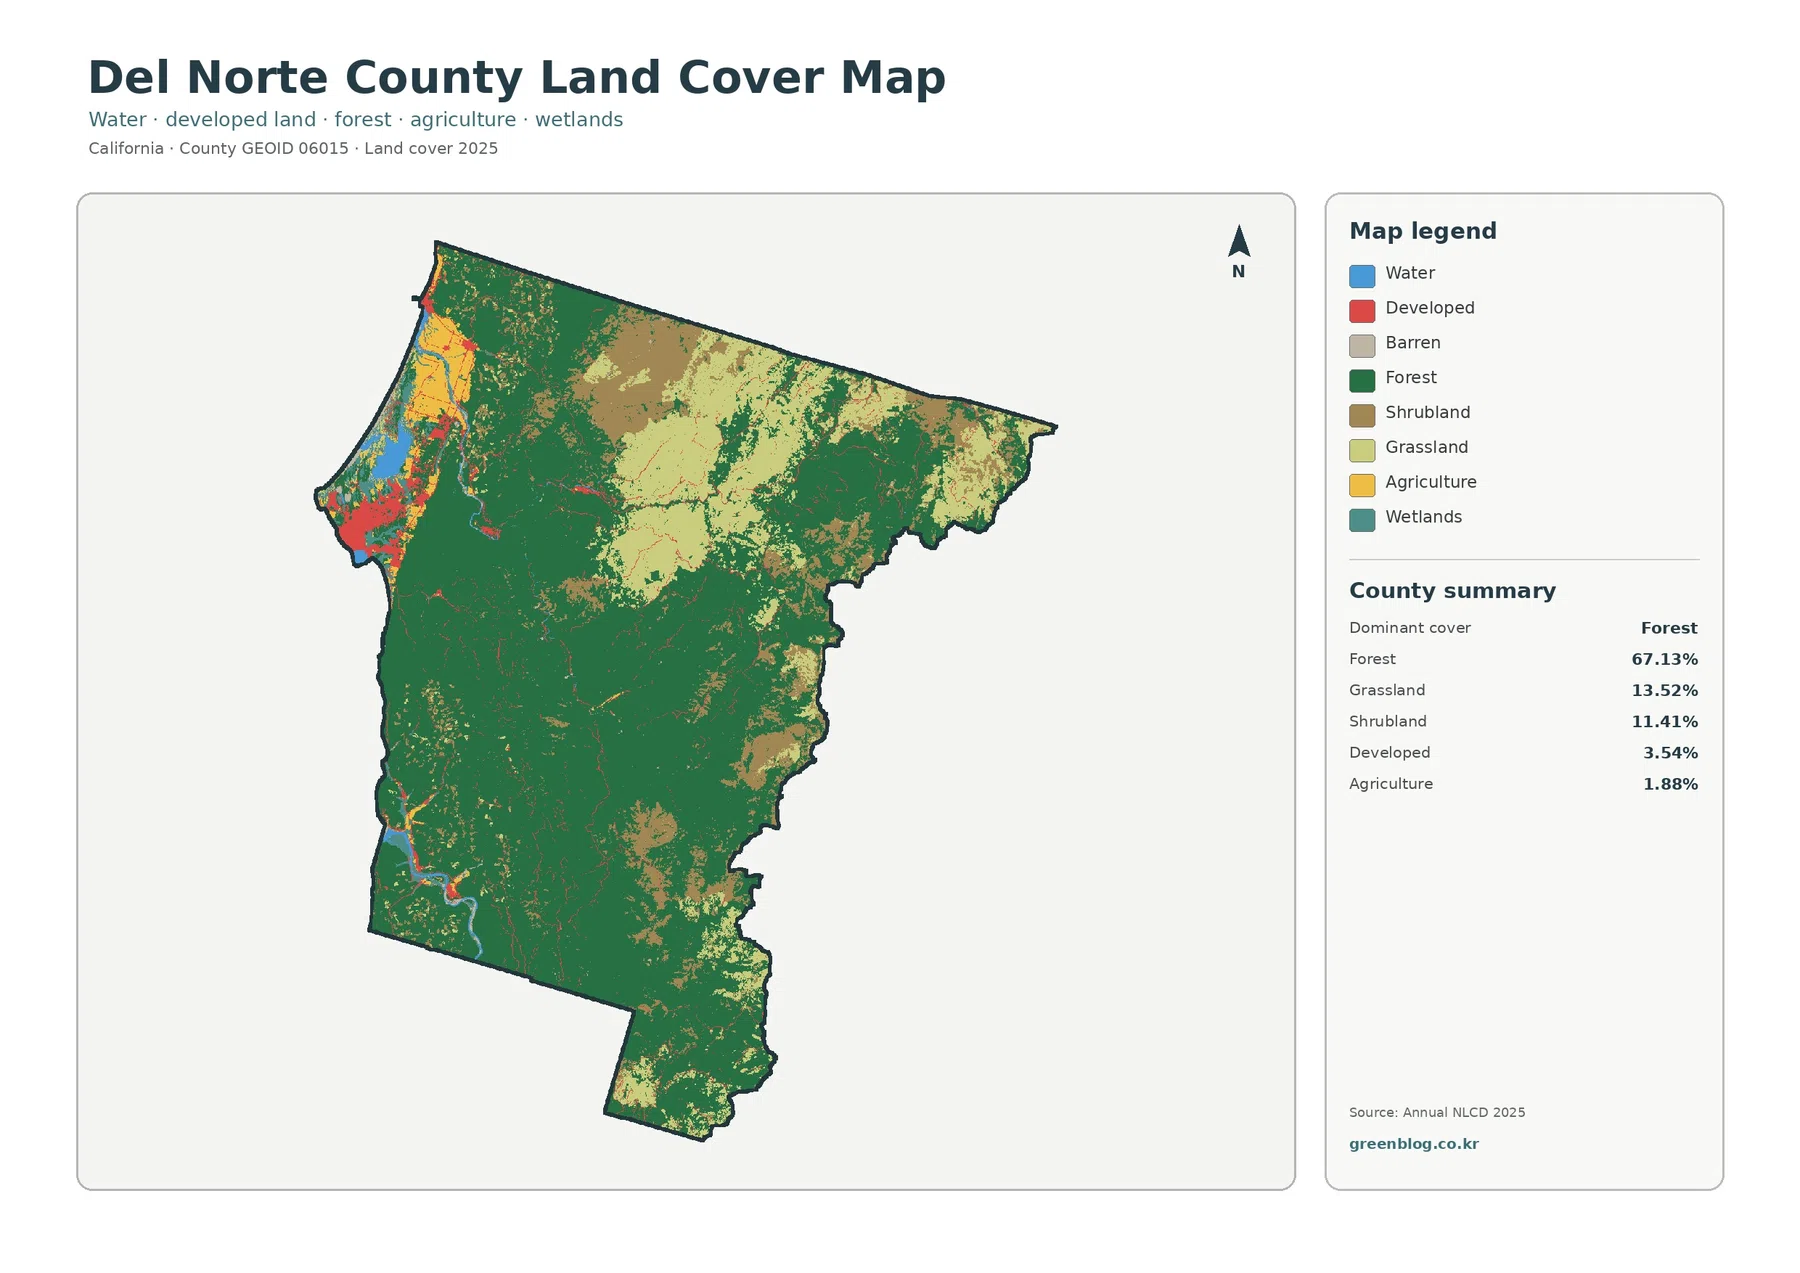
The water and wetland colors near the coast also break up the developed cluster. Rather than presenting a single solid urban footprint, the western side shows a fine-grained mixture of settlement, vegetation, water, wetland, and a small amount of agriculture. That makes the general land-cover sheet a good starting point before moving to the specialized maps, because it shows how compact the developed footprint is relative to the forested interior.
Mean impervious surface is only 0.81%, even though developed cover is 3.54%
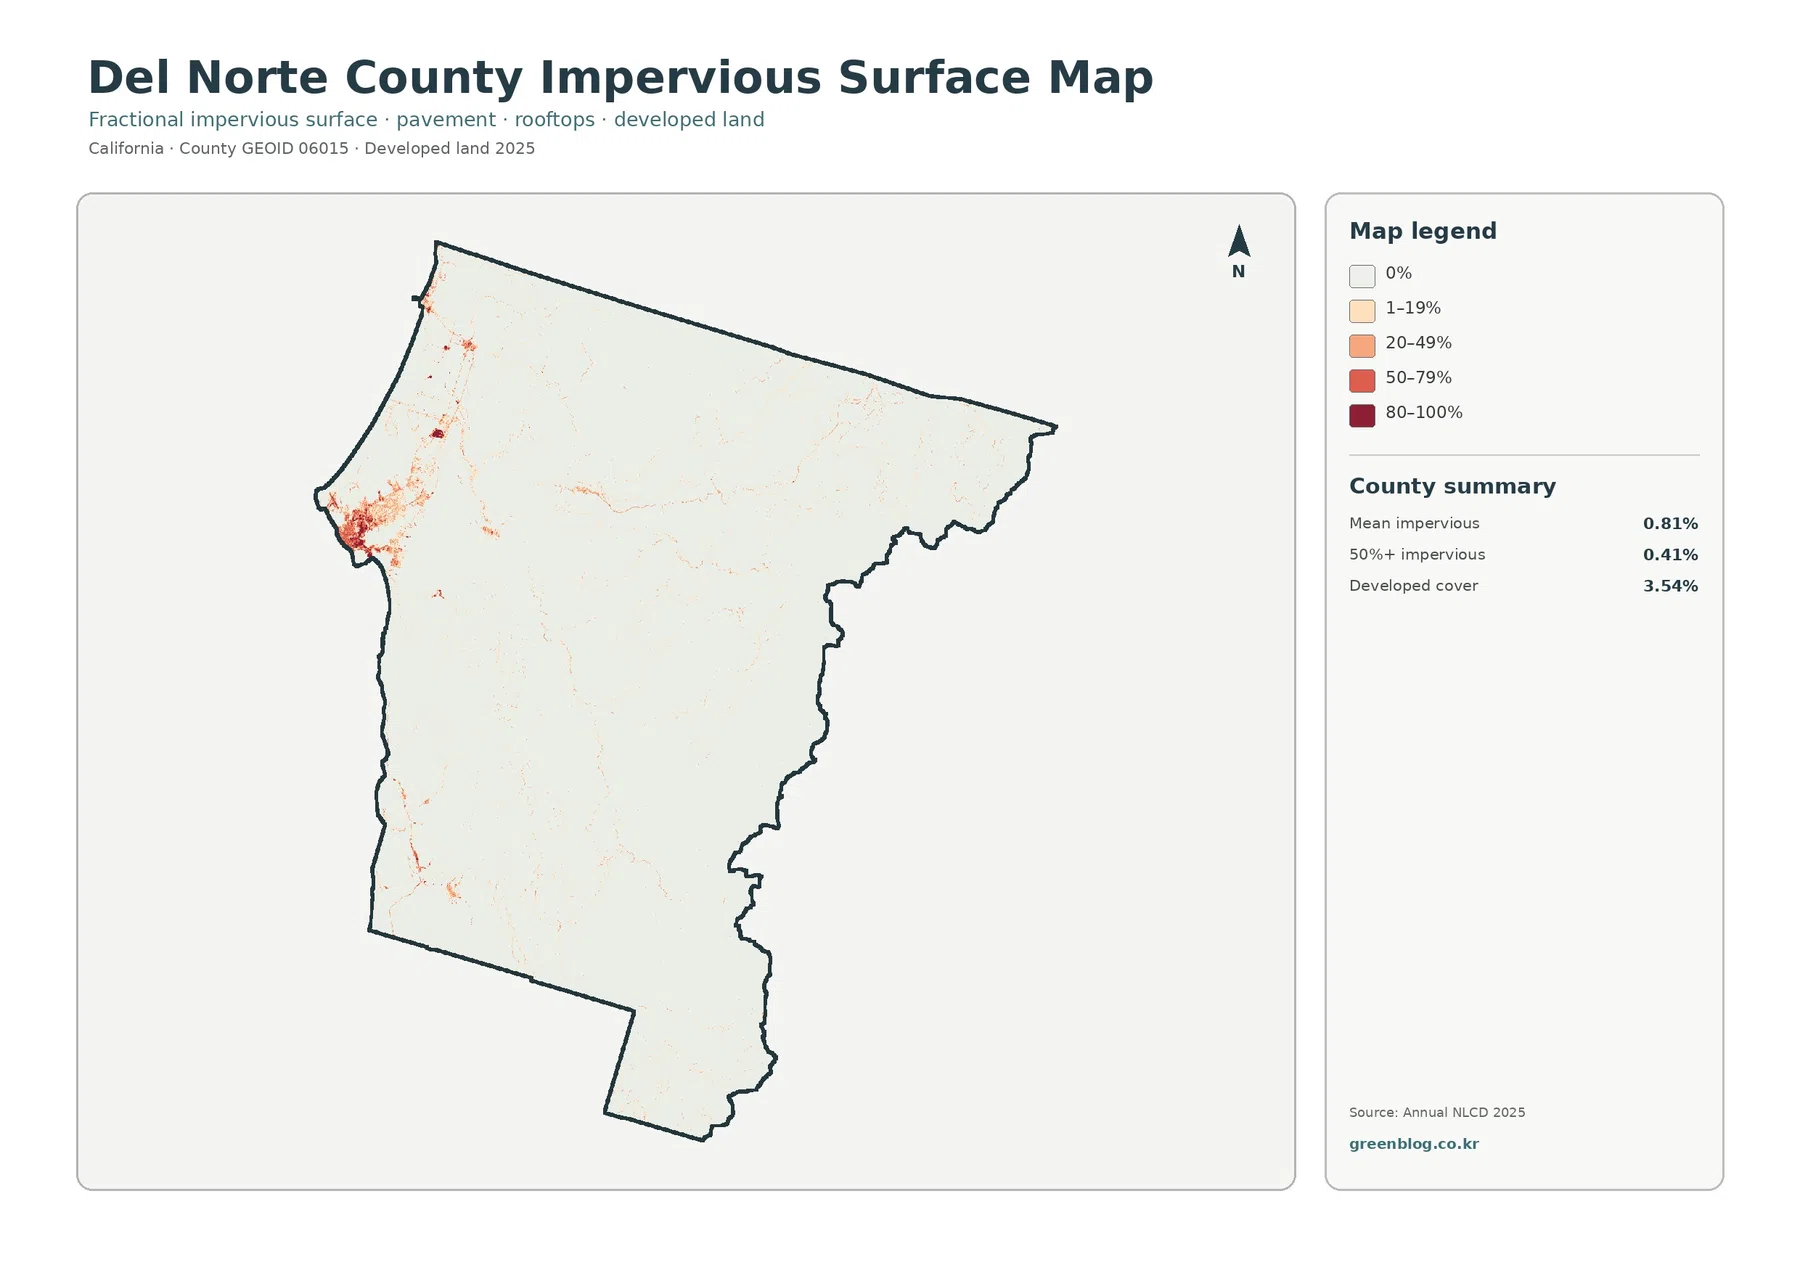
Impervious surface measures the share of a cell covered by materials such as rooftops, pavement, and parking areas that do not readily absorb water. Del Norte County has a mean impervious value of 0.81%, and only 0.41% of the county is mapped at 50% impervious or higher. Those figures are much smaller than the 3.54% developed-land share because a developed setting can still contain large amounts of vegetation and other permeable ground.
The impervious map is almost blank across the forested interior. Strong orange and red values are concentrated near the western coastal settlement, with a few smaller northern clusters and thin lines extending inland. Those lines resemble transportation or built corridors, but the product does not label roads, so they should be described as narrow high-impervious features rather than assigned a specific road name without a separate transportation map.
This is one of the clearest differences between Del Norte County and more urban California counties. A person who sees a red developed class on the general map might expect a broad hard-surface network, but the impervious map shows that high values occupy only small areas. The countywide mean is pulled down by the very large forest, shrub, and grass areas that have little or no mapped impervious surface.
The impervious map can support a county-scale discussion of settlement intensity, but it is not a flood-risk model. Stormwater behavior also depends on rainfall, soils, slope, drainage infrastructure, channel conditions, and coastal or river levels. A low countywide average therefore does not mean every neighborhood or road corridor has low runoff concerns. Site-specific questions require more detailed hydrologic and engineering information.
It is also worth separating imperviousness from planning status. The county Planning Division administers zoning, subdivision regulations, the General Plan, and the Local Coastal Program. None of those legal categories are encoded by the colors on this map. A bright impervious pixel describes a physical surface condition, while a zoning designation describes what rules apply to land use. They can be studied together, but they answer different questions.
Open grass and shrub cover is concentrated in the north, while mapped agriculture remains small
The forest-and-farmland sheet simplifies the vegetation classes enough to make the northern pattern easier to see. Forest remains the largest class, but broad tan areas of shrub and grass become much more obvious across the north and northeast. These open classes total almost one quarter of the county when grassland and shrubland are combined, so they are not minor speckles within the forest even though the county remains forest-dominant overall.
Agriculture represents just 1.88% of the 2025 land-cover summary. Yellow agricultural pixels are concentrated mainly near the northwestern coastal lowlands and appear only in small amounts elsewhere. This is a useful reminder that agricultural land cover is not the same thing as the economic importance of agriculture and forestry. A county can have limited cropland or pasture cover on the NLCD map while still having significant timber, dairy, horticultural, or other agricultural production.
Del Norte County’s Agricultural Commissioner publishes annual crop reports, and the 2023 report lists timber and milk among the county’s leading commodities. That does not change the NLCD percentages; it explains why a 1.88% agriculture class should not be used as a complete measure of the local agricultural economy. Timber production is associated with forested land, and livestock activity can occur on land that remote sensing classifies as grassland or other vegetation rather than “agriculture.”
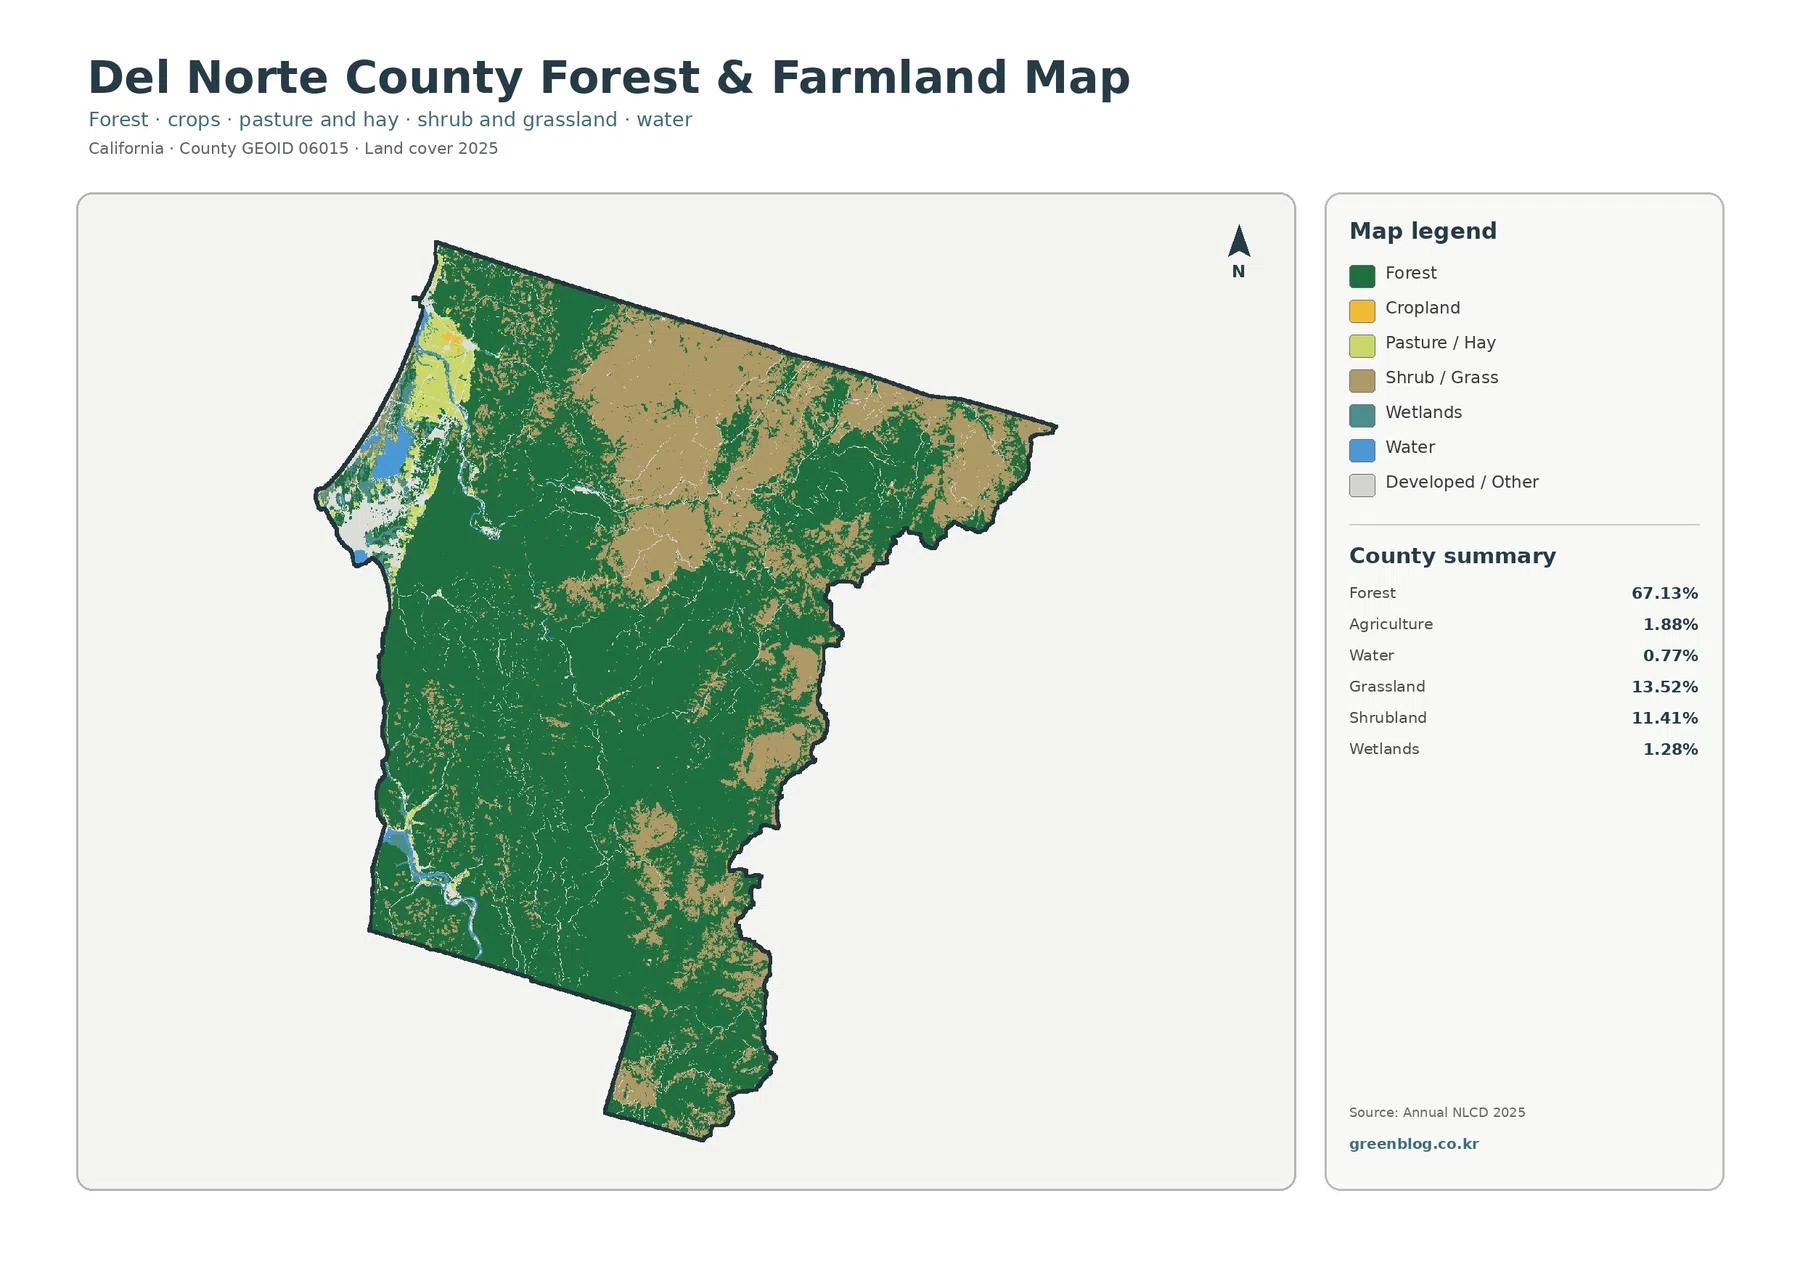
The forest-and-farmland view is therefore best used for physical comparison. It shows where forest is continuous, where open vegetation occupies a large block, and where agricultural cover is actually mapped. It does not identify crop type, grazing rights, timber ownership, conservation easements, or legal farmland designations. Those questions belong to county planning, assessor, agriculture, or land-management records.
The County GIS site makes a similar distinction by warning that map data are dynamic and are not legal documents. That is a useful principle for this map set as well. The land-cover sheets are strong visual references for the countywide pattern, but parcel-level decisions should be checked against the source datasets and the appropriate official county records.
The 1985–2025 change sheet reports a 30.83% class difference, led by forest-loss classifications
The long-term comparison is the most important map to read carefully. It reports a different mapped class across 30.83% of the county between 1985 and 2025. Within that total, 16.21% is labeled forest loss, 13.63% is other class difference, 0.82% is classified as a change to developed, and 0.09% as agricultural loss. Those categories describe differences between two land-cover classifications; they are not a complete record of every event that occurred during the forty-year interval.
Orange forest-loss cells form large patches across the northeast and east and appear in additional parts of the south and interior. On the 2025 map, several of those places are now grassland, shrubland, or another nonforest class. The change sheet is useful for locating those disagreements, but it cannot determine whether a particular pixel changed because of timber harvest, fire, vegetation succession, restoration, classification method, image timing, or another process.
That caution is especially important in a county whose identity is closely tied to redwood and other forest landscapes. The National Park Service documents ongoing protection and restoration work in Redwood National and State Parks, but the NLCD change map covers the whole county and does not label park boundaries or management actions. A colored pixel should never be assigned to a specific cause or agency without a separate time series and site-specific evidence.
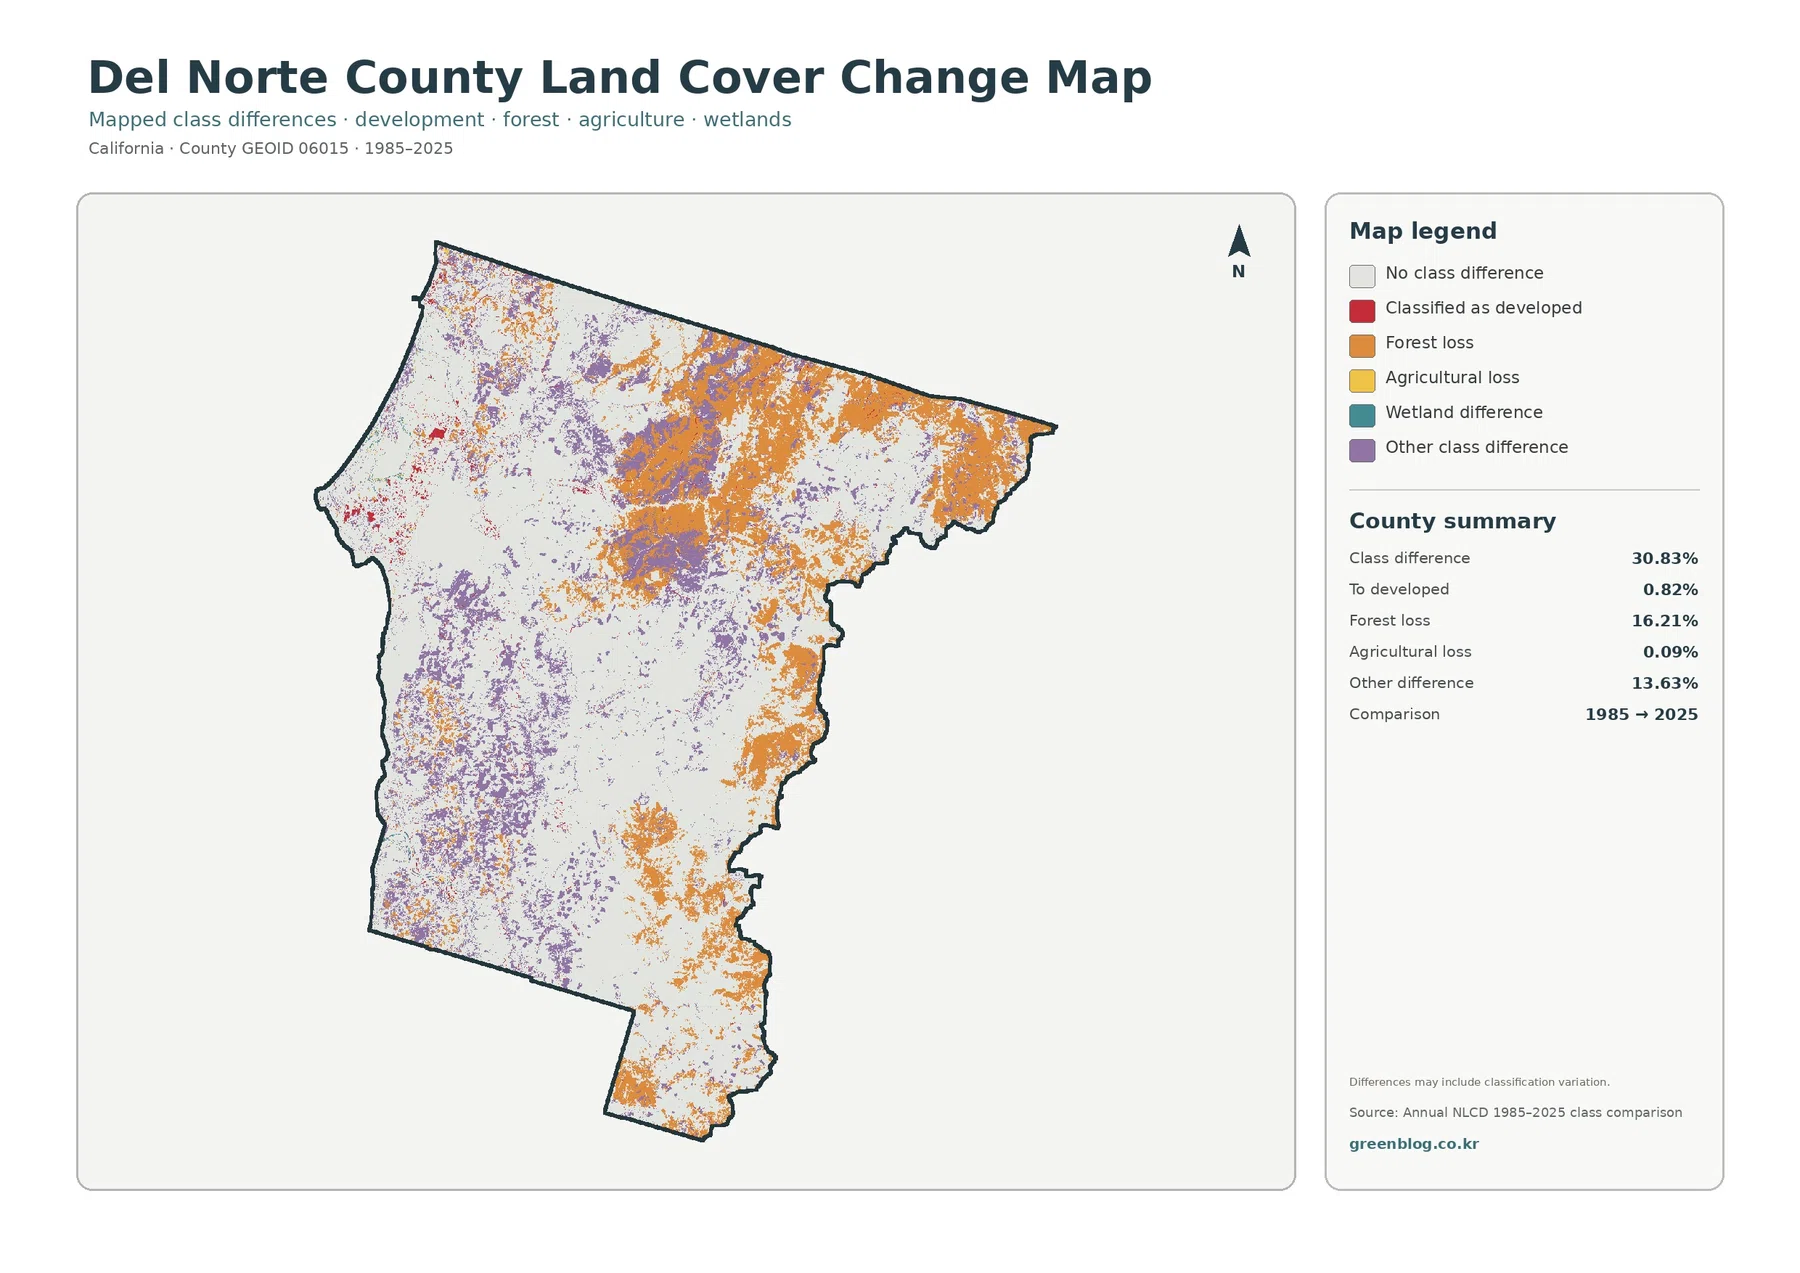
Purple other-difference cells are widespread in the west, center, and north. “Other” is not one land-change process; it combines transitions that are not separated into the headline developed, forest-loss, or agricultural-loss groups. The safest way to read a purple patch is to locate the same place on the 2025 land-cover map, note the current class, and then consult additional yearly data if the historical path matters.
Red change-to-developed cells are much less extensive than the forest-loss and other-difference categories. They are most noticeable near the western settlement area and in several small northern or linear features. Comparing those cells with the current impervious map can show whether historical classification differences overlap today’s harder surfaces, but the pair of maps cannot provide construction dates or project boundaries.
The map itself notes that class differences may include classification variation. Mixed 30-meter cells, seasonal vegetation, source imagery, and evolving classification methods can all influence which class is assigned in a given year. For that reason, the 30.83% figure is best reported exactly as a class-difference share, not as a claim that nearly one third of Del Norte County was permanently converted to a new legal or ecological use.
Water and wetlands occupy small percentages but help explain the coastal and river-edge mosaic
Water is 0.77% and wetlands are 1.28% in the 2025 summary. Those values are small beside forest, yet the blue and teal classes are visually important because they are concentrated rather than evenly scattered. They appear along the northwestern coastal and river environments, with additional water or wetland features farther south and inland. Their position helps distinguish lower, wetter landscapes from the broad forest blocks around them.
The National Park Service describes Redwood National and State Parks as a landscape that includes streams and seashore in addition to forest and prairie. That description is useful when interpreting Del Norte County as more than one continuous forest type. The NLCD map shows the same broad idea at county scale: forest is dominant, but open vegetation, water, wetland, agriculture, and development create distinct local patterns that matter when comparing one part of the county with another.
Narrow rivers, small ponds, wetland margins, and the shoreline can be generalized by a 30-meter raster. A cell containing water, wet vegetation, soil, and trees must still receive a representative class. The mapped edge should therefore be read as an approximate land-cover transition. It is not a surveyed stream width, jurisdictional wetland boundary, flood zone, or coastal regulatory line.
For readers working with local planning or property questions, the county GIS and Planning Division provide more appropriate layers and documents. Their own GIS disclaimer notes that mapped information can change and should not be treated as a legal document. The land-cover maps here are best used to describe broad environmental distribution before switching to a specialized legal, parcel, habitat, or engineering source for a specific decision.
A practical order for using the four maps and downloading the original JPG set
Start with the full land-cover map and identify the large forest block first. Next locate the open grass and shrub area in the north and northeast, then the compact developed, agricultural, water, and wetland mixture near the western coast. That sequence establishes the countywide pattern quickly without forcing every color into a separate explanation.
Move to the forest-and-farmland sheet when the project is about vegetation or agricultural cover. Use the impervious map when the question is how much of the developed footprint is actually hard-surfaced. Place the change sheet beside one of the 2025 maps rather than reading it alone; the current map gives necessary context for the forest-loss and other-difference colors.
The WebP images on this page are suitable for quick comparison on screen. The original JPG files are more useful when a standalone image is needed for printing, slides, classroom handouts, reports, or offline county comparisons. The ZIP below keeps all four Del Norte County JPG maps together so the same location can be checked across multiple views without saving each map separately.
Scale, date, and land-use limits to keep in mind
Annual NLCD is designed for consistent land-cover mapping across large areas. The 30-meter grid is appropriate for a county overview, but it generalizes narrow roads, small buildings, stream edges, shoreline details, and mixed transitions between forest, grass, shrub, wetland, and development. Pixel boundaries should not be treated as surveyed lines, even when the image is enlarged.
Land cover is also separate from ownership and legal land use. A forest pixel can be inside a national or state park, a national forest, another public holding, or private timberland; the class itself does not tell you which. A developed pixel does not identify zoning or permit status, and an agricultural pixel does not identify crop type, farm ownership, or an agricultural preserve. Those questions require current county and land-management records.
The current land-cover and impervious maps are labeled 2025, while the change map compares 1985 with 2025. Events or management changes after that date may not appear. When a project depends on current conditions, cite the map year and pair the land-cover product with recent aerial imagery, official county data, field observations, or another source appropriate to the question.
Used within those limits, the four maps provide a clear portrait of Del Norte County: extensive forest, broad northern grass and shrub cover, a small but distinct coastal development footprint, localized agriculture and wetland areas, very low countywide imperviousness, and substantial long-term classification differences that need careful interpretation. The value comes from comparing the same place across all four sheets rather than relying on one percentage or one color alone.
Frequently Asked Questions
What is the dominant 2025 land-cover class in Del Norte County?
Forest is the dominant class at 67.13%. Grassland follows at 13.52% and shrubland at 11.41%. The forest is especially extensive across the central and southern parts of the county.
Why is developed cover 3.54% while mean impervious surface is only 0.81%?
Developed land can include lawns, trees, soil, and other permeable surfaces within a built setting. Impervious surface measures harder materials such as pavement and rooftops, so its countywide average can be much lower than the developed-land share.
Does the 16.21% forest-loss category equal confirmed logging or wildfire area?
No. The change map compares mapped classes in 1985 and 2025. Real vegetation change may be included, but mixed pixels, imagery conditions, seasonal differences, and classification variation can also contribute. A specific cause requires additional time-series or site evidence.
Map File Information
The ZIP contains four original JPG maps for Del Norte County: 2025 land cover, forest and farmland, impervious surface and developed land, and 1985–2025 land-cover change. They are suitable for printing, presentations, classroom reference, and county-scale comparisons.
- Included Files: Use only the versions confirmed in the article and supplied images
- File Type: Use the confirmed download contents
- Intended Use: Printing, education, presentations, and map-based projects
Related Maps
- Alameda County California Land Cover Map
- Alpine County California Land Cover Map
- Amador County California Land Cover Map
Sources and further reading
Land-cover and impervious-surface classes can be reviewed through the MRLC Annual NLCD Data portal and the USGS Annual NLCD Land Cover Classification documentation. County boundaries and geographic identifiers are available from the U.S. Census Bureau TIGER/Line Shapefiles.
For local context, see the National Park Service Redwood National and State Parks Park Facts and the Redwood National and State Parks overview. Del Norte County also provides an official GIS portal, Planning Documents, and Crop Reports. These local sources cover planning, mapped county information, and agricultural production and should remain conceptually separate from NLCD physical land-cover classes.
Green Map creates custom-edited map images using open geographic data sources such as geoBoundaries, Natural Earth, OpenStreetMap, and government open data.
These maps are edited visual materials, not raw data files, and are provided for education, documents, presentations, and graphic reference.