A useful way to understand Yalobusha County is to start with its two county seats rather than with the county outline alone. Water Valley sits near the northern part of the county, while Coffeeville is farther south and closer to the center of the main body. Oakland and Tillatoba lie near the western transportation corridor. The downloadable files on this page combine those settlement patterns with roads, waterways, and elevation, and the ZIP contains four high-resolution A3 JPG maps for readers who need printable originals rather than only the WebP previews.
The county boundary has an irregular shape, with a western section extending toward the I-55 and US 51 corridor and a northern section reaching toward Panola and Lafayette counties. Calhoun County is labeled to the east, while Tallahatchie and Grenada counties appear to the west and southwest. Looking at the maps together makes the county easier to understand because the roads do not follow the same lines as the creeks, and the lowest valleys cut through a landscape that is much hillier than a simple highway map suggests.
Table of Contents
Two county seats organize the map differently from one central town
Water Valley and Coffeeville are the two strongest reference points on the county map. Water Valley is close to the northern boundary and is shown beside a cluster of roads and Yalobusha General Hospital. Coffeeville sits farther south on the internal north-south route. Because both are county seats, a map that shows only one of them would miss an important part of Yalobusha County’s administrative geography. For general orientation, it is better to locate both first and then place Oakland and Tillatoba along the west side.
The road pattern also explains why the settlements feel divided into more than one corridor. MS 7 links Water Valley and Coffeeville through the interior of the county. Along the western side, US 51 and I-55 run close to Oakland and Tillatoba. Other numbered routes, including MS 32, MS 315, and MS 330, extend across different parts of the county. These roads do not create a single radial pattern around one downtown; instead, the map shows an interior connection between the two seats and a separate western north-south travel corridor.
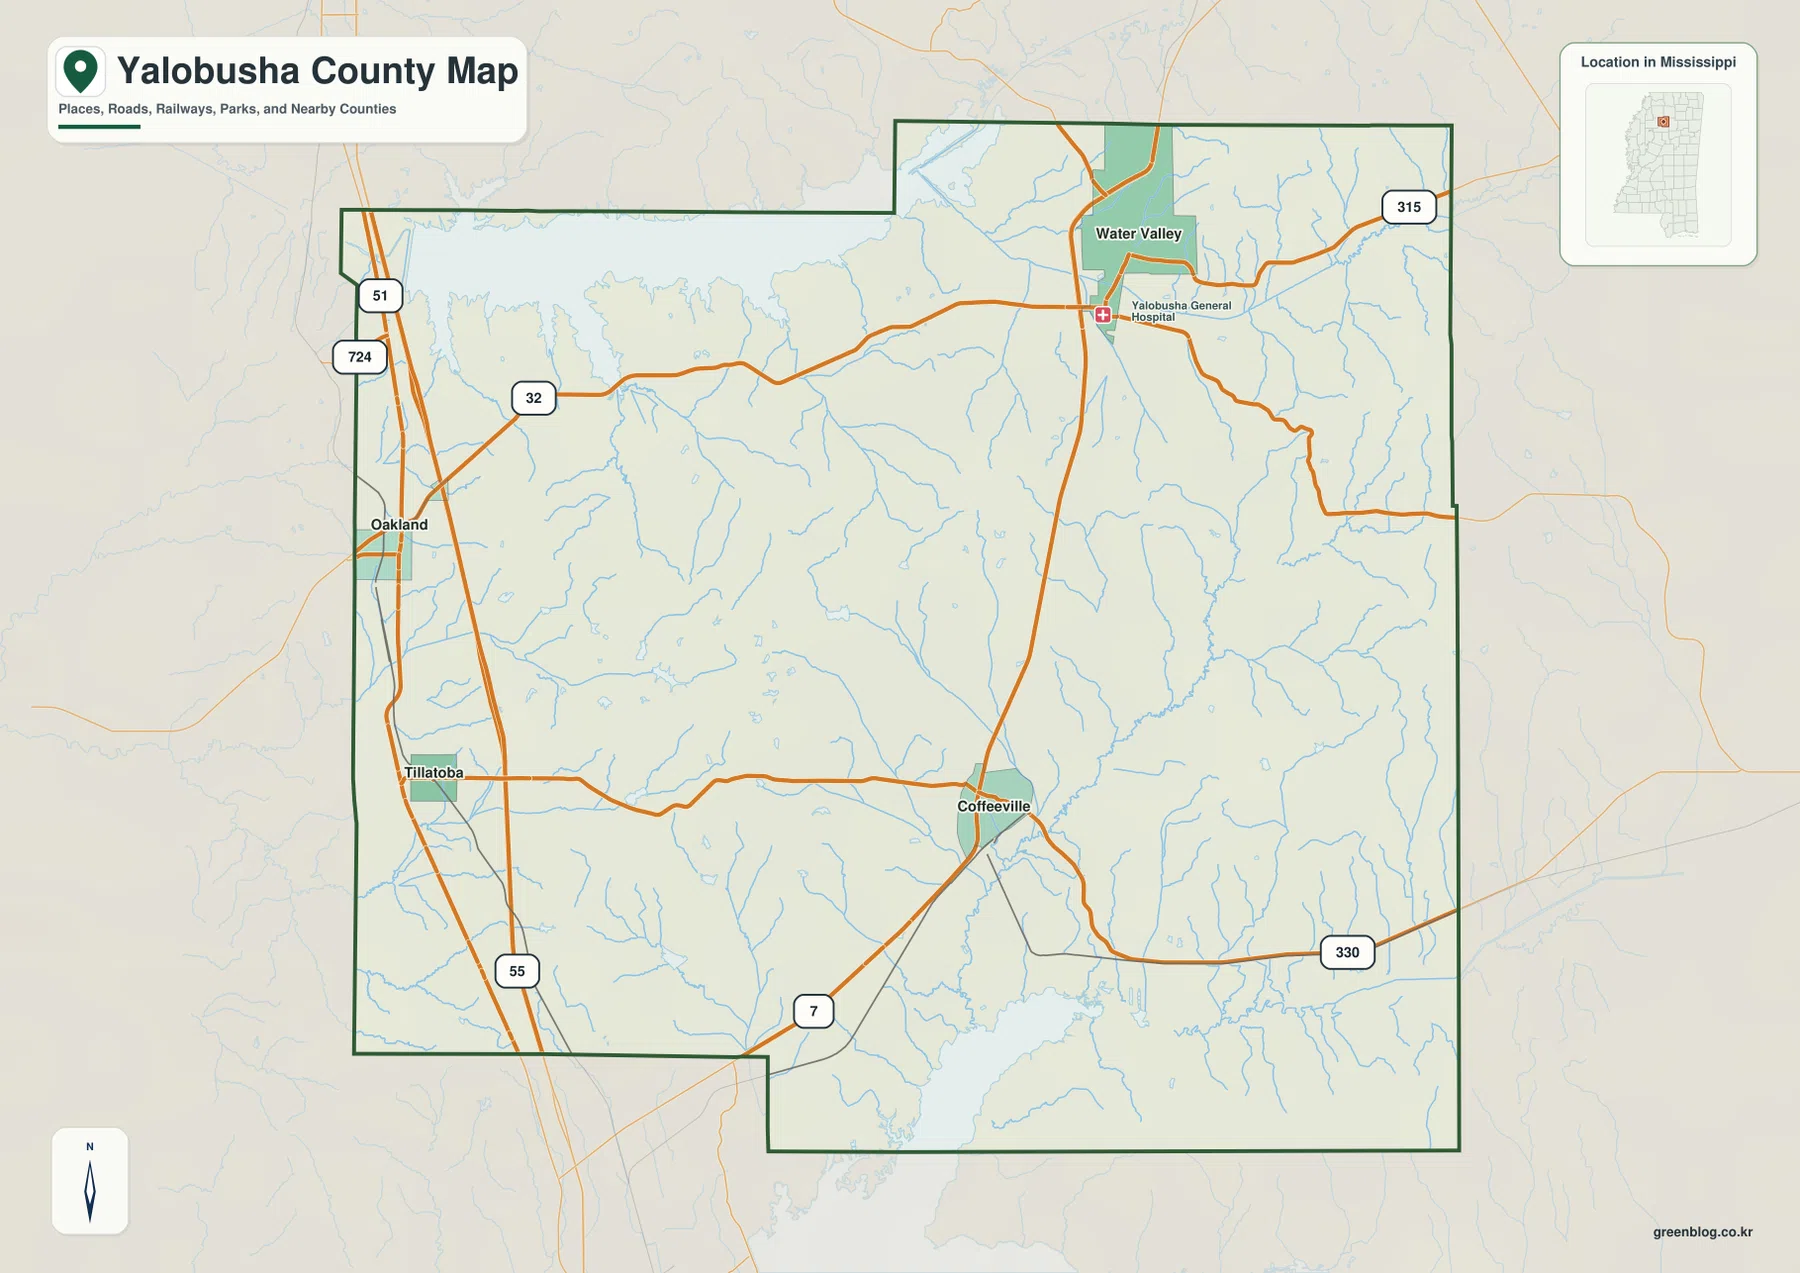
The county map is the best first choice when the question is simply “where is this place?” It shows the named towns and the road network without the extra detail of the terrain map. The unusual boundary is also clearer here: the western side reaches toward the interstate corridor, while the northern and eastern parts contain a denser network of small streams. That contrast becomes more meaningful once the city and water maps are viewed next.
Direct distances from Water Valley show how spread out the main places are
The city-connections map uses Water Valley as the hub and labels direct, straight-line distances to three other places. Coffeeville is about 13 miles away, Oakland about 17 miles, and Tillatoba about 19 miles. These are not driving distances. They are useful for comparing position and spacing inside the county, but an actual road trip can be longer because routes bend around the terrain and do not always follow a direct line.
That spacing helps explain the county’s settlement pattern. Water Valley is in the north, Coffeeville is farther south toward the interior, and Oakland and Tillatoba are both on the west side. The surrounding county labels add another layer of context: Panola and Lafayette are north of the county, Calhoun is east, Tallahatchie is west, and Grenada is southwest. A reader planning a regional route can therefore see immediately whether a destination is closer to the interior MS 7 line or to the western interstate and US highway corridor.
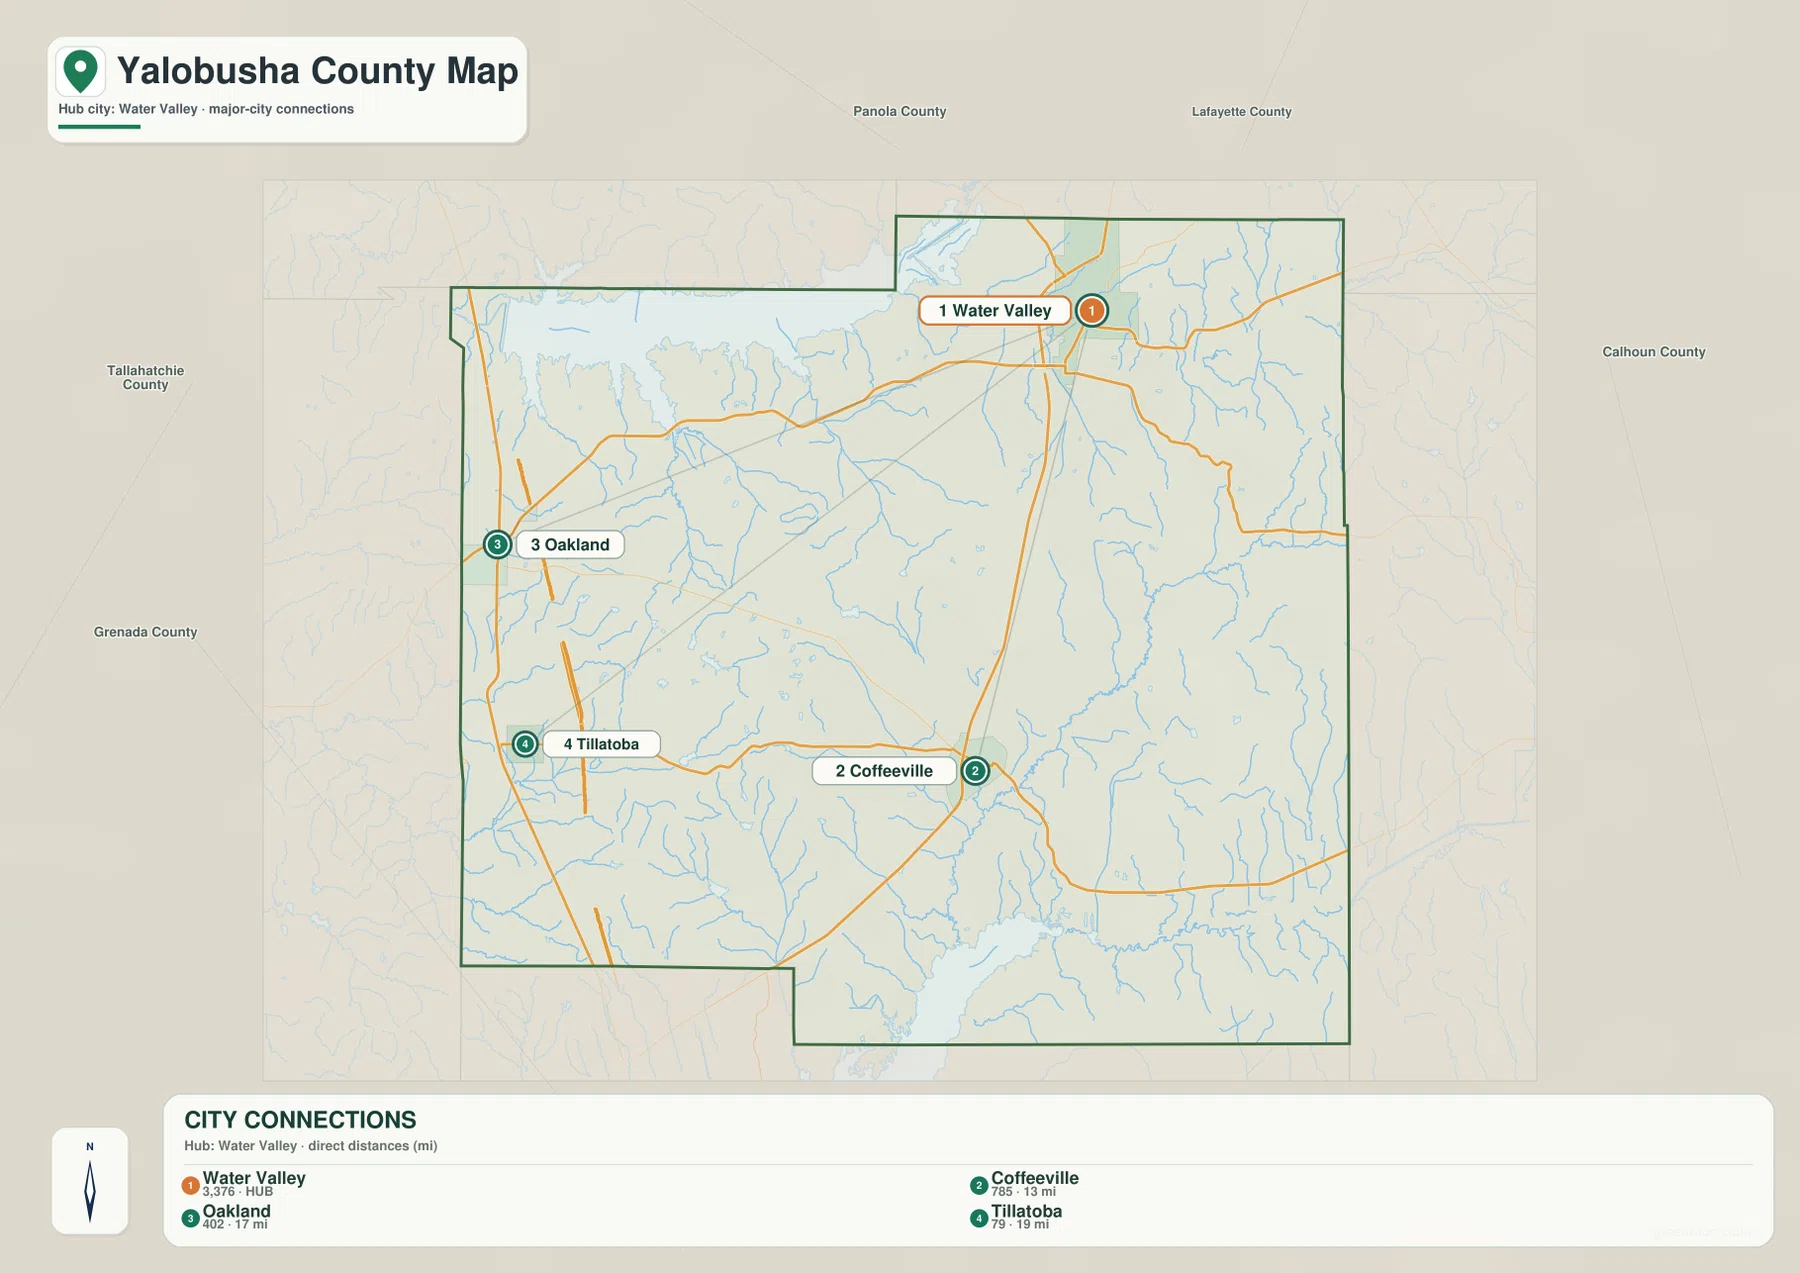
The city map should not be treated as turn-by-turn navigation. Its value is the simple geographic comparison: it makes clear that the county’s important places are separated by meaningful distances and do not form one compact urban cluster. When this map is paired with the county map, the road choices make more sense because the settlements are aligned with different parts of the transportation network.
Enid Lake is only the beginning of Yalobusha County’s water story
The terrain-and-water map contains much more detail than the standard county map. A large part of Enid Lake is visible near the northern edge, but the map also labels Otuckalofa Creek in the northeast, Cypress Creek near the center, Turkey Creek farther east, and the Skuna River in the south. Numerous smaller tributaries fill the spaces between those named channels. The result is a dense network of narrow valleys rather than a landscape dominated by one river alone.
Several smaller lakes are labeled in the western and central parts of the county, including Swearengen Lake, Walker Lake, Chestnut Lake, Lake Tillatoba, Jordon Lake, Perkins Lake, and Texas Lake. Simmons Creek and Riverdale Creek are also shown on the western and southwestern side. These names matter because they give the water map local detail that cannot be seen on a simple boundary map. They also help explain why the terrain is cut into many short ridges and valleys.
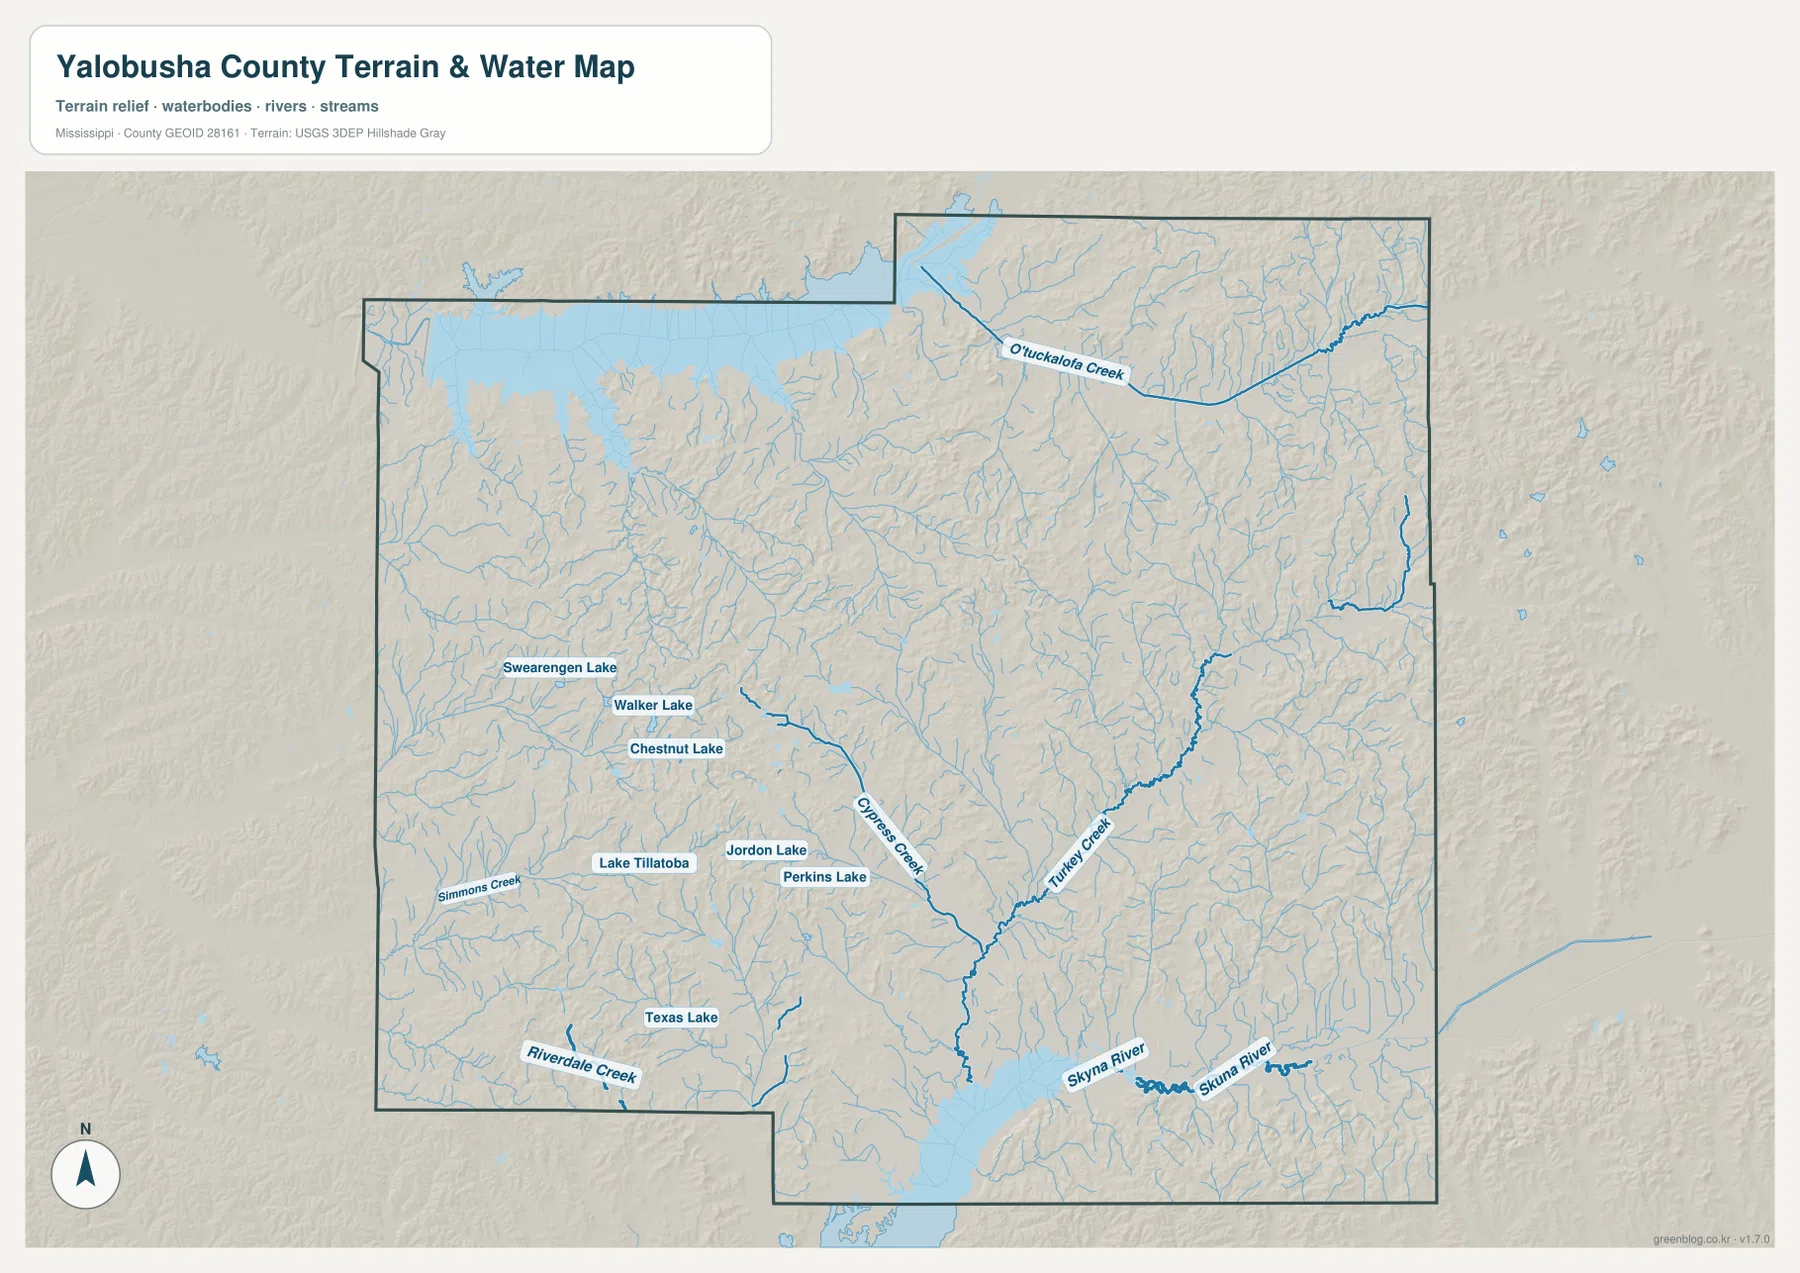
This is a reference map of visible water features and terrain, not a flood-hazard map and not a legal shoreline or property-boundary document. It should be used to understand where water is concentrated and how named creeks relate to the surrounding relief. Questions about flood risk, lake management boundaries, or public access require the appropriate official source for that purpose.
A 56–161 meter elevation range reveals a strongly dissected hill landscape
The elevation map reports an actual range of roughly 56 to 161 meters and a mean elevation of about 98 meters. Lower ground is shown in greener tones, while the higher ridges shift toward tan and brown. The most important point is not the exact color at one pixel but the pattern: narrow low valleys repeatedly cut between higher ridges across much of the county.
The eastern and northeastern parts show especially dense ridges, with many short valleys branching between them. Lower corridors follow the main drainage lines, and the southern Skuna River area forms a visible low route with higher ground rising nearby. Around the northern reservoir area, water and low valleys interrupt the hill pattern. The west also contains many ridges, although the transportation corridor near US 51 and I-55 looks simpler on the road map than the elevation surface would suggest.
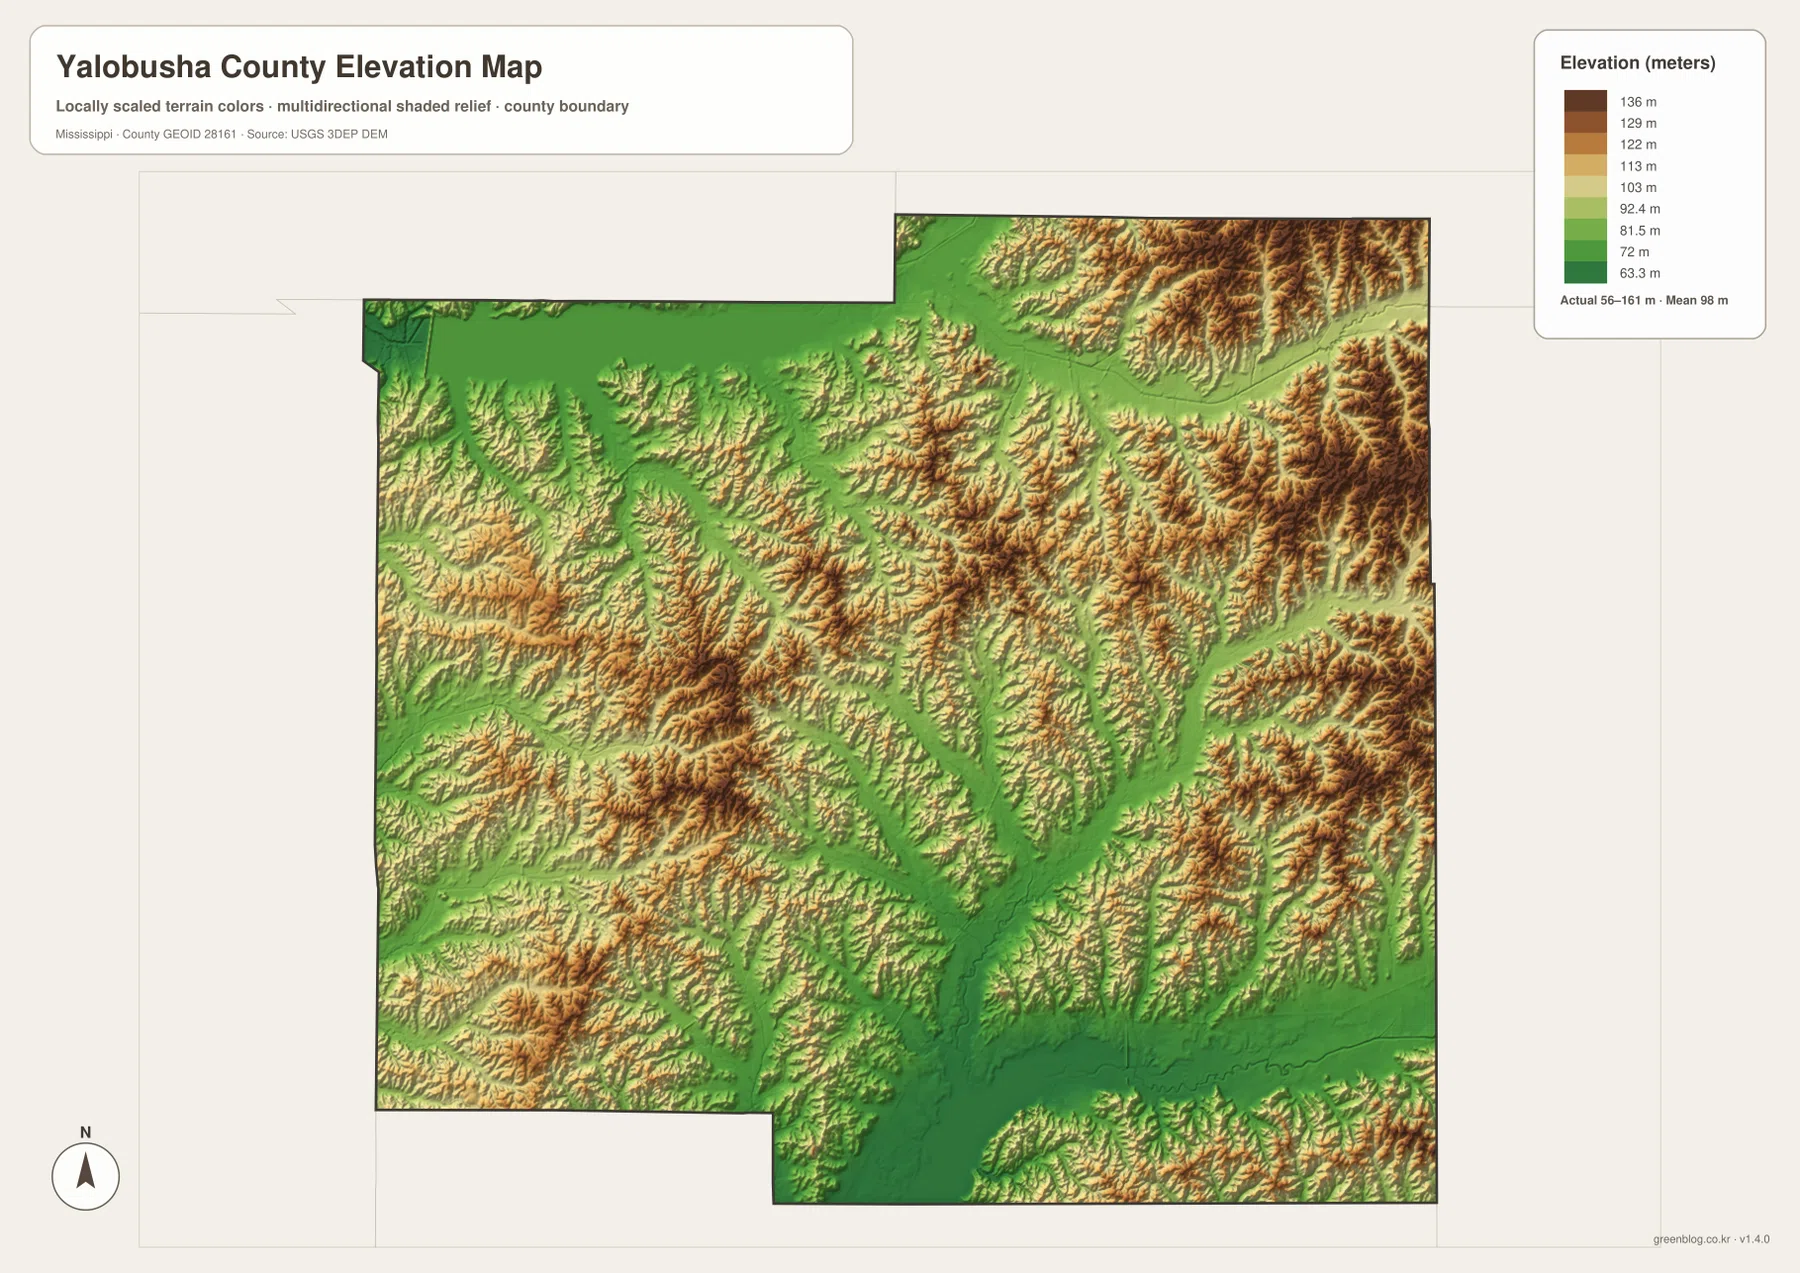
For a visitor or map user, the elevation layer is most useful for broad comparison. It can show why a route crosses a series of valleys or why a creek bends through lower ground, but it is not a substitute for survey-grade elevation data. Read beside the road and water maps, it turns the county from a flat outline into a landscape of connected ridges, channels, and reservoir edges.
Population and area figures provide scale without replacing the map
The package’s county statistics list a 2020 census population of 12,481 and a July 2025 population estimate of 12,375. Those figures have different reference dates and should be treated as separate measurements rather than as identical observations taken five years apart. The 2025 Gazetteer figures in the package report 467.151 square miles of land and 27.854 square miles of water.
Using the 2020 population with the listed land area produces a countywide average of about 26.7 residents per square mile. That number is only a broad density measure. It does not mean Water Valley, Coffeeville, the western highway corridor, forested hills, lakes, and rural areas all have the same concentration of people. The maps are important precisely because they show how settlements and transportation are distributed across a large and physically varied county.
| Reference | Value in the package | Useful map context |
|---|---|---|
| County seats | Coffeeville and Water Valley | Two centers separated along the interior road network |
| 2020 census population | 12,481 | Countywide scale, not a city-level count |
| July 2025 estimate | 12,375 | A later estimate with a different reference date |
| Land / water area | 467.151 / 27.854 sq mi | The water figure includes a county with a large reservoir edge and many smaller water features |
| Elevation | about 56–161 m; mean about 98 m | Low creek valleys separated by higher ridges |
The water-area figure is particularly helpful when viewing the maps because the county contains both the large Enid Lake shoreline area and many smaller lakes and creeks. A single total-area number would hide that difference. Likewise, the population average becomes easier to interpret after seeing that the main named places are spread between the north, interior, and western edge rather than concentrated in one large city.
Which map should you use for a specific question?
For basic orientation, start with the county map. It combines the boundary, principal towns, and major roads in one view and is the easiest map for locating Water Valley, Coffeeville, Oakland, or Tillatoba. If the question is how far the named places sit from one another, the city-connections version is faster because it adds direct-distance labels from Water Valley.
Choose the terrain-and-water map when the subject is Enid Lake, a named creek, a small lake, or the way water channels cross the county. It carries much more hydrologic detail than the standard map. Choose the elevation map when the question is relief: where the lower valleys are, where higher ridges cluster, and how large the local height range is. No single version is best for every purpose, which is why the download archive keeps all four views together.
The WebP images embedded in the article are intended for quick on-screen viewing. For printing, close inspection, or use in another layout, the A3 JPG originals in the ZIP are the better choice. The archive keeps the county, city-connections, water-and-terrain, and elevation files together so they can be compared without saving each preview separately.
Frequently Asked Questions
Why are both Water Valley and Coffeeville shown as county seats?
The administrative information preserved in the package identifies both Water Valley and Coffeeville as county seats. Their locations are also clearly separated on the maps, with Water Valley in the north and Coffeeville farther south in the interior. For that reason, using both as reference points gives a more accurate picture of Yalobusha County than treating either town as the only center.
Does the Enid Lake area explain all of the county’s waterways?
No. Enid Lake is the largest and easiest northern water feature to recognize, but the water map also labels Otuckalofa Creek, Cypress Creek, Turkey Creek, the Skuna River, several smaller lakes, and many unnamed tributaries. The county’s drainage and terrain are therefore more complex than the reservoir alone suggests.
Are the 13, 17, and 19 mile labels driving distances?
No. The city-connections map explicitly describes its values as direct distances from Water Valley. Coffeeville is shown at about 13 miles, Oakland at about 17 miles, and Tillatoba at about 19 miles. Road mileage can be longer because highways and local roads do not follow a straight line between the points.
Sources and Reference Material
The article uses the map previews and the official reference links already preserved in the county package. For updated figures, road references, or Enid Lake information, consult the original sources below.
- U.S. Census Bureau QuickFacts for Yalobusha County
- U.S. Census Bureau Gazetteer Files
- Mississippi Department of Transportation Official Highway Map
- U.S. Army Corps of Engineers Enid Lake information
Map File Information
The page uses lightweight WebP previews, while the ZIP below contains four high-resolution A3 JPG originals for printing, editing, or closer inspection.
- File Type: ZIP containing four JPG files
Related Maps
Green Map creates custom-edited map images using open geographic data sources such as geoBoundaries, Natural Earth, OpenStreetMap, and government open data. These maps are edited visual materials, not raw data files, and are provided for education, documents, presentations, and graphic reference.