Calhoun County sits on the Texas Gulf Coast, where roads and communities are arranged around broad bays rather than across a simple inland grid. Port Lavaca is the main reference point, with Point Comfort close to the northeast, Seadrift farther south, and Port O’Connor toward the eastern coastal edge. The county, city, water, and elevation maps on this page show those relationships from different angles, and the same four maps are available as high-resolution A3 JPG files in one downloadable ZIP.
The most important feature to notice is how much water shapes the county. Lavaca Bay separates Port Lavaca from Point Comfort, Matagorda Bay occupies a large part of the eastern side, and a chain of bays continues south toward Espiritu Santo Bay, San Antonio Bay, Mesquite Bay, and Aransas Bay. Long stretches of low coastal land extend between these waters. That means two places can appear close on a small map while the practical road connection is much less direct. Reading the shoreline together with the road network gives a much clearer picture of Calhoun County than the boundary alone.
Table of Contents
Port Lavaca is the clearest starting point for roads and shoreline
On the county map, Port Lavaca stands near the center of the northern mainland portion of the county. Several numbered routes meet or pass near the city, while Point Comfort lies just across the bay to the northeast and Seadrift sits farther south. The map also labels Alamo Beach and Magnolia Beach southeast of Port Lavaca and Port O’Connor near the eastern end of the county. Road numbers 87, 35, 238, 185, 316, 159, and 172 appear on the map, making it possible to follow the main directions of travel without turning the page into a road atlas.
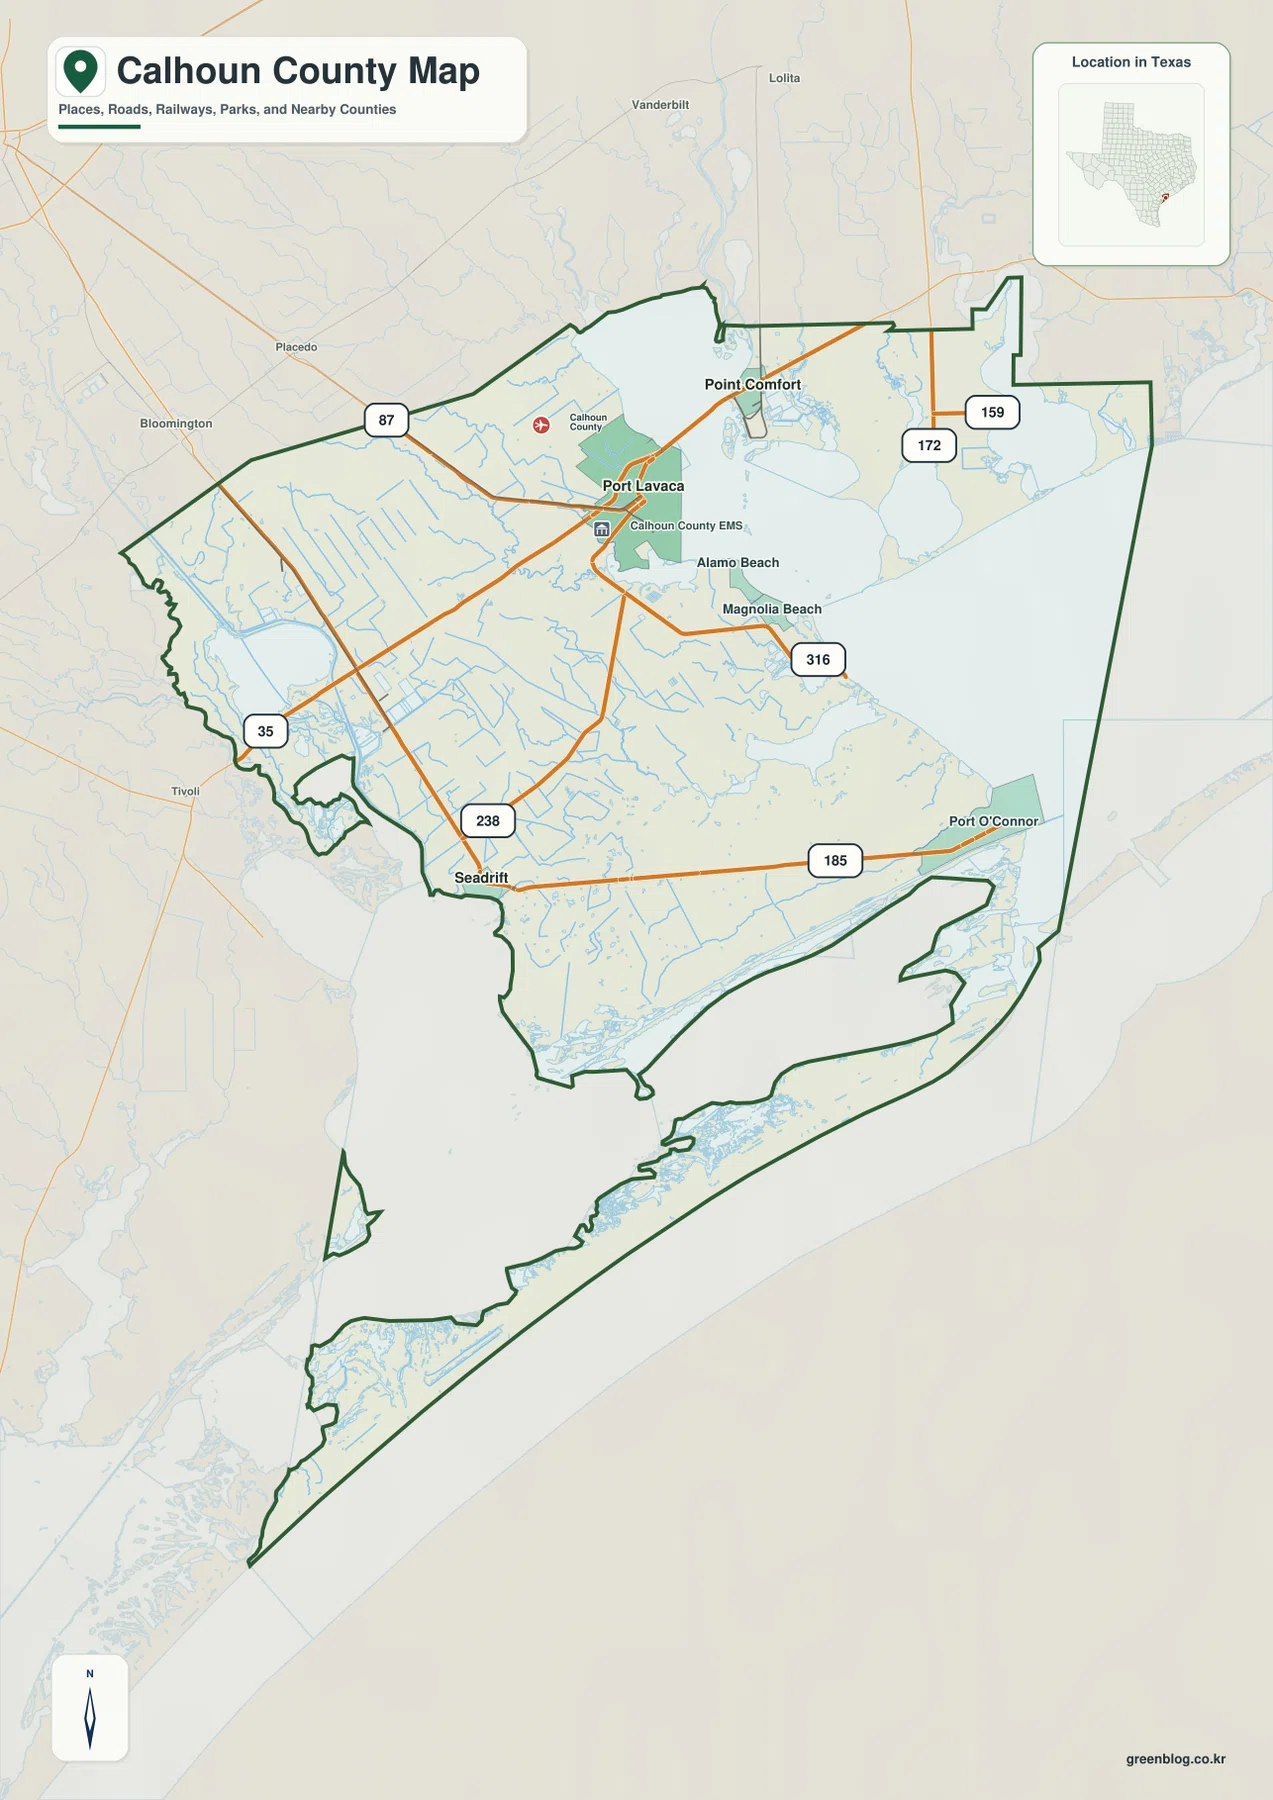
The shoreline changes how those roads should be interpreted. Port Lavaca and Point Comfort are close in straight-line distance, but Lavaca Bay occupies the space between them. Seadrift is reached along a different southern approach, while Port O’Connor lies beyond a long stretch of coastal land on the Matagorda Bay side. Instead of asking only which road is closest to a place name, it is more useful here to ask which bay lies between the places and where the available road corridor crosses or goes around that water.
Three mapped communities show the county’s north-south spacing
The city connection map simplifies the county to Port Lavaca, Point Comfort, and Seadrift. Port Lavaca is marked as the hub. Point Comfort is shown about 5 miles away in straight-line distance, while Seadrift is shown about 15 miles from Port Lavaca. These figures are not driving distances and should not be used to estimate travel time. Their value is comparative: Point Comfort belongs to the close northern bay setting around Port Lavaca, whereas Seadrift is clearly separated to the south.
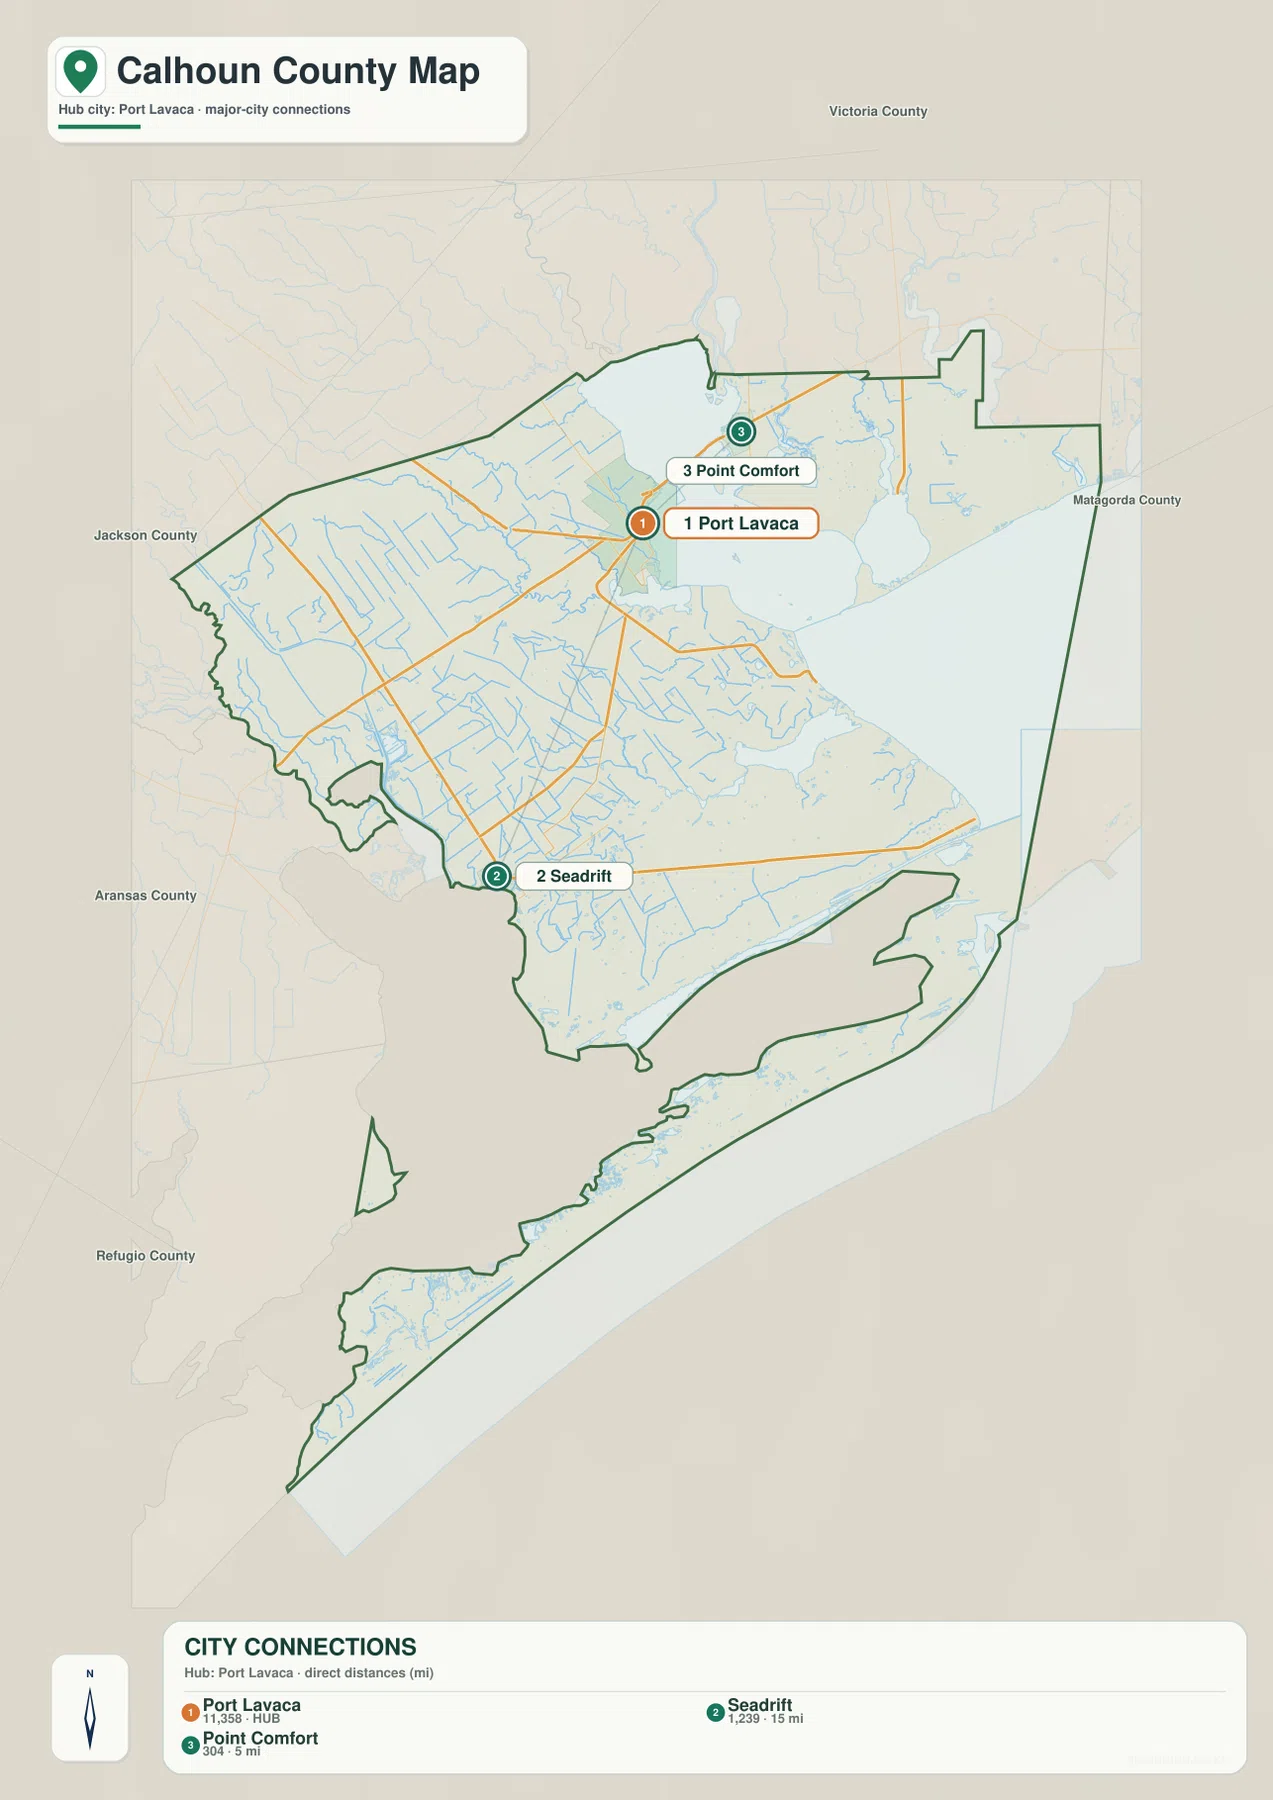
The map also places the county within its immediate regional setting. Jackson County is labeled to the west, Victoria County to the north, Matagorda County to the east, and Aransas and Refugio counties toward the southwest. That context is useful because the Calhoun County boundary has a very different shape from the inland counties around it. Much of the eastern and southern edge follows coastal water and long narrow landforms, so the surrounding-county labels help distinguish a land boundary from a bay or Gulf-facing edge.
A chain of bays defines the eastern and southern county
The water map makes Calhoun County’s coastal character unmistakable. Lavaca Bay occupies the north-central waterfront beside Port Lavaca, with Keller Bay to the east. Matagorda Bay fills a broad area along the eastern side. Farther south, Espiritu Santo Bay and San Antonio Bay continue the sequence of sheltered coastal water, while Mesquite Bay and Aransas Bay appear near the southwestern end. Haynes Bay is labeled along the western side of the lower mainland. The result is a county whose shape is better understood as land threaded between bays than as a single compact block.
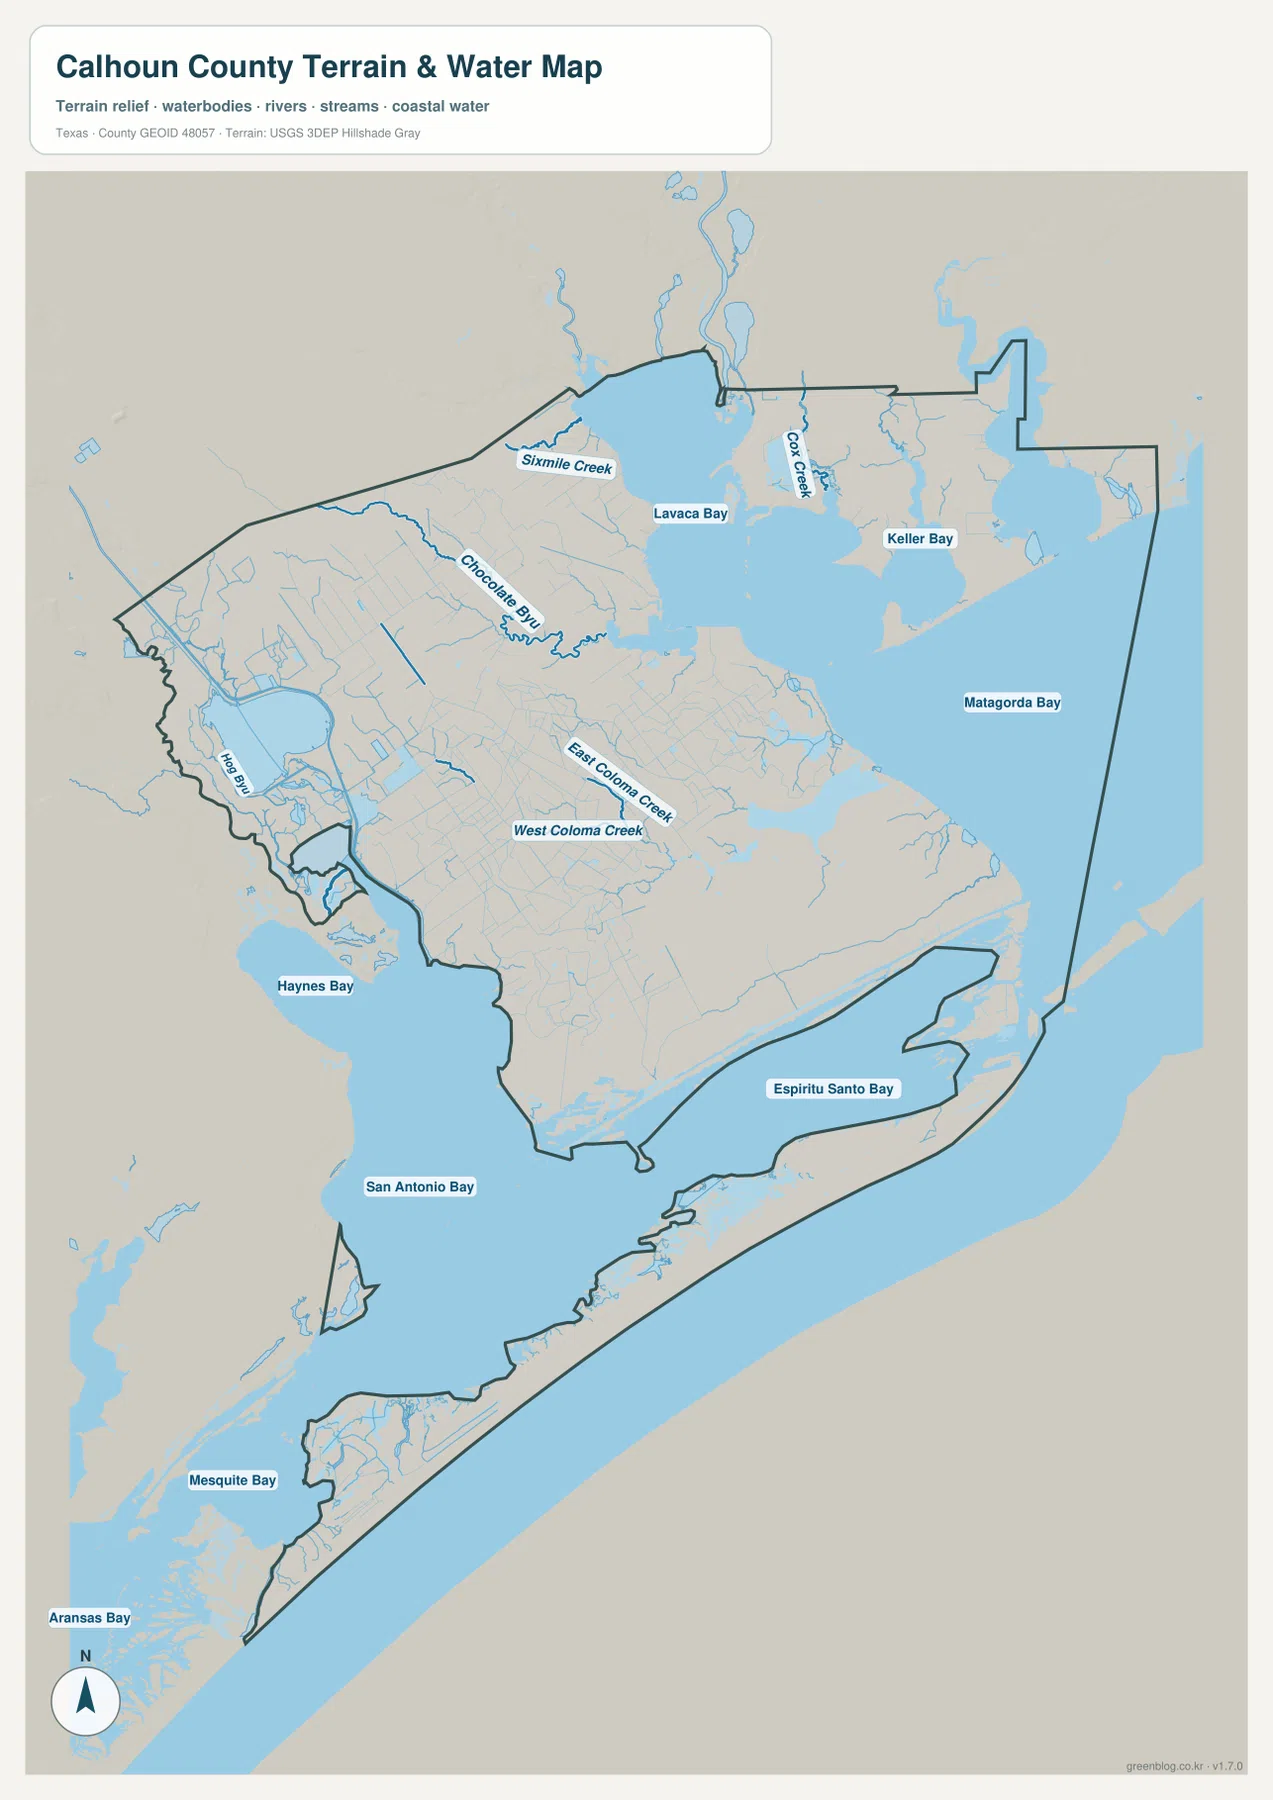
Several smaller waterways are labeled inland. Sixmile Creek appears west of Lavaca Bay, Cox Creek reaches the bay from the north side, and East Coloma Creek and West Coloma Creek cross the central mainland. Numerous thinner blue lines spread through the low country, especially toward the south. This map is not a flood-zone map, a navigation chart, or a legal description of waterfront property. It is best used to understand where named bays and creeks sit in relation to roads, towns, and the county boundary.
Most of the county is only a few meters above sea level
The elevation map reports an actual range of roughly -1 to 35 meters and a mean elevation of about 3 meters. That is a very low profile compared with an inland hill country map. Most of the eastern and southern county is shown in green, indicating low coastal ground. Warmer yellow and brown tones appear mainly in the west and northwest, with a few smaller higher patches elsewhere. The map therefore shows a gradual inland rise rather than a landscape dominated by steep ridges or deep valleys.
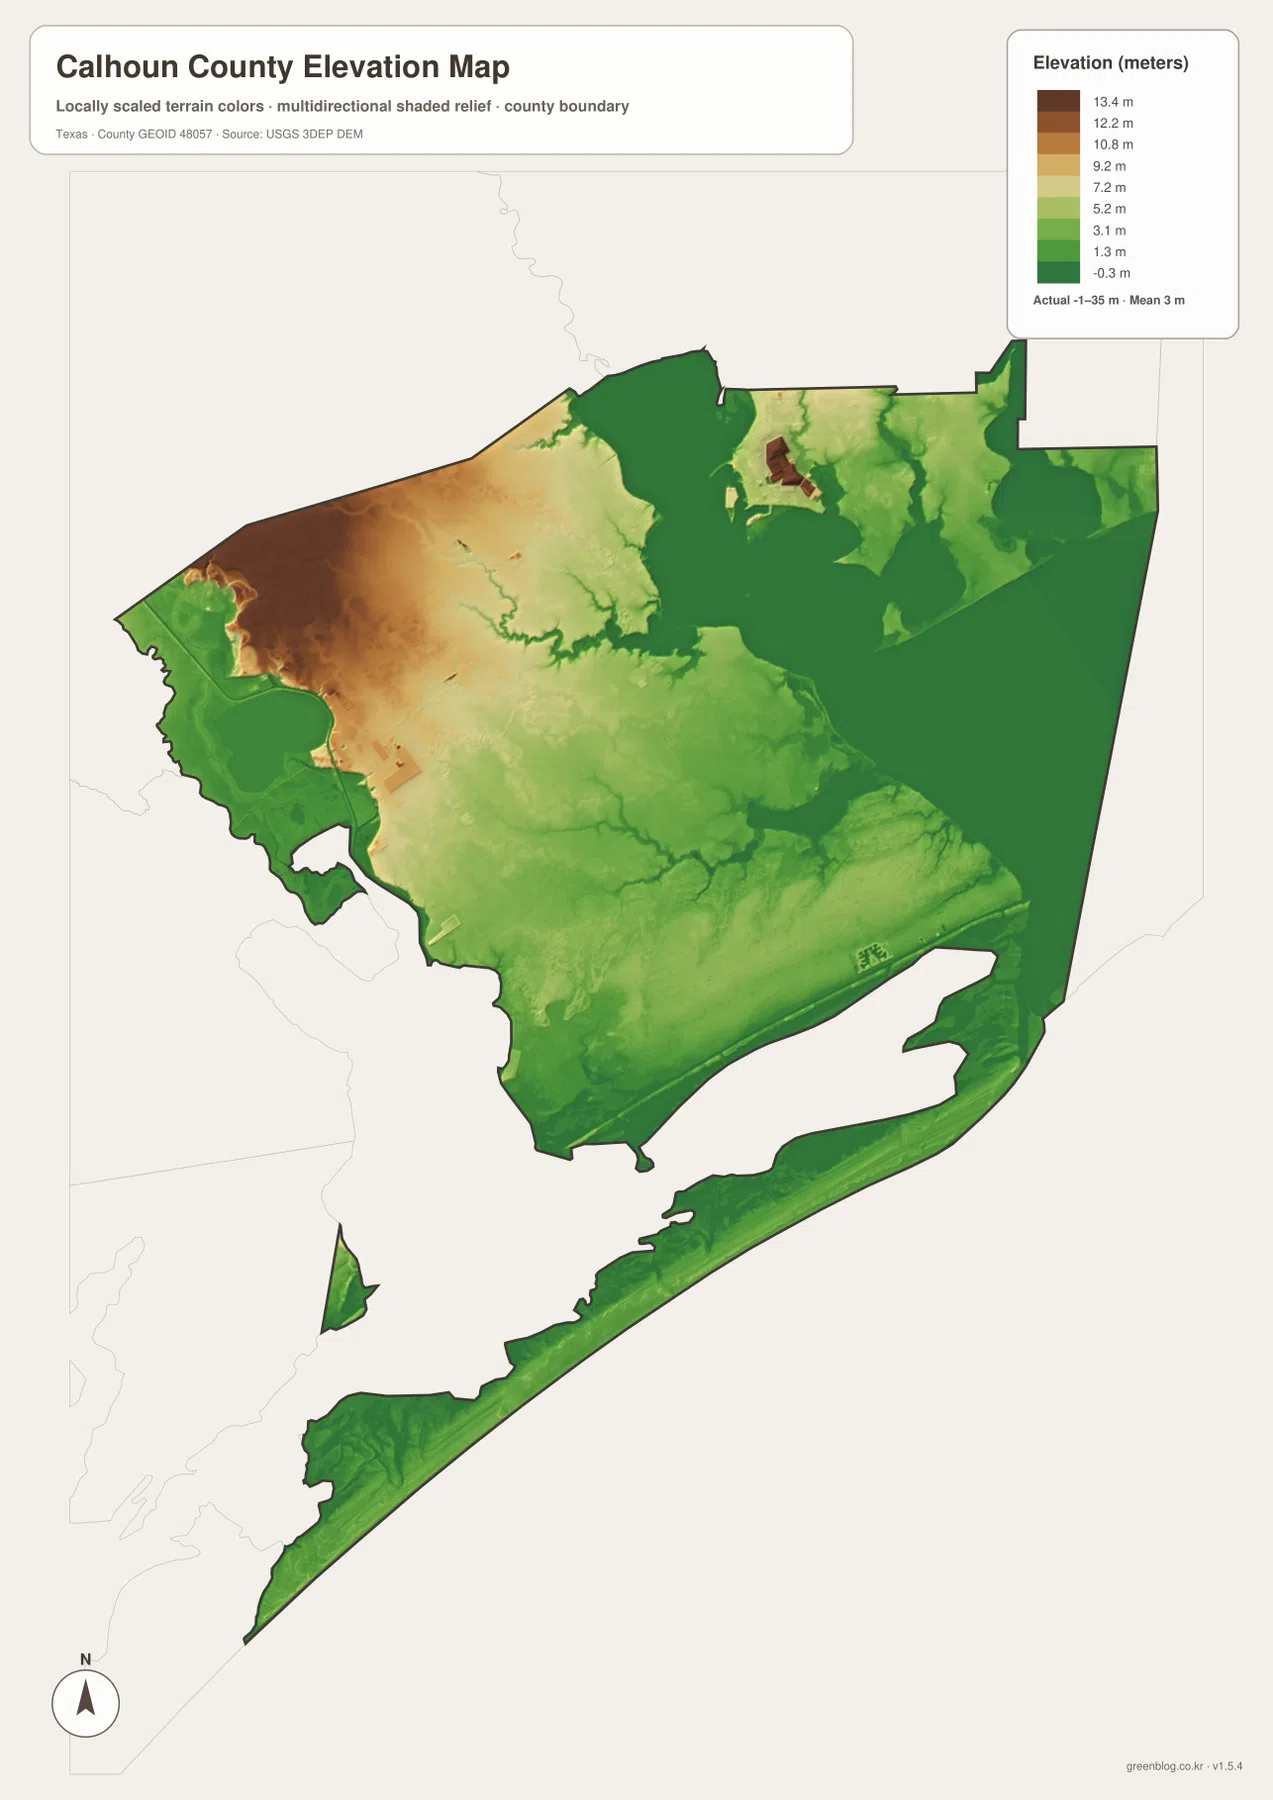
Comparing the water and elevation maps is especially useful. The broad shorelines around Lavaca Bay, Matagorda Bay, Espiritu Santo Bay, and San Antonio Bay correspond to extensive low areas, while the western interior contains more of the relatively elevated terrain. The elevation colors are intended for county-scale comparison, not for engineering, building design, flood insurance, or a survey of an individual parcel. For those purposes, a user would need a more specific dataset and the appropriate official or professional source.
Why straight-line distance can be misleading on this coast
Calhoun County has a coastline that repeatedly bends around bays and narrow land. This matters even on a simple reference map. Port Lavaca and Point Comfort are a good example: the city connection map shows that they are close, yet the water map shows a substantial bay between them. The same principle applies farther south, where Seadrift, Port O’Connor, and the long coastal strip occupy different sides of broad water bodies. A ruler can measure separation, but it cannot show whether the direct line crosses open water.
For that reason, travel-oriented reading should begin with the county map and then check the water map. Locate the destination, trace the numbered road that actually reaches it, and only then compare distance. This sequence prevents a common misunderstanding in coastal counties: assuming that two labels facing each other across a bay have a short direct road connection. Calhoun County’s geography rewards a route-first approach because shorelines, bays, and narrow coastal landforms control where roads can realistically go.
The four maps answer different questions about the same place
Port Lavaca illustrates the difference well. On the county map, it is a road and place-name reference surrounded by routes leading toward Point Comfort, Seadrift, and the outer coast. On the city map, it becomes the hub for a simple distance comparison. On the water map, its position on the western side of Lavaca Bay becomes the dominant fact. On the elevation map, the city sits within a generally low coastal setting. None of those views replaces the others; each removes some details and emphasizes a different relationship.
Seadrift works the same way. The county map places it near routes 238 and 185 in the southern mainland. The city map shows it roughly 15 miles from Port Lavaca in straight-line distance. The water map places the surrounding area close to San Antonio Bay and a dense network of small waterways, while the elevation map shows that the southern county is predominantly low. Looking up one community across all four maps is therefore an effective way to understand how transportation, water, and terrain overlap.
Choose the map according to the detail you need
Use the county map when you need roads, communities, nearby counties, and the overall boundary in one view. It is the best starting point for locating Port Lavaca, Point Comfort, Seadrift, Alamo Beach, Magnolia Beach, or Port O’Connor and seeing which numbered routes approach them. Use the city map when the goal is narrower: comparing the location and approximate straight-line spacing of Port Lavaca, Point Comfort, and Seadrift without the distraction of many other labels.
The water map is the stronger choice for identifying Lavaca Bay, Matagorda Bay, San Antonio Bay, Espiritu Santo Bay, or the named creeks crossing the mainland. The elevation map is useful when the question is not where a creek is named but whether an area is relatively low or high within the county. For classroom use, regional reference, or a printed handout, selecting the map that matches the question usually produces a clearer result than placing every possible layer on one image.
The county boundary follows a complicated coastal landscape
Calhoun County’s outline includes broad mainland areas as well as long narrow coastal pieces. On the county and city maps, the southern boundary stretches far along the coast and encloses land separated from the main interior by large bays. The eastern side also reaches around Matagorda Bay rather than following a neat straight line. This irregular shape is not a decorative detail; it explains why a small overview map can make the county look much larger from north to south than the distance between its main communities might suggest.
The water map is the best check when the boundary becomes hard to follow. Large labeled waters provide fixed reference points, while the elevation map shows that much of the long southern strip remains very low. By moving between these two maps, a reader can separate the shape of the land from the shape of the water around it. That is particularly helpful when preparing a regional map, comparing neighboring coastal counties, or simply trying to understand why the Calhoun County outline looks so different from nearby inland counties.
Frequently Asked Questions
Why do Port Lavaca and Point Comfort need both the road and water maps?
They are close in straight-line distance, but Lavaca Bay lies between them. The county map shows the practical road approach, while the water map makes the size and shape of the bay obvious. Using both prevents the false impression that a short line between the two labels is the same as a short road trip.
What does the Calhoun County elevation map say about the coast?
The legend reports an actual elevation range of about -1 to 35 meters and a mean near 3 meters. Most eastern and southern coastal areas appear in the low green colors, while relatively higher ground is more noticeable to the west and northwest. The map is intended for broad comparison, not parcel-level elevation or flood decisions.
Which bays are easiest to use as reference points?
Start with Lavaca Bay beside Port Lavaca, then move east to Matagorda Bay and south toward Espiritu Santo Bay and San Antonio Bay. Once those larger waters are located, smaller features such as Keller Bay, Mesquite Bay, Sixmile Creek, Cox Creek, and the Coloma creeks are much easier to place in context.
Map File Information
Download the four Calhoun County maps used on this page as original high-resolution A3 JPG files in one ZIP archive.
- File Type: JPG
Related Maps
- Aransas County Texas map
- Refugio County Texas map
- Victoria County Texas map
- Wharton County Texas map
- Austin County Texas map
Sources and References
For additional boundary, road, and place-name context, see U.S. Census Bureau TIGER/Line Shapefiles and USGS The National Map Viewer. Water-feature information can be checked through USGS National Hydrography, and the elevation-data program is described by the USGS 3D Elevation Program.
Green Map creates custom-edited map images using open geographic data sources such as geoBoundaries, Natural Earth, OpenStreetMap, and government open data.
These maps are edited visual materials, not raw data files, and are provided for education, documents, presentations, and graphic reference.