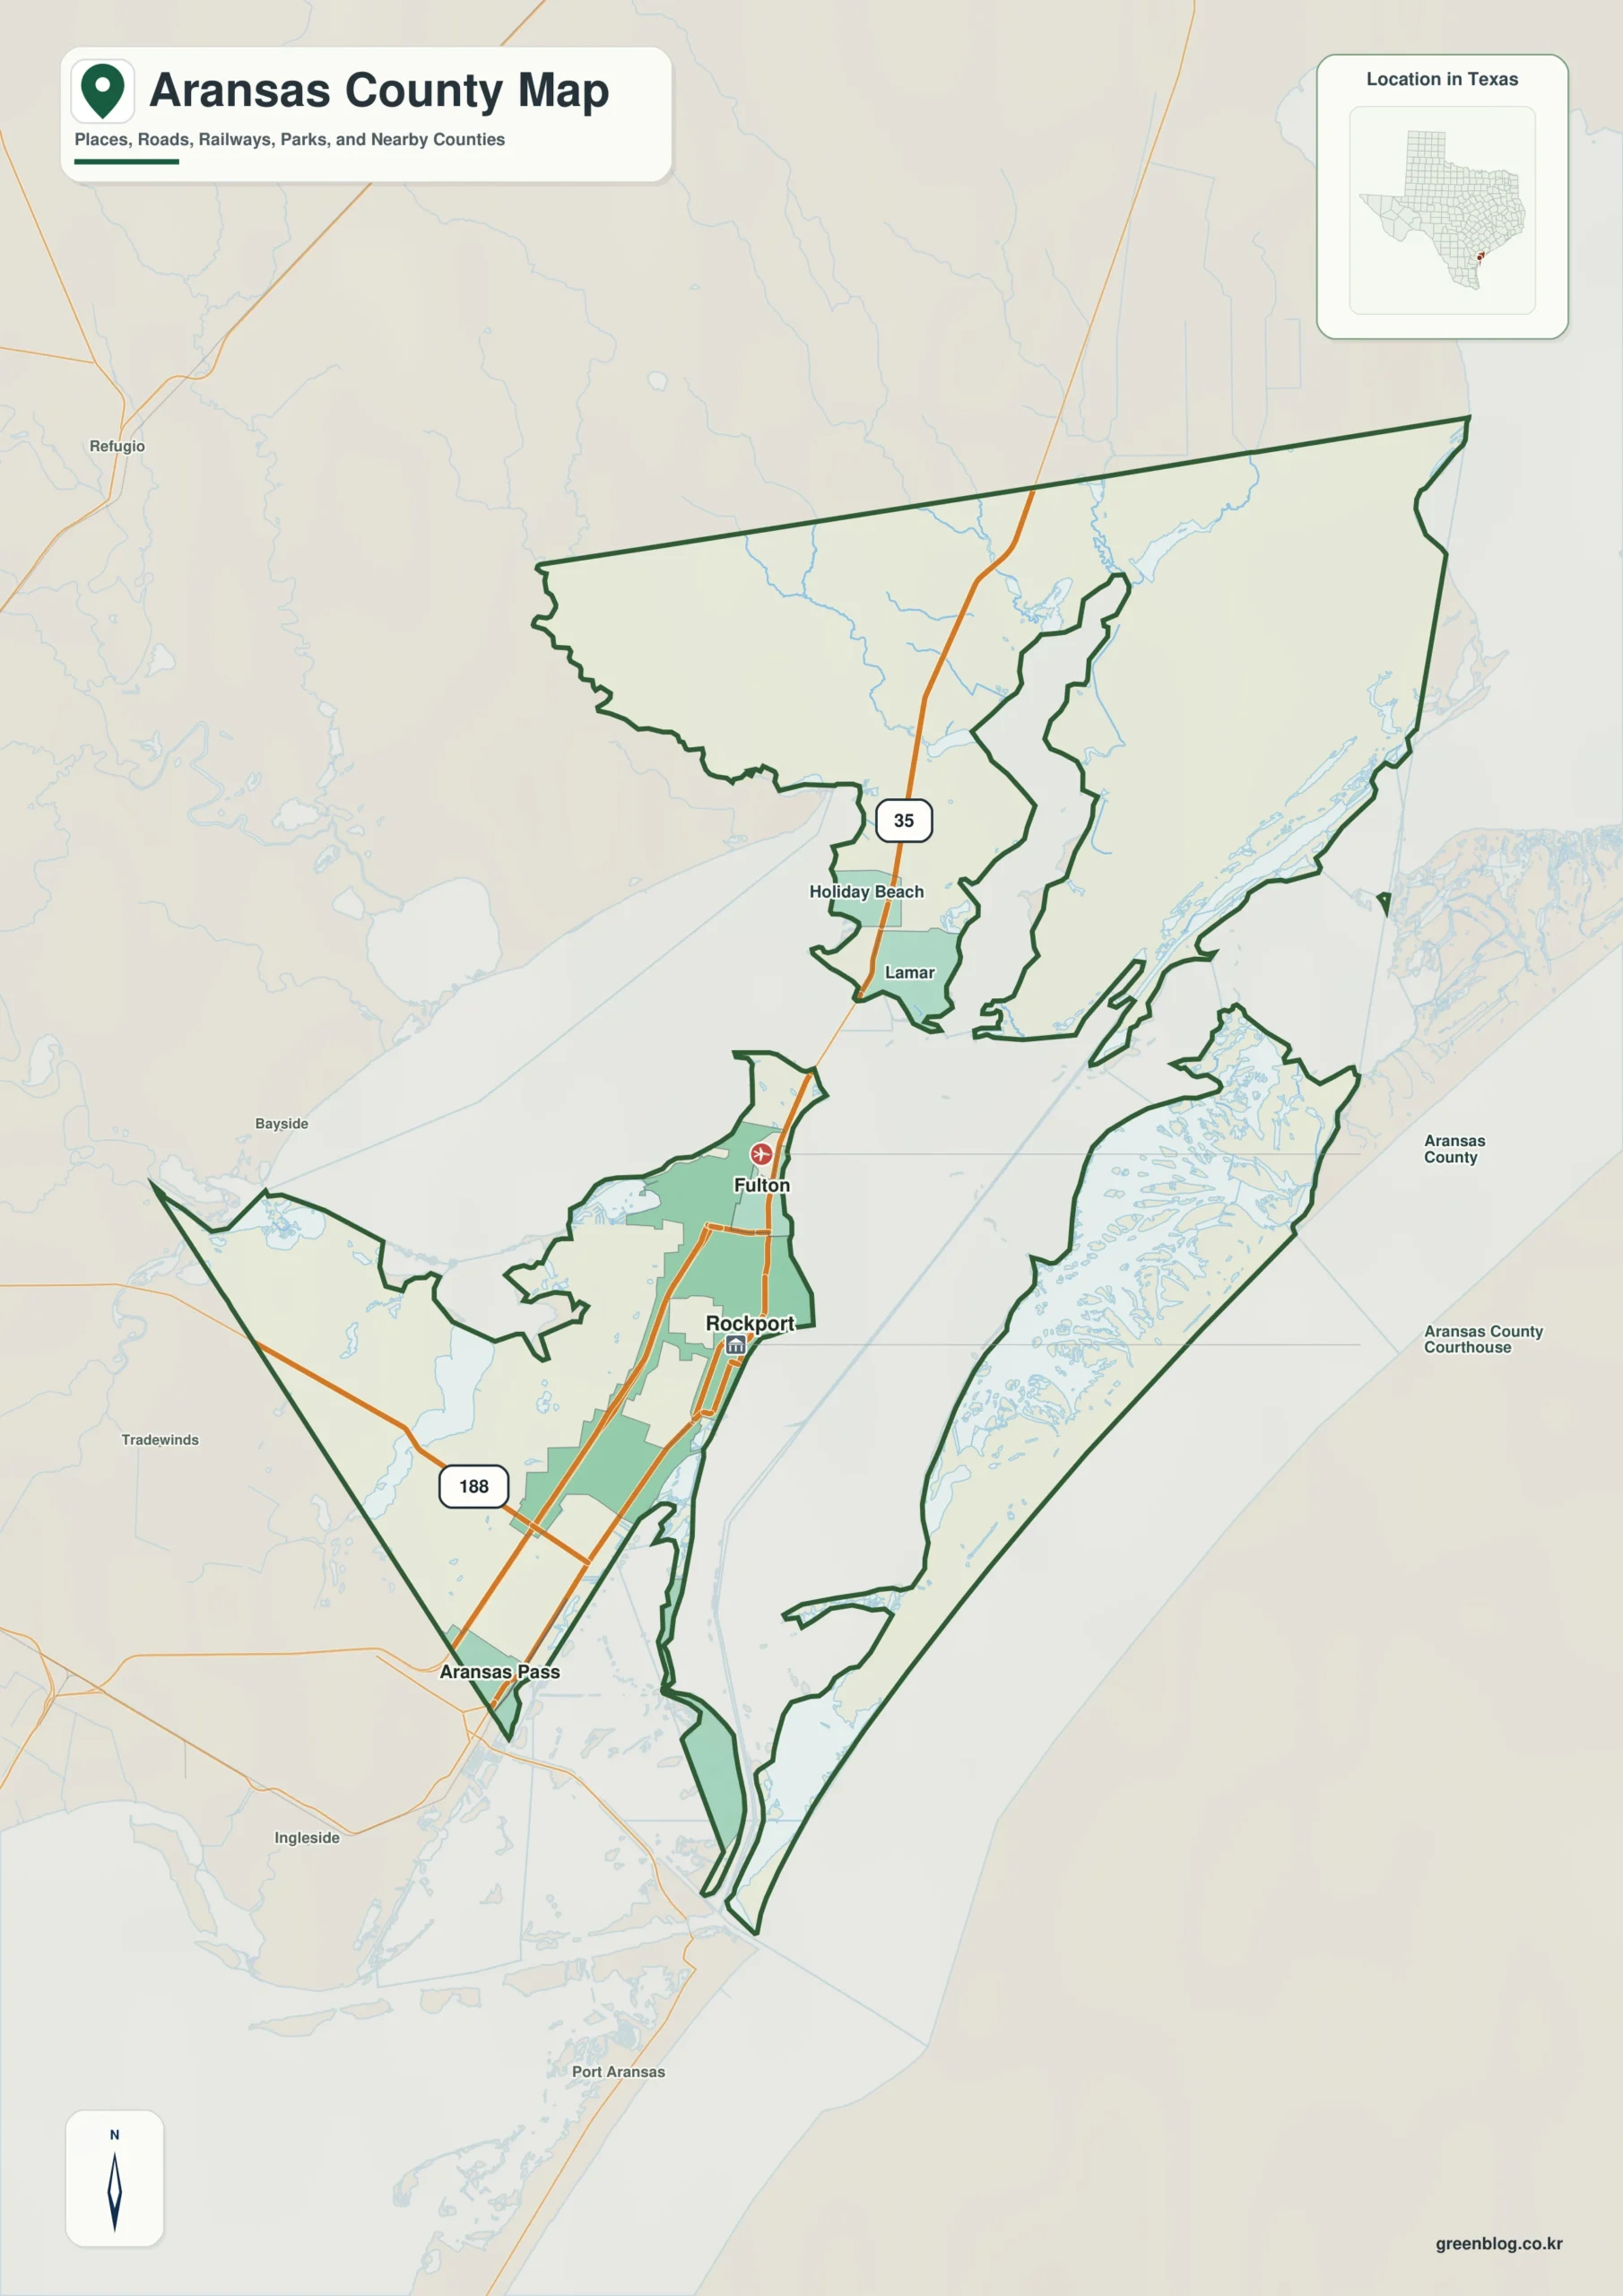
The Aransas County Map is easiest to understand by starting with water rather than with roads. Rockport and Fulton sit close together on the western shore of Aransas Bay, Lamar and Holiday Beach extend north toward Copano and St. Charles bays, and long, narrow St. Joseph Island forms the county’s eastern barrier. Those features break the county into separated pieces of mainland, peninsula, bay, and island, which is why its outline looks so different from a typical inland Texas county. This page lets you examine that geography through county, city, water, and elevation views, and you can download a ZIP containing four high-resolution A3 JPG maps directly from the page for printing or offline reference.
Aransas County lies on the Texas Gulf Coast northeast of Corpus Christi. The Handbook of Texas describes the county as being divided into three main parts by Copano, St. Charles, and Aransas bays, with Rockport serving as both the county seat and largest city. That description matches the supplied maps well. Most of the visible settlement and road network is concentrated on the western mainland and Live Oak Peninsula, while large expanses of bay water and the barrier island occupy much of the center and east. Reading the county therefore means keeping three reference points in mind at the same time: Rockport-Fulton, the chain of bays, and the very low coastal terrain.
Each map emphasizes a different part of that story. The general county view keeps Rockport, Fulton, Lamar, Holiday Beach, State Highway 35, surrounding places, and the irregular county boundary in one frame. The city view strips away much of that detail so the close relationship between Rockport and Fulton is immediately apparent. The water map brings forward Copano Bay, Aransas Bay, Mesquite Bay, Port Bay, Redfish Bay, smaller bays, and named creeks. Finally, the elevation surface shows how little vertical relief exists here: the supplied legend reports an actual range of about 0 to 13 meters and a mean near 3 meters.
Table of Contents
Rockport and Fulton anchor the west side of Aransas Bay
On the general county map, Rockport is the clearest starting point because its built-up area and road network stand out against the surrounding coastal landscape. Fulton is immediately north of Rockport along the same bay-side corridor, so the two places appear less like isolated centers and more like adjoining parts of one coastal settlement area. Farther north, State Highway 35 continues toward Holiday Beach and Lamar, while places outside the county such as Aransas Pass and Ingleside help orient the southern edge. The pattern is straightforward once the shoreline is included: settlement is concentrated on accessible mainland and peninsula corridors rather than spread evenly across the county.

The boundary is just as important as the place labels. The county touches inland areas toward Refugio County on the west and northwest, but broad bays cut deeply into its center. St. Joseph Island appears as a long, narrow eastern section separated from the mainland by Aransas Bay and related waters. At the south end, the Aransas Pass channel separates the island from Mustang Island and connects the protected bay system with the Gulf. Because of that mix of mainland, peninsula, open water, and barrier island, a simple rectangular county outline would be misleading; the coastline is part of the county’s basic geography.
Why Rockport works as the best reference point
Rockport is the county seat, but its usefulness on the map goes beyond the administrative label. Aransas Bay is immediately to the east, Fulton is just to the north, State Highway 35 passes through the developed corridor, and the routes toward Lamar and Holiday Beach continue from that same general line. If you are trying to locate a smaller community, a bay, or a section of shoreline, finding Rockport first and then moving north, south, or across the bay gives the rest of the county a much clearer frame of reference.
The city map reduces the county to its two ranked urban centers
The city map deliberately simplifies the picture. It ranks Rockport first and Fulton second and places both on the same western side of Aransas Bay. Rockport has the larger mapped urban footprint, while Fulton sits immediately to the north. That simple arrangement makes a useful point that can be harder to see on a road-heavy basemap: most of the county’s major urban activity is concentrated in a very small part of its total mapped area. The broad northern tract, the bays, and St. Joseph Island do not show a comparable concentration of major cities.

State Highway 35 helps explain why those settlements line up the way they do. The Handbook of Texas lists SH 35 and SH 361 among the county’s principal highways, along with several farm roads. In the supplied county map, SH 35 runs through Rockport and Fulton before continuing north toward Lamar and Holiday Beach, while Highway 188 approaches the Rockport area from the west. The road pattern is not a dense countywide grid. Instead, a few important routes connect the limited buildable mainland and peninsula sections between bays and wetlands.
Copano and Aransas bays explain the county shape better than any road
The water map makes the county’s unusual form immediately understandable. Copano Bay occupies the broad northwest opening, while Aransas Bay fills much of the central and southern water space between the mainland and St. Joseph Island. Mission Bay appears to the west of northern Copano Bay, Mesquite Bay lies along the northeastern side of the system, Port Bay sits west of the Rockport-Fulton area, and South Bay and Redfish Bay mark the southern waters. These names are not minor decoration: together they show why the county is divided into separated pieces and why much of its boundary follows shoreline rather than straight land lines.

The northern mainland also contains smaller channels such as Cavasso Creek, Salt Creek, Twin Creek, and Burgentine Creek. None dominates the county like a major inland river, but together they show how shallow drainage routes feed the surrounding bays across a low coastal plain. This distinction matters when using the map. A bay, creek, marsh edge, and navigation channel may all appear in blue, yet they do not have the same scale or function. The supplied water map is a geographic reference, not a flood-risk map, parcel map, legal-boundary survey, or navigation chart, so it should not be used to make those specialized decisions.
Goose Island helps explain the Lamar end of the peninsula
The Lamar area becomes easier to place when Goose Island State Park is added to the picture. Texas Parks and Wildlife describes the park as sitting at the southern tip of Lamar Peninsula amid the bays and estuaries of the Texas Gulf Coastal Bend, with St. Charles Bay and Aransas Bay on either side. The park’s combination of live oak woods, shell ridge, marshland, mud flats, and bay shoreline is a useful real-world example of the landscape suggested by the water map. Lamar is therefore not simply a place north of Rockport; it occupies a narrow coastal setting where land, bays, and wetlands meet.
A 0–13 meter elevation range reveals how flat the coast really is
The elevation map adds an important detail that a road or water map cannot show. Its legend reports an actual elevation range of roughly 0 to 13 meters, with a mean of about 3 meters. The warmer brown and tan colors occur mainly on the western inland edge and a few slightly raised strips, while the shorelines, wetlands, and much of St. Joseph Island remain in lower green classes. In other words, the color changes represent gentle coastal relief rather than mountains or deep valleys. Even the higher parts of the county are low by Texas standards.

The Handbook of Texas gives a broader county elevation description of sea level to about 50 feet, or roughly 15 meters, which is consistent with the general low-relief character shown here even though the exact upper value differs from the locally scaled map. The most useful way to read this image is therefore comparatively: look for where the western mainland rises slightly above the bay margins, then notice how low the barrier island and marshy shoreline remain. The surface is appropriate for regional orientation and visual comparison, but it is not survey-grade elevation and should not be used for construction, drainage engineering, or legal measurements.
Choose the map by the question you are trying to answer
If your main goal is to locate Rockport, Fulton, Lamar, Holiday Beach, State Highway 35, and the county boundary in one view, start with the general county map. The city view is better when you only need to see how tightly Rockport and Fulton are grouped. Use the water map when the question is about Copano Bay, Aransas Bay, St. Joseph Island, smaller bays, or the named creeks on the northern mainland. The elevation map becomes most useful when you want to see why so much of the landscape is visually tied to water: almost the entire county lies only a few meters above sea level.
- Places and roads: use the county map for Rockport, Fulton, Lamar, Holiday Beach, SH 35, and nearby orientation points.
- Urban concentration: use the city map to compare the close Rockport-Fulton pair without the extra road and water detail.
- Bays and shoreline: use the water map for Copano Bay, Aransas Bay, Mesquite Bay, Port Bay, Redfish Bay, and named creeks.
- Relative height: use the elevation map to compare the slightly higher western mainland with the very low shore and barrier island.
The downloadable archive is the better choice when you need full-size files rather than screen previews. It contains four separate A3 JPG images, so you can print one map, compare several maps side by side, or keep the set offline. The water and elevation products remain general reference maps, however; specialized flood, marine navigation, parcel, engineering, or emergency planning work should rely on the appropriate official datasets and professional products.
Frequently Asked Questions
How close are Rockport and Fulton on the map?
They are immediately adjacent along the western side of Aransas Bay. Rockport appears just south of Fulton, and both sit on the same main coastal road corridor, so the city map presents them as a closely connected pair rather than widely separated county centers.
Why does Aransas County look like several separate pieces?
Large bays divide the land. Copano, St. Charles, and Aransas bays separate the mainland and peninsula sections, while St. Joseph Island forms a long barrier-island part of the county to the east. The result is a county outline made of shoreline, narrow connections, and water-separated land rather than one compact block.
What is the main point of the Aransas County elevation map?
The striking feature is not a high ridge but the lack of major relief. The supplied surface shows roughly 0 to 13 meters with a mean near 3 meters, so the most useful comparison is between the slightly higher western mainland and the very low bay margins, wetlands, and barrier island.
Map File Information
The ZIP below contains all four Aransas County maps described on this page as high-resolution A3 JPG files. They are separate from the WebP images used for on-screen viewing and are suitable for printing, classroom reference, regional comparison, and offline use.
- Included Files: county map, city map, water map, elevation map
- File Type: ZIP containing four high-resolution A3 JPG files
Related Maps
Sources and References
County location, the role of Rockport, highway context, and the division of the county by major bays were checked against the Handbook of Texas entry for Aransas County and the official Aransas County website. The Lamar Peninsula and coastal habitat context was also compared with the Texas Parks and Wildlife Department page for Goose Island State Park.
General public mapping references include U.S. Census Bureau TIGER/Line, USGS National Hydrography, and the USGS 3D Elevation Program. The relationship between Aransas Bay and St. Joseph Island is also described in the Handbook of Texas entry for Aransas Bay.
Green Map creates custom-edited map images using open geographic data sources such as geoBoundaries, Natural Earth, OpenStreetMap, and government open data.
These maps are edited visual materials, not raw data files, and are provided for education, documents, presentations, and graphic reference.