Clarksville gives the Montgomery County Tennessee map an unusually clear center of gravity. The city occupies a broad area near the northern half of the county, while the Cumberland River makes a wide series of bends just south and west of the urban core. The Red River approaches from the northeast, several numbered highways converge around Clarksville, and the county’s northern edge meets the Tennessee–Kentucky state line. High-resolution A3 JPG versions of the county, city, water, and elevation maps are available to download together in one ZIP file.
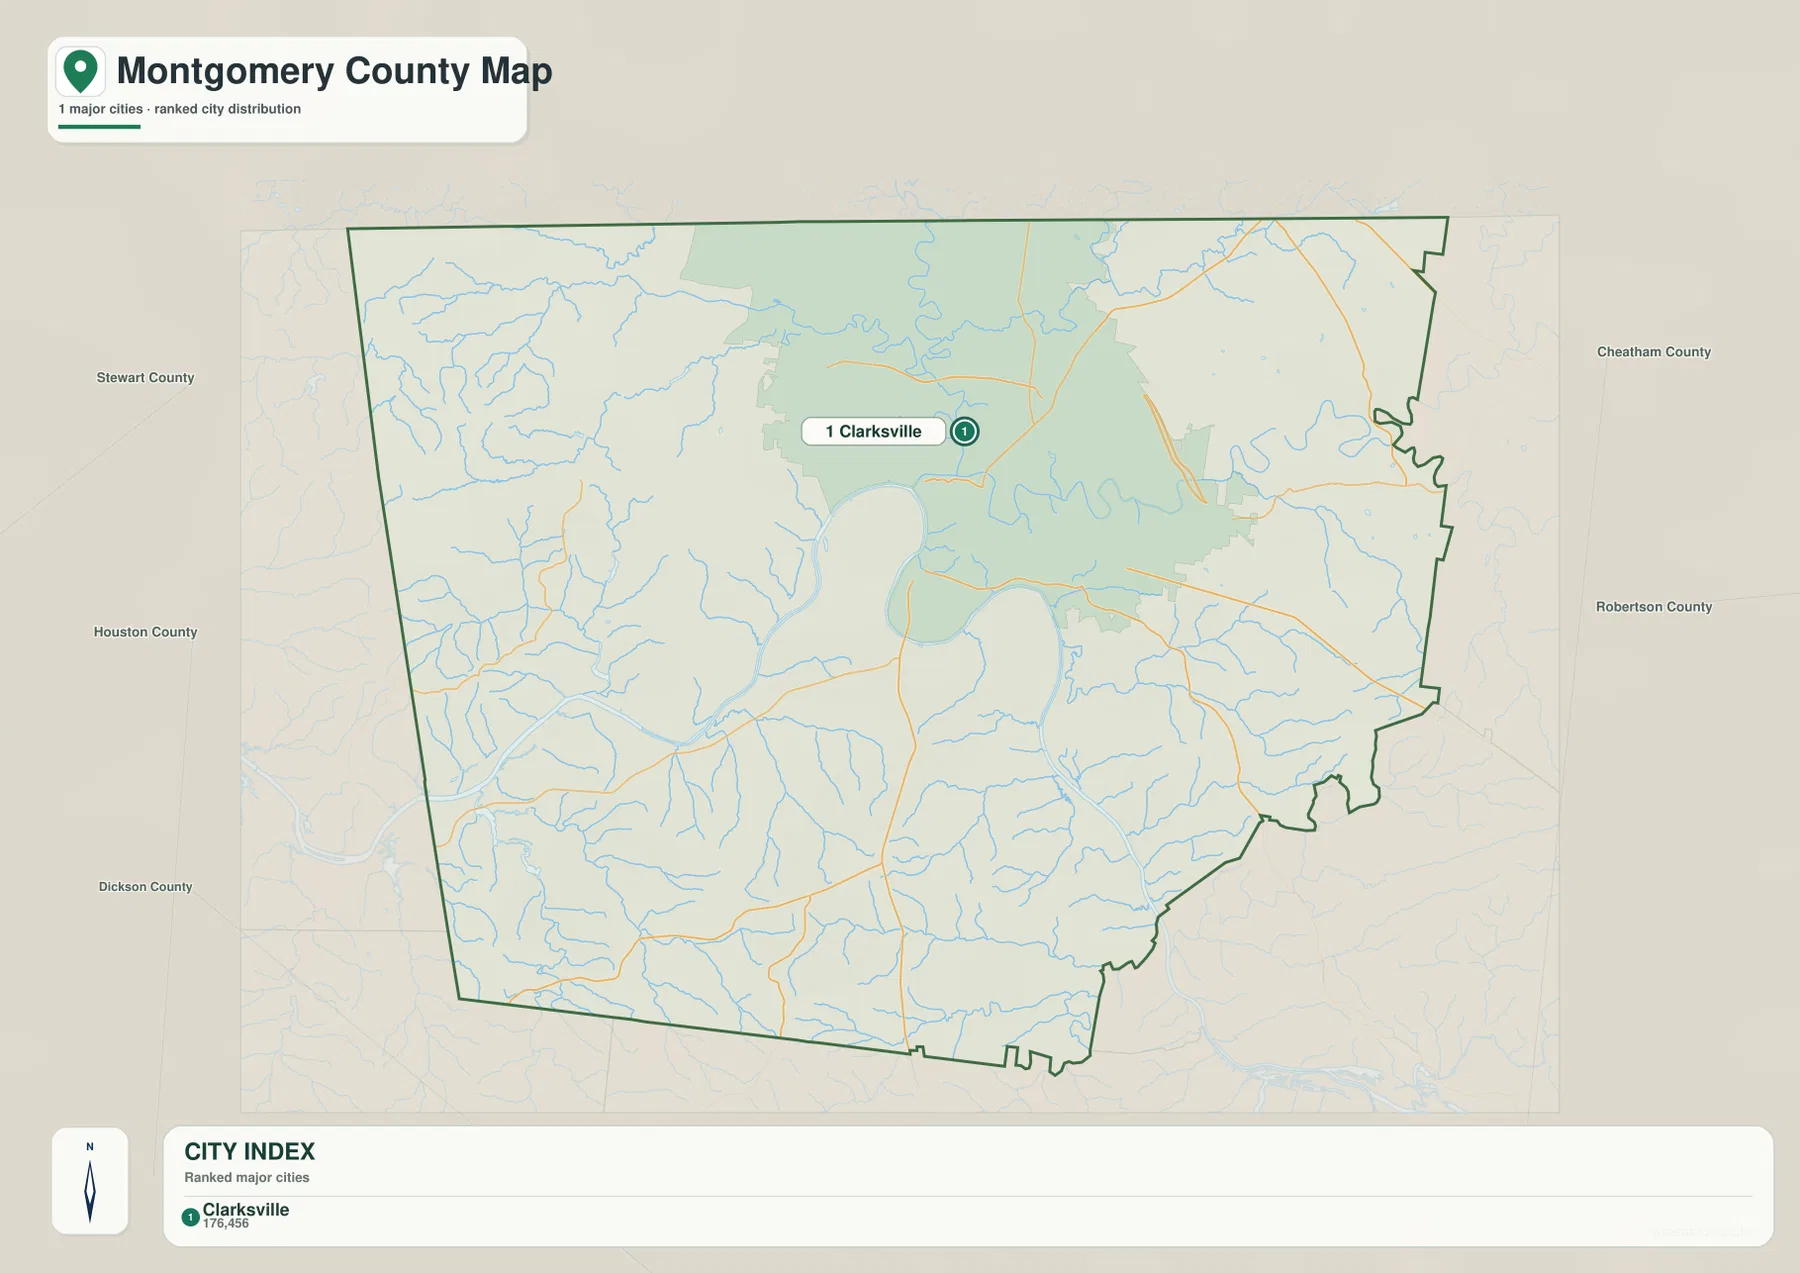
The four views are useful for different questions without forcing every layer onto one page. The general county sheet is best for roads, public landmarks, and the boundary; the city sheet strips the view down to the ranked urban center; the water sheet follows the Cumberland and Red River systems; and the elevation sheet shows how low river valleys sit between higher hills. Taken together, they explain why Montgomery County looks much more varied than a simple outline map suggests.
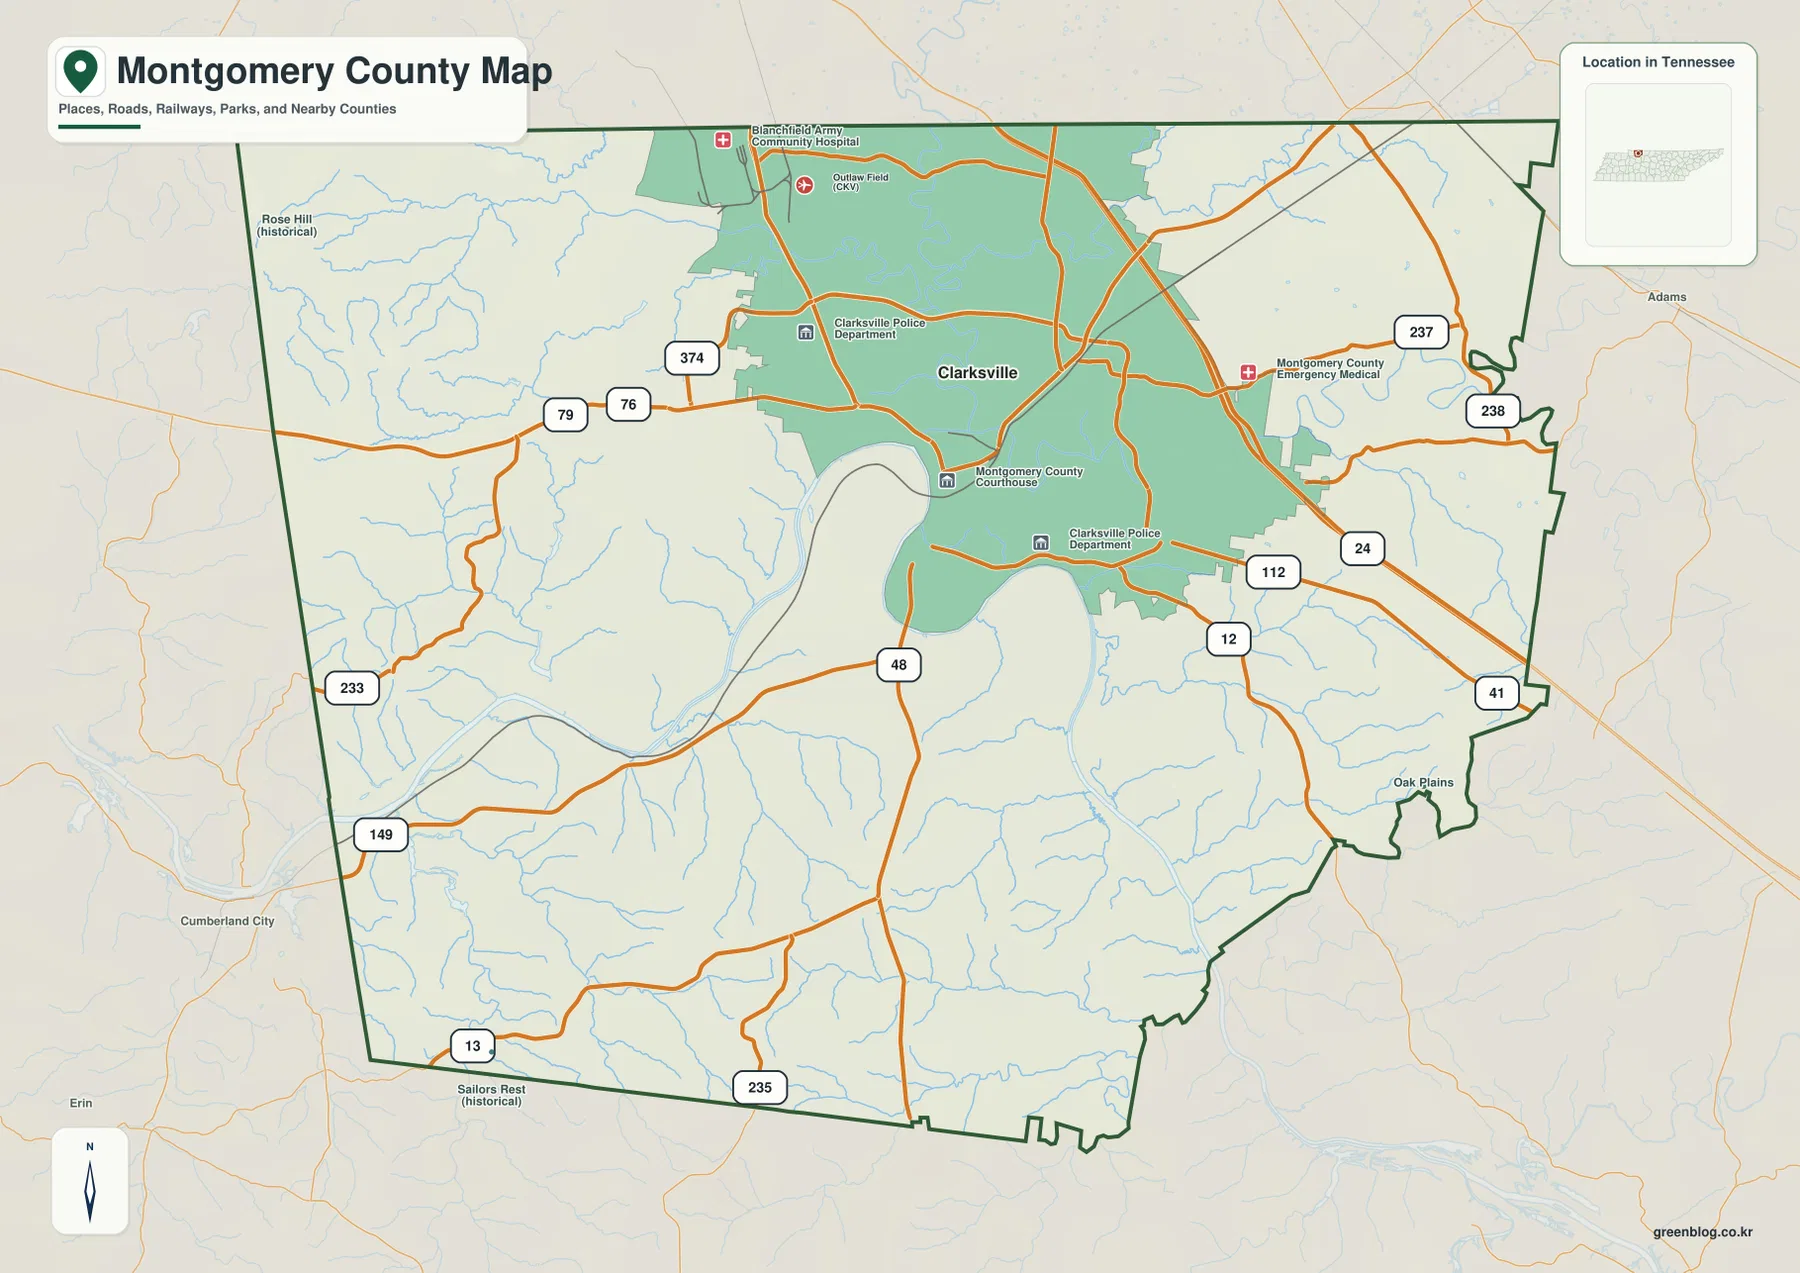
Table of Contents
Start with Clarksville and the northern county line
Clarksville is the most prominent place on the general map and the only ranked major city on the city map. Its mapped urban area spreads across the north-central and northeastern part of Montgomery County, reaching close to the Kentucky line. The county reference sheet also marks the Montgomery County Courthouse, police facilities, emergency medical services, Outlaw Field, and the Fort Campbell area near the northern edge. Those labels make it easy to distinguish the urban core from the more rural western and southern parts of the county.
The city map simplifies the picture even further. Clarksville is the single numbered city, while Stewart County, Houston County, Dickson County, Cheatham County, and Robertson County appear outside the boundary as directional references. That sparse design is useful when the goal is to show where the county’s main urban concentration sits without competing road and terrain labels. It also makes the asymmetric shape of the county easier to notice, especially along the irregular eastern and southeastern boundary.
Roads radiate from Clarksville in several directions
The county map shows a dense road network around Clarksville and a looser pattern farther south and west. I-24 is a major reference on the eastern side of the city, while US 79 and US 41 are part of the broader route system identified in the package. Other numbered roads visible on the map include 12, 13, 48, 76, 112, 149, 233, 235, 237, 238, and 374. Rather than treating them as a list, it is more useful to notice how they fan out from Clarksville toward the eastern boundary, the Cumberland River crossings, and the rural southern half of the county.
The northern edge deserves special attention because the transportation pattern continues across the state line. Roads around Clarksville and Fort Campbell do not stop simply because the county outline does. On the opposite side of the county, routes toward Robertson and Cheatham counties leave the urban area through a narrower eastern boundary. To the west and southwest, the road pattern becomes more dispersed as it approaches Stewart, Houston, and Dickson counties.
The package also identifies Montgomery County as FIPS 47125 and lists Clarksville as the county seat. Its countywide population was 220,012 in the 2020 census, with a July 2025 estimate of 249,935. Those figures describe the whole county, not the footprint of the shaded Clarksville urban area, so they are most useful as background rather than as a way to infer neighborhood density from the map.
The Cumberland River bends around a network of tributaries
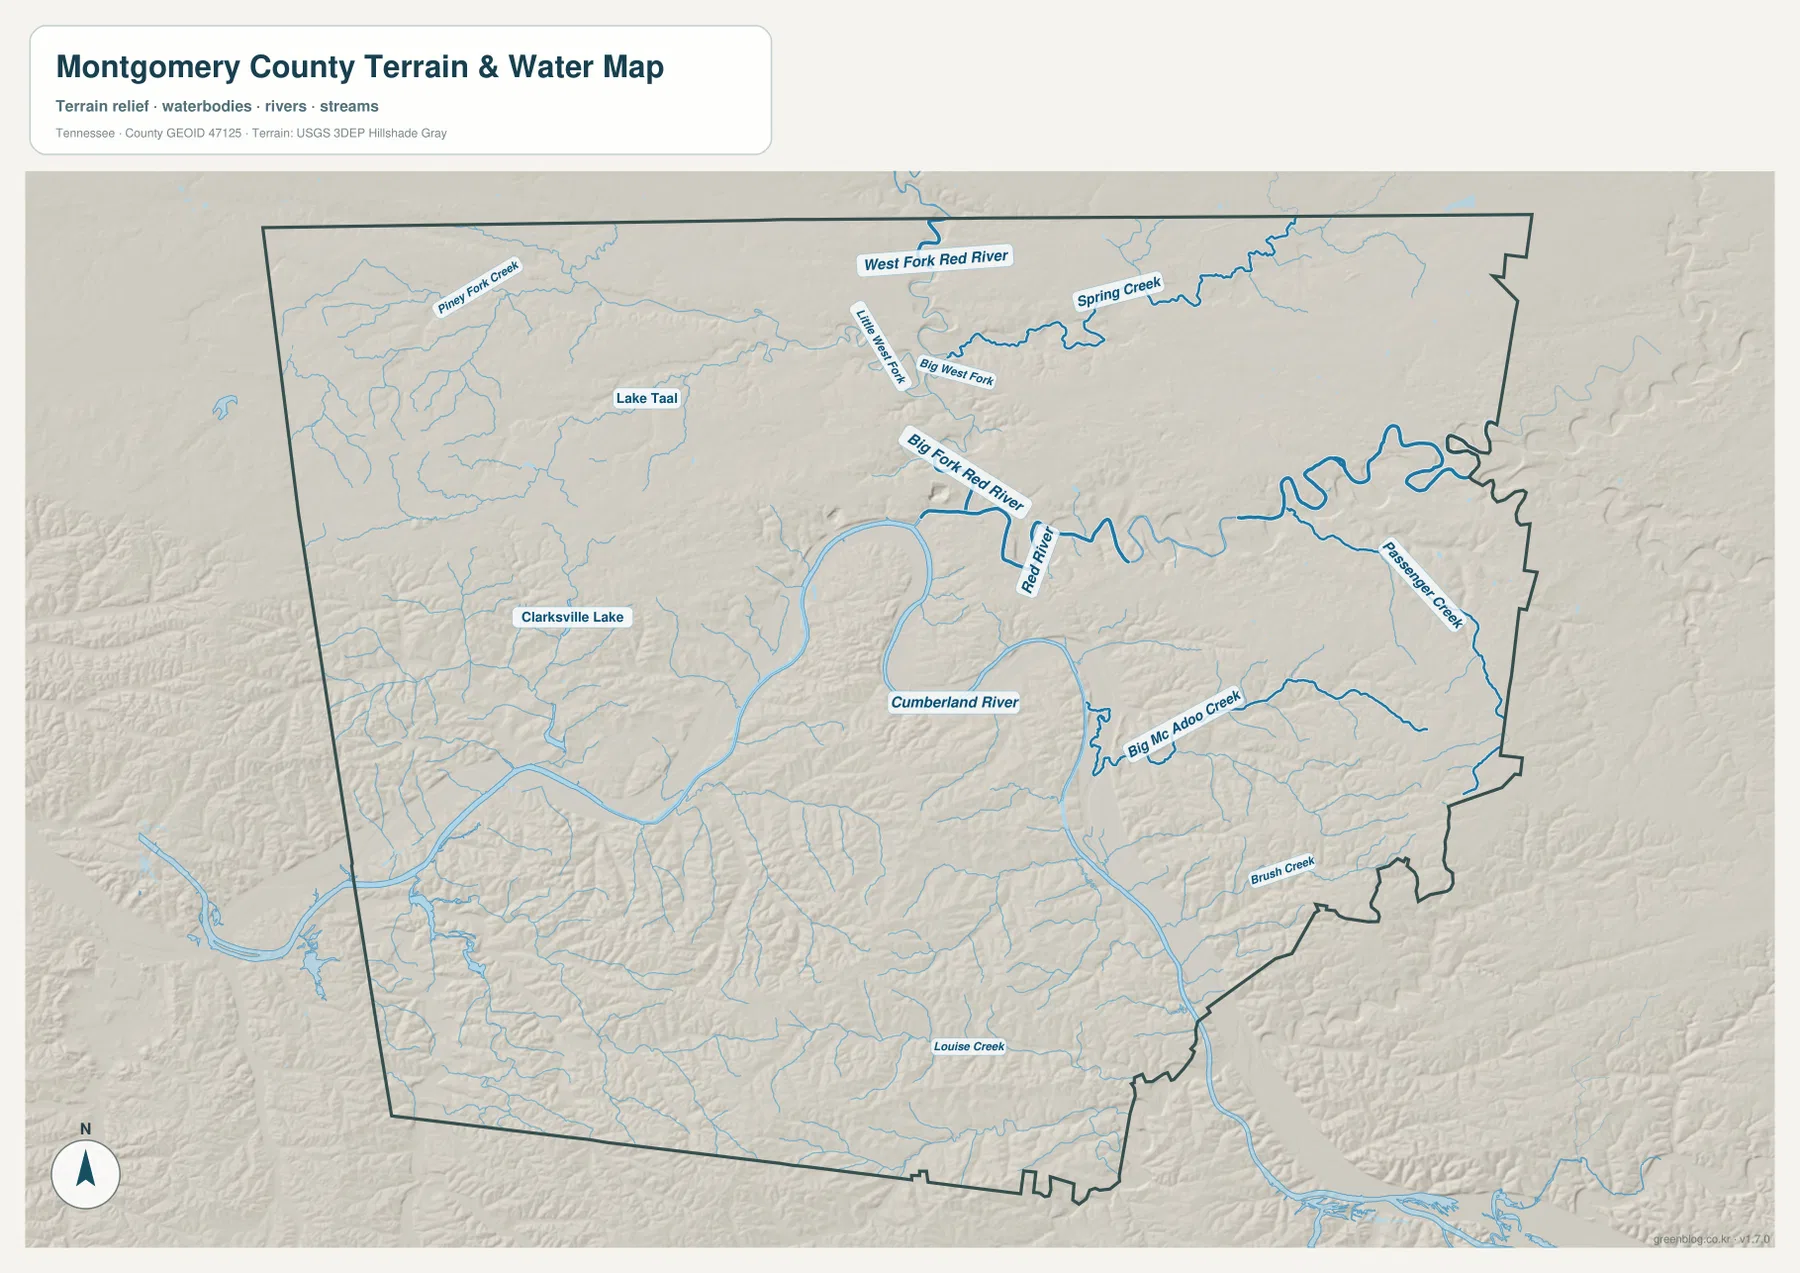
The water map is dominated by the Cumberland River. It enters the county’s central landscape as a broad waterway, makes several large bends near Clarksville, and continues westward through a low valley. The scale of those bends matters: on the general map they divide parts of the urban and rural road network, while on the terrain sheet they appear as one of the county’s lowest continuous corridors.
North of the Cumberland, the Red River system is more branched. West Fork Red River, Big Fork Red River, Big West Fork, Little West Fork, and Spring Creek are labeled across the northern portion of the water map. The Red River then winds through the eastern side before approaching Clarksville. This creates a second major drainage corridor that is visually distinct from the much broader Cumberland channel.
Several smaller streams help fill in the eastern and southern landscape. Passenger Creek follows the eastern side, Big McAdoo Creek extends through the east-central area, Brush Creek appears farther south, and Louise Creek is labeled near the southern edge. Piney Fork Creek is marked in the northwest. These tributaries explain why the shaded-relief background is cut by so many narrow valleys even where no large town is shown.
Elevation separates the river valleys from the surrounding hills
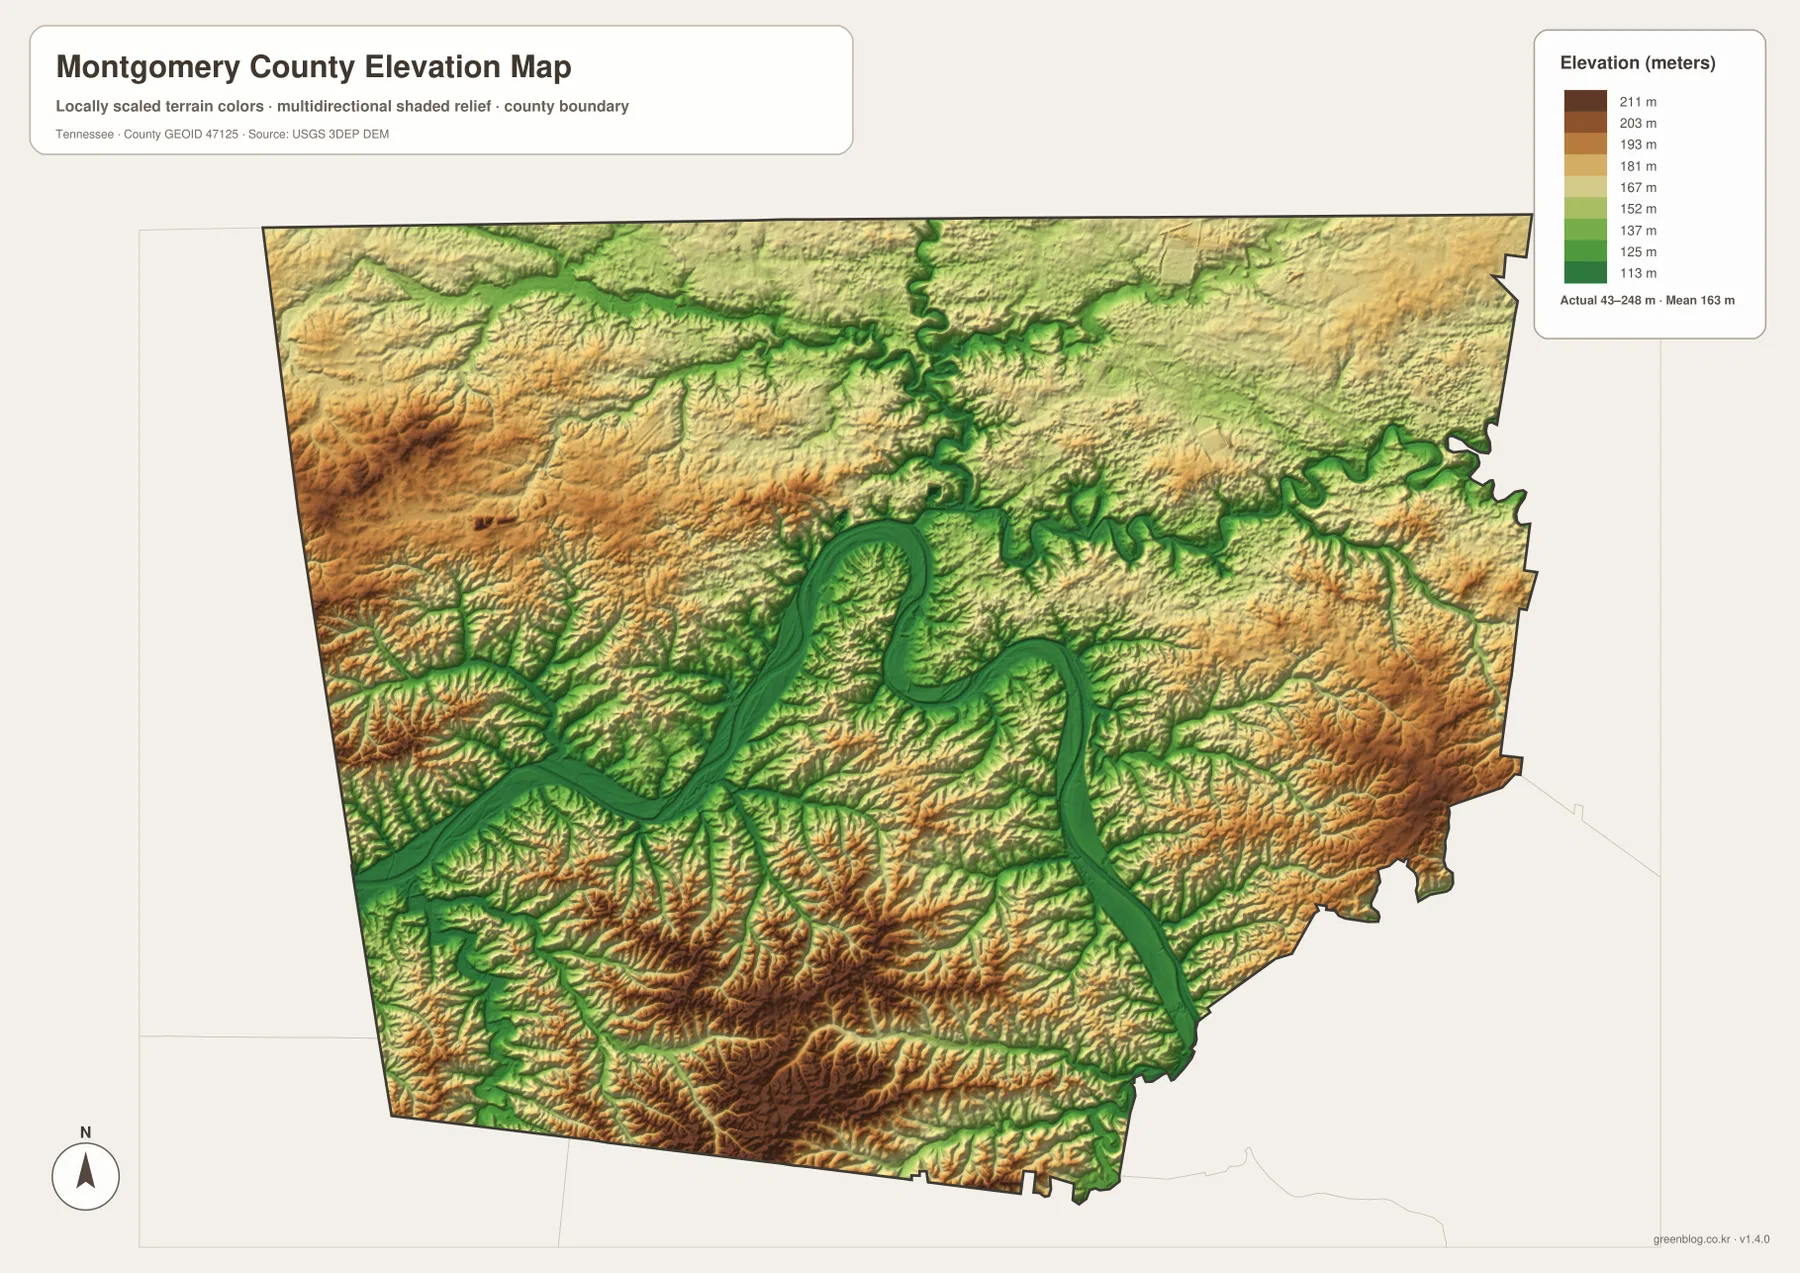
The elevation map gives an actual county range of about 43 to 248 meters and a mean of about 163 meters. The lowest greens follow the Cumberland River and Red River valleys almost continuously. Higher yellow, orange, and brown terrain appears away from those channels, especially in the west, southwest, south, and along parts of the eastern side. The result is a county where the largest watercourses sit in broad low corridors surrounded by dissected hills.
The Cumberland’s looping course is especially easy to trace in the elevation view because the low valley mirrors every major bend. North of the river, the Red River and its forks create another green network. South of Clarksville, numerous narrow tributary valleys cut into higher ridges, producing a much more textured surface than the relatively broad river bottoms near the city.
This relief helps explain the road pattern on the county sheet. Routes across the southern half of Montgomery County cross a succession of small valleys and ridges, while roads near the Cumberland often follow or cross lower terrain. The elevation map is therefore most useful when it is compared directly with the road and water maps rather than read as a stand-alone color scale.
County facts that help interpret the maps
- County seat: Clarksville
- FIPS code: 47125
- 2020 census population: 220,012
- July 2025 population estimate: 249,935
- Gazetteer area: 539.2 square miles of land and 4.7 square miles of water
- Elevation shown on the map: about 43–248 m, mean about 163 m
- Major mapped waterways: Cumberland River, Red River, Spring Creek, Big McAdoo Creek
The area figures are a useful reminder that a small water-area percentage does not mean water has little geographic influence. The Cumberland River alone runs through a large portion of the county and creates long bends that shape crossings, lowlands, and the appearance of Clarksville’s surroundings. Countywide population totals work the same way: they provide scale, but the city and terrain maps are needed to understand where the main urban concentration and physical barriers actually lie.
Which map works best for each task?
Use the county reference map when you need a single page with Clarksville, roads, the county outline, public landmarks, and nearby places. It is the most useful starting point for presentations, county overviews, and annotations. The city map is better when the purpose is simply to show the location of Clarksville within Montgomery County and the directions of neighboring counties.
Choose the water map for river and creek questions. It removes much of the urban detail and makes the Cumberland and Red River systems easier to follow from one side of the county to the other. For terrain comparisons, the elevation map adds the missing vertical dimension by showing the low river corridors against higher hills. Printing the A3 JPGs at their original ratio preserves the labels and gives enough room to add notes or route markings on a separate copy.
These are static county-reference maps, not live navigation or legal survey products. Current road closures, flood stages, military access restrictions, property boundaries, and emergency conditions can change independently of the files. Use the maps for orientation and explanation, then consult the appropriate official agency when a decision depends on current conditions.
Frequently Asked Questions
Where is Clarksville on the Montgomery County map?
Clarksville occupies a large north-central to northeastern area of the county, close to the Tennessee–Kentucky line. The Cumberland River bends around the city’s southern and western side, while major roads converge from several directions. The county reference map also marks the courthouse and other public facilities around the urban area.
What is the easiest way to tell the Cumberland River from the Red River?
The Cumberland River is the much broader waterway with large looping bends through the center of the county. The Red River is narrower and approaches from the northeast, where several labeled forks and creeks join it. The water map names both rivers directly, so the two drainage systems can be compared without relying on road labels.
How much elevation change does Montgomery County have?
The elevation map reports an actual range of about 43 to 248 meters, with a mean near 163 meters. The lowest terrain closely follows the Cumberland and Red River valleys, while higher hills are more common toward the western, southern, and outer eastern parts of the county.
Sources and reference data
- Tennessee State Library and Archives — Montgomery County fact sheet
- Tennessee DOT — Montgomery County road reference
- U.S. Census Bureau QuickFacts — Montgomery County, Tennessee
- U.S. Census Bureau TIGER/Line boundary data
- USGS National Hydrography
- USGS 3D Elevation Program
Map File Information
The download ZIP contains four high-resolution A3 JPG files: county, city, water, and elevation maps. They can be printed at the original ratio or reused in presentations and location-reference materials.
- Included Versions: County, city, water, and elevation
- Included Files: 4 JPG map files
Related Maps
Green Map creates custom-edited map images using open geographic data sources such as geoBoundaries, Natural Earth, OpenStreetMap, and government open data. These maps are edited visual materials, not raw data files, and are provided for education, documents, presentations, and graphic reference.