Refugio County is easiest to understand by starting with Refugio in the interior and then following the road network toward Woodsboro, Bayside, Tivoli, and Austwell. This page brings those locations together with the county’s streams, bays, and low coastal terrain. You can also download the high-resolution A3 JPG map files in a ZIP archive from the map file box below.
The maps show a county that changes gradually from slightly higher inland ground in the west and northwest to very low terrain near the bays in the south and east. Refugio and Woodsboro form a useful inland reference line, while Bayside and Austwell sit much closer to large coastal water bodies. Looking at the road, water, and elevation maps together makes those differences much easier to see than reading place names alone.
Table of Contents
Refugio as the road reference point
Refugio appears near the central-western part of the county and serves as the clearest starting point on the general map. U.S. 77 and 77A pass through the Refugio area, while U.S. 183 approaches from the northwest and Route 202 reaches the area from the west. Woodsboro lies to the south along the same general travel corridor, so the two communities are easy to compare on a single view.
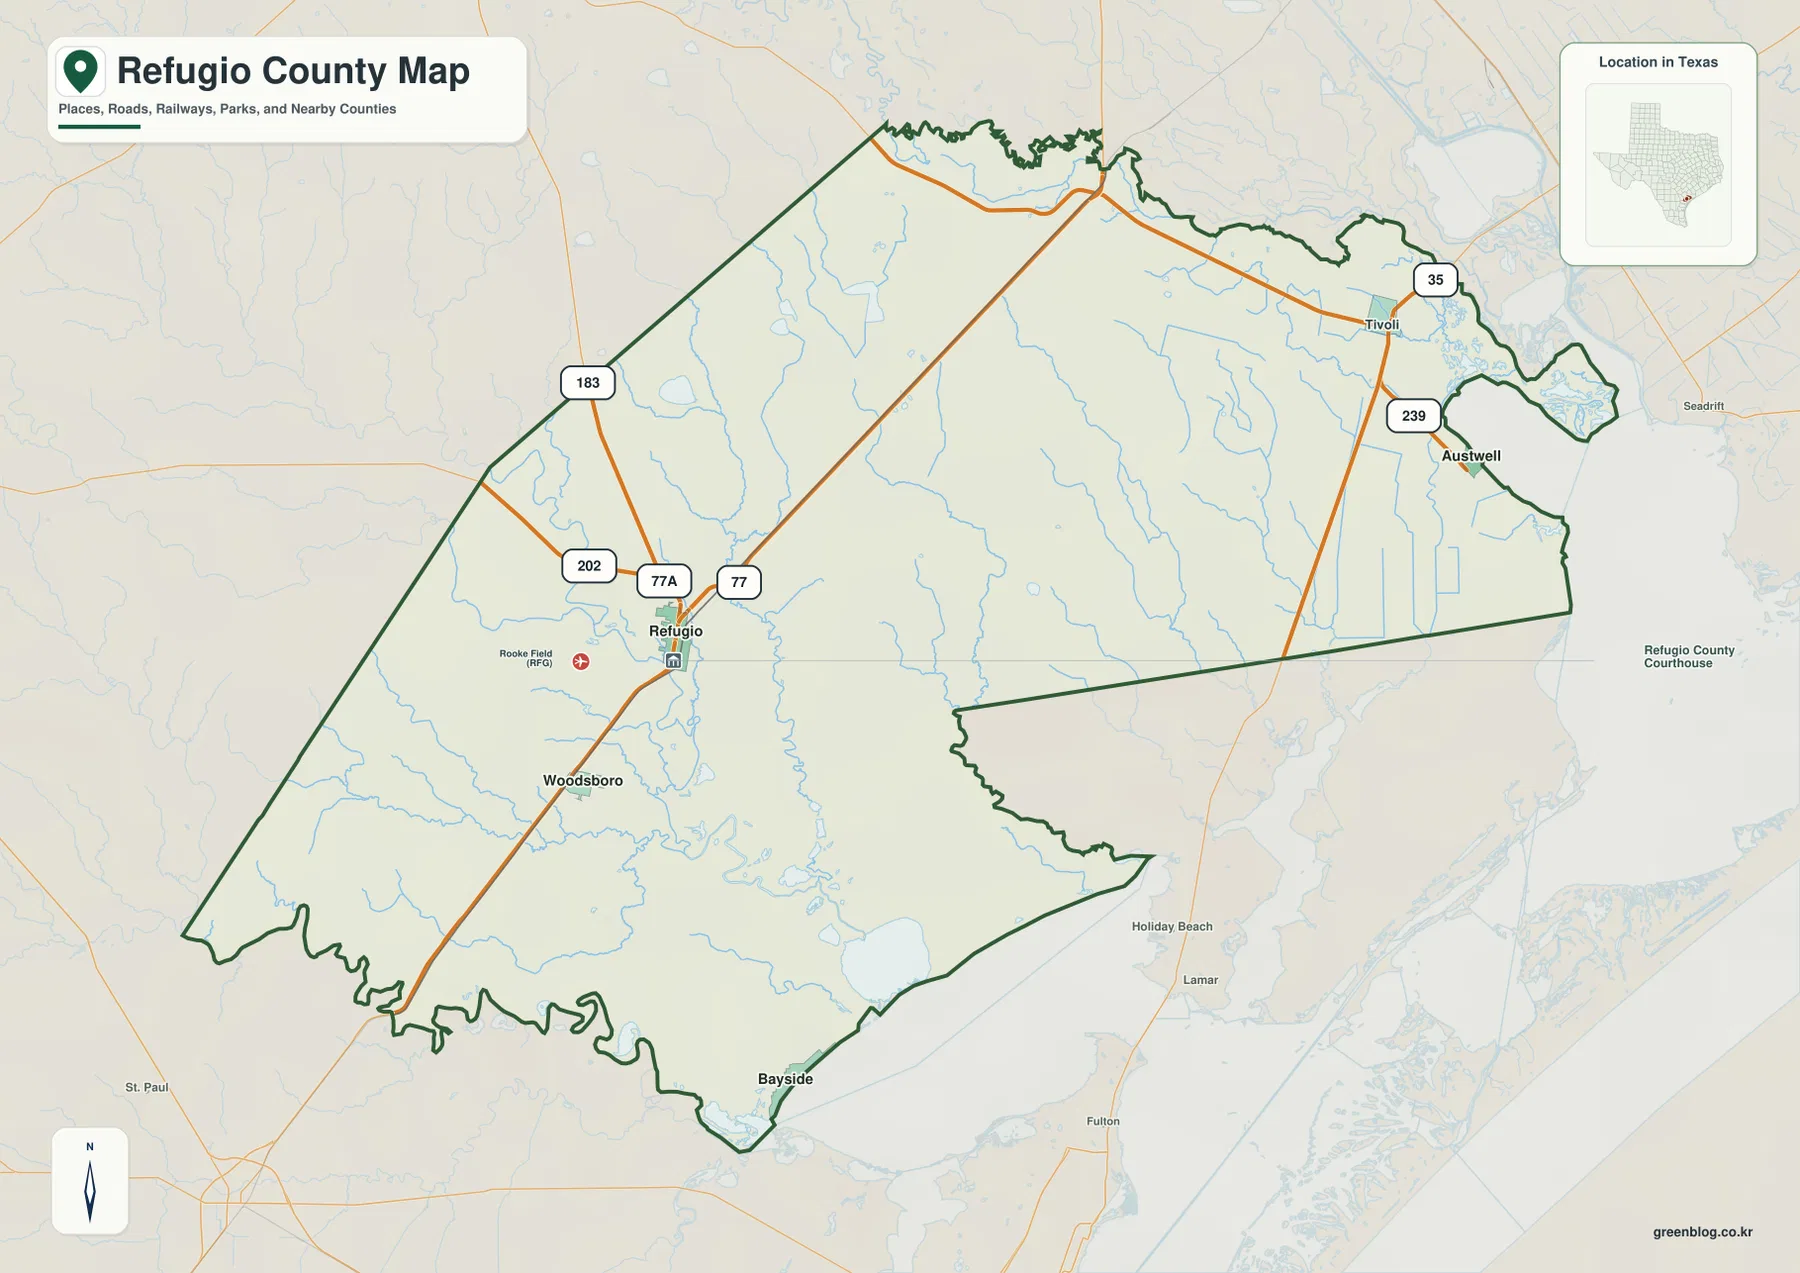
The eastern side has a different pattern. Tivoli is labeled near the northeast, and Austwell sits farther southeast near the water. State Highway 35 and Route 239 help define this side of the county on the map. Bayside is farther south near the edge of Copano Bay. Together, these places show how settlement is spread between the inland road corridor and the bay-side portions of the county.
The map also labels nearby counties around Refugio County, including Goliad County, Victoria County, Calhoun County, Bee County, San Patricio County, and Aransas County. Those labels are useful for orientation because they show how Refugio County sits between inland South Texas and the coastal bays without requiring a separate statewide map.
How Woodsboro, Bayside, and Austwell relate to Refugio
The city-connections map uses Refugio as the hub and makes the spacing between the main mapped communities easier to judge. Woodsboro is shown about 6 miles from Refugio, Bayside about 15 miles away, and Austwell about 27 miles away. These are straight-line distances between mapped points rather than driving distances. The direction matters as much as the number: Woodsboro is south of the hub, Bayside is toward the southeast, and Austwell is across the county toward the northeast.
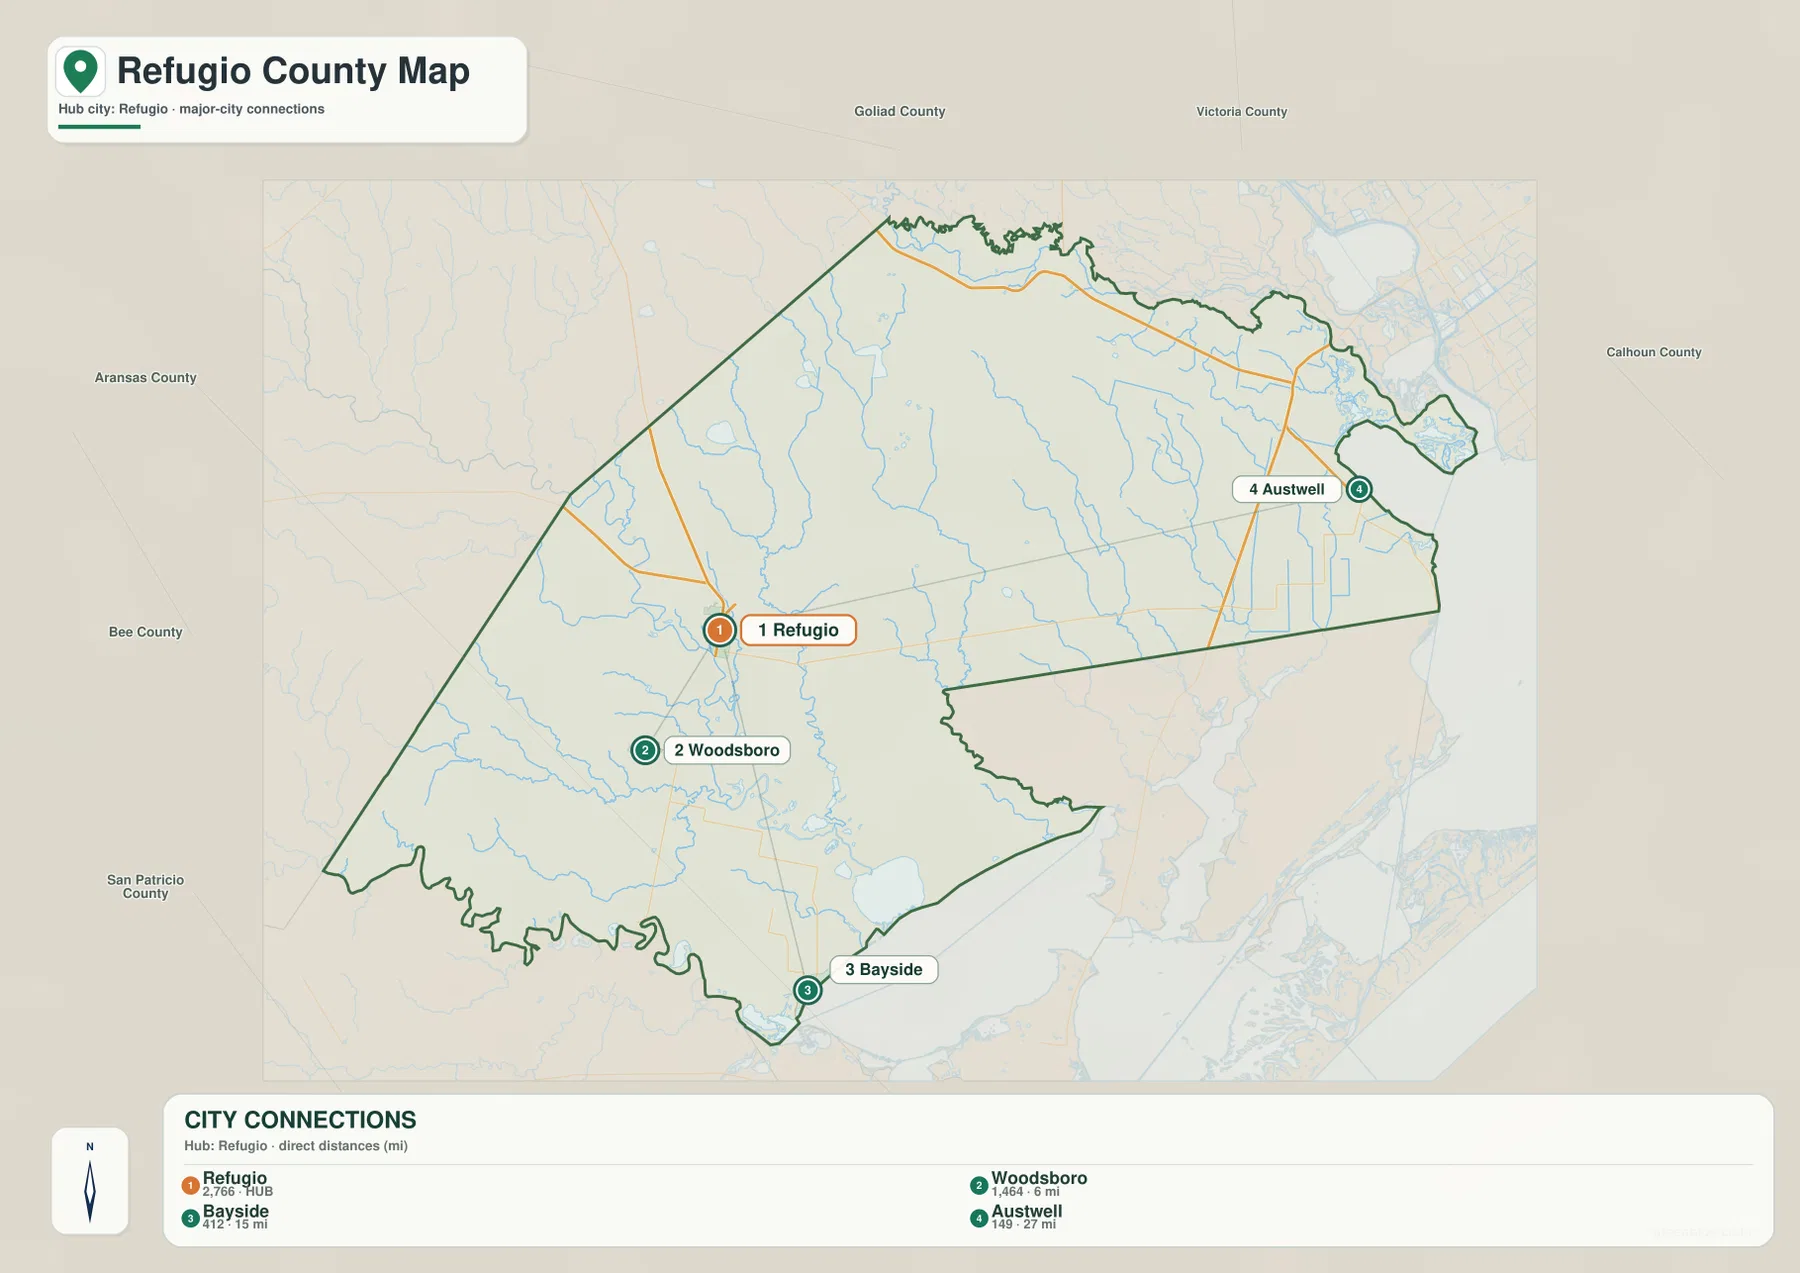
This layout makes the county feel less like one continuous built-up area and more like a set of separated communities tied together by a small number of important roads. Refugio and Woodsboro are relatively close to one another on the inland side. Bayside and Austwell are farther from that pair and much closer to the large water bodies shown on the hydrography map. If the goal is to understand where the communities sit before looking at terrain, this is the most direct map to start with.
Mission River, creeks, and the coastal bays
Water is one of the strongest geographic features in the provided map set. The Mission River is labeled in the southwest, and Melon Creek and Copano Creek run through the central part of the county. Chocolate Swale and the Aransas River are also labeled toward the southwest. These channels create a branching network that becomes easier to follow when the county boundary is viewed together with the larger bays along the coast.
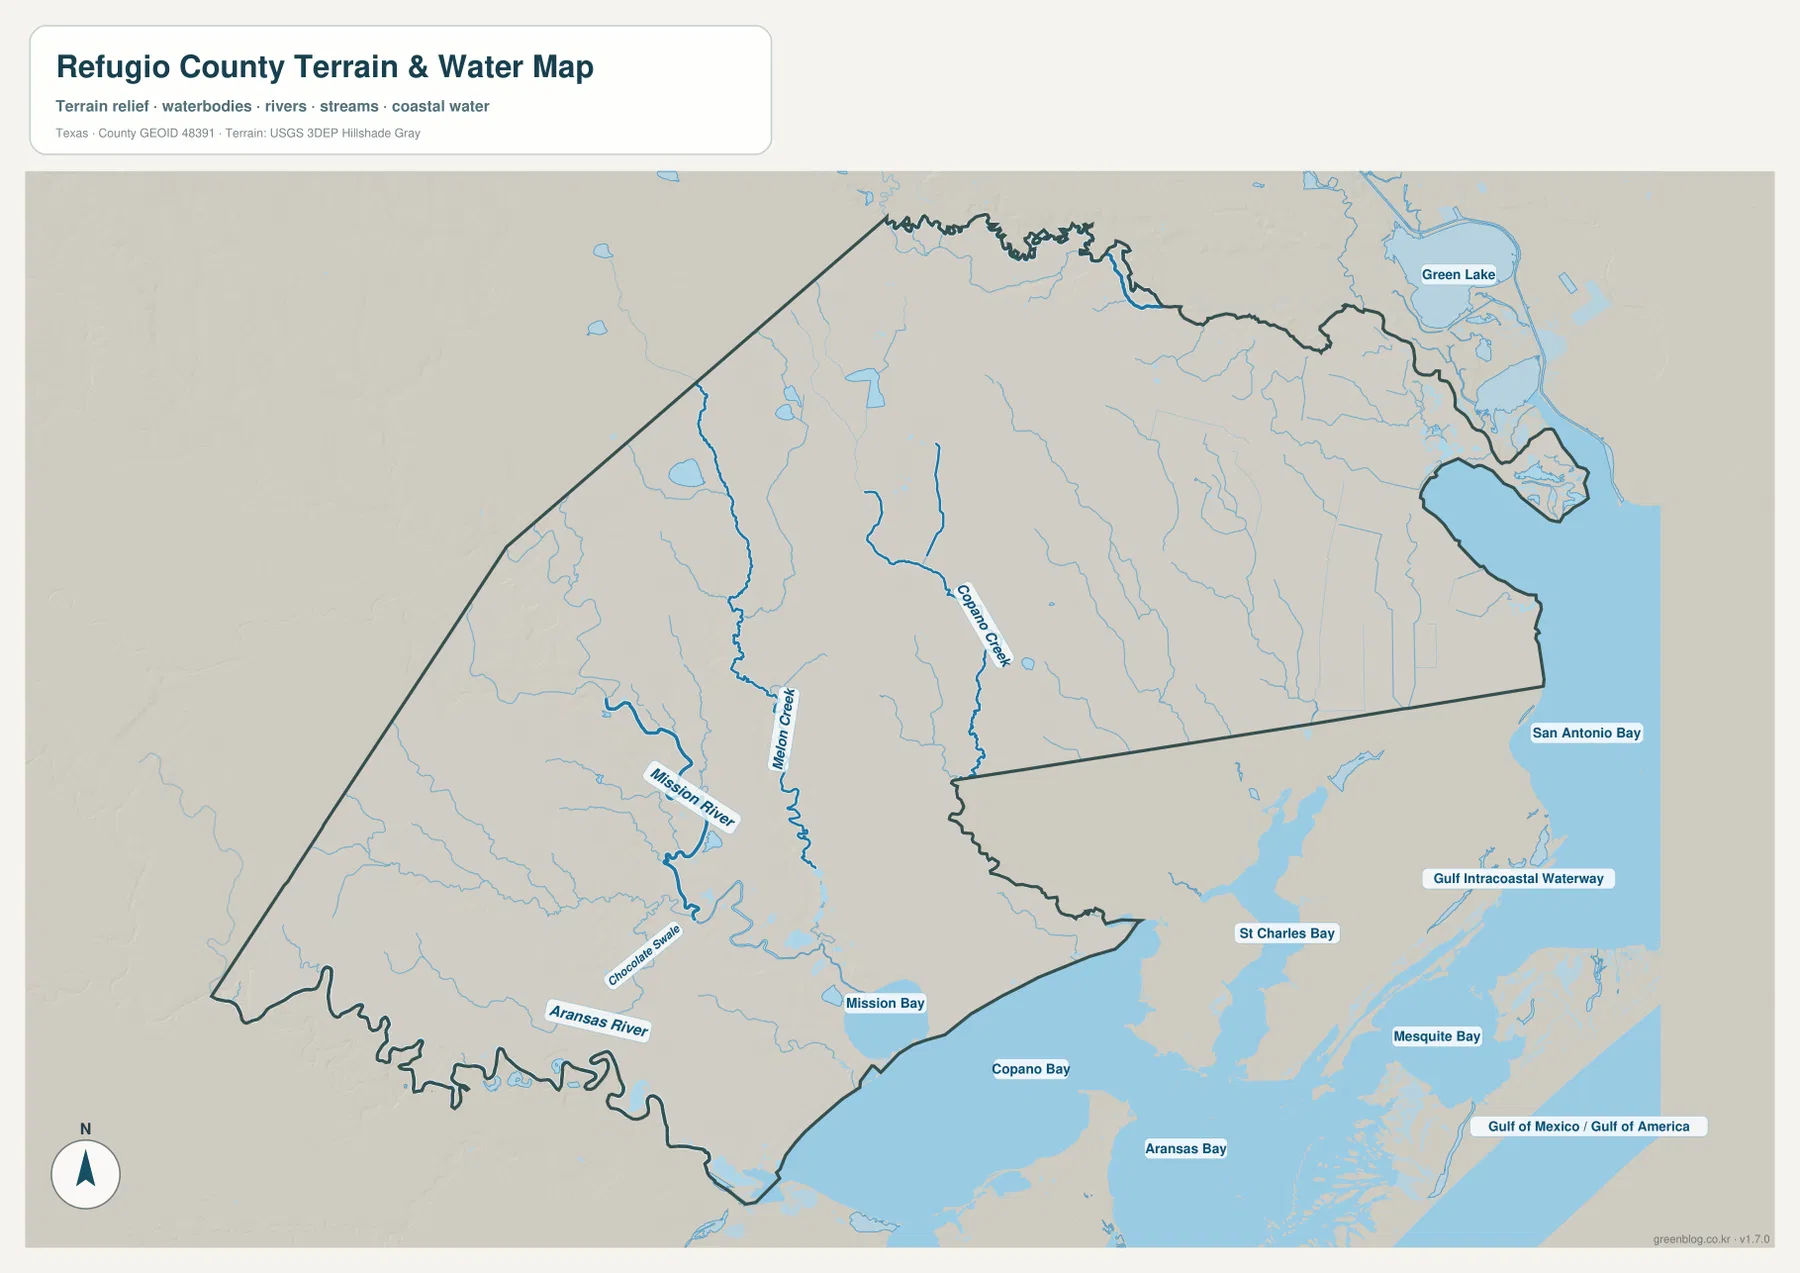
Mission Bay and Copano Bay dominate the southern side of the water map. Farther east are St. Charles Bay and Aransas Bay, while San Antonio Bay is labeled beyond the county’s eastern edge. Green Lake appears near the northeast, and the Gulf Intracoastal Waterway is shown farther east along the coast. The Gulf of Mexico is also labeled outside the bay system, helping place the county’s protected coastal waters in a broader setting.
The community locations become more meaningful when they are compared with this water map. Bayside lies close to Copano Bay, while Austwell is on the northeastern side near the San Antonio Bay area. Refugio and Woodsboro are farther inland. This contrast is important because the same county includes both inland road-centered communities and places that are closely associated with bays, estuaries, and low coastal drainage.
This water-reference map is intended for geographic orientation. It should not be treated as a flood-risk map, parcel boundary product, or navigation chart. For flood, legal boundary, or marine navigation decisions, use the appropriate official source for that purpose.
A county mostly between 0 and 30 meters
The elevation map shows a very low-relief landscape. Its stated actual range is about 0 to 30 meters, with a mean elevation of about 13 meters. The west and northwest are rendered in browns and tans, marking the relatively higher ground. Moving toward the center, south, and east, the colors shift toward green as the terrain drops toward the river channels and bays.
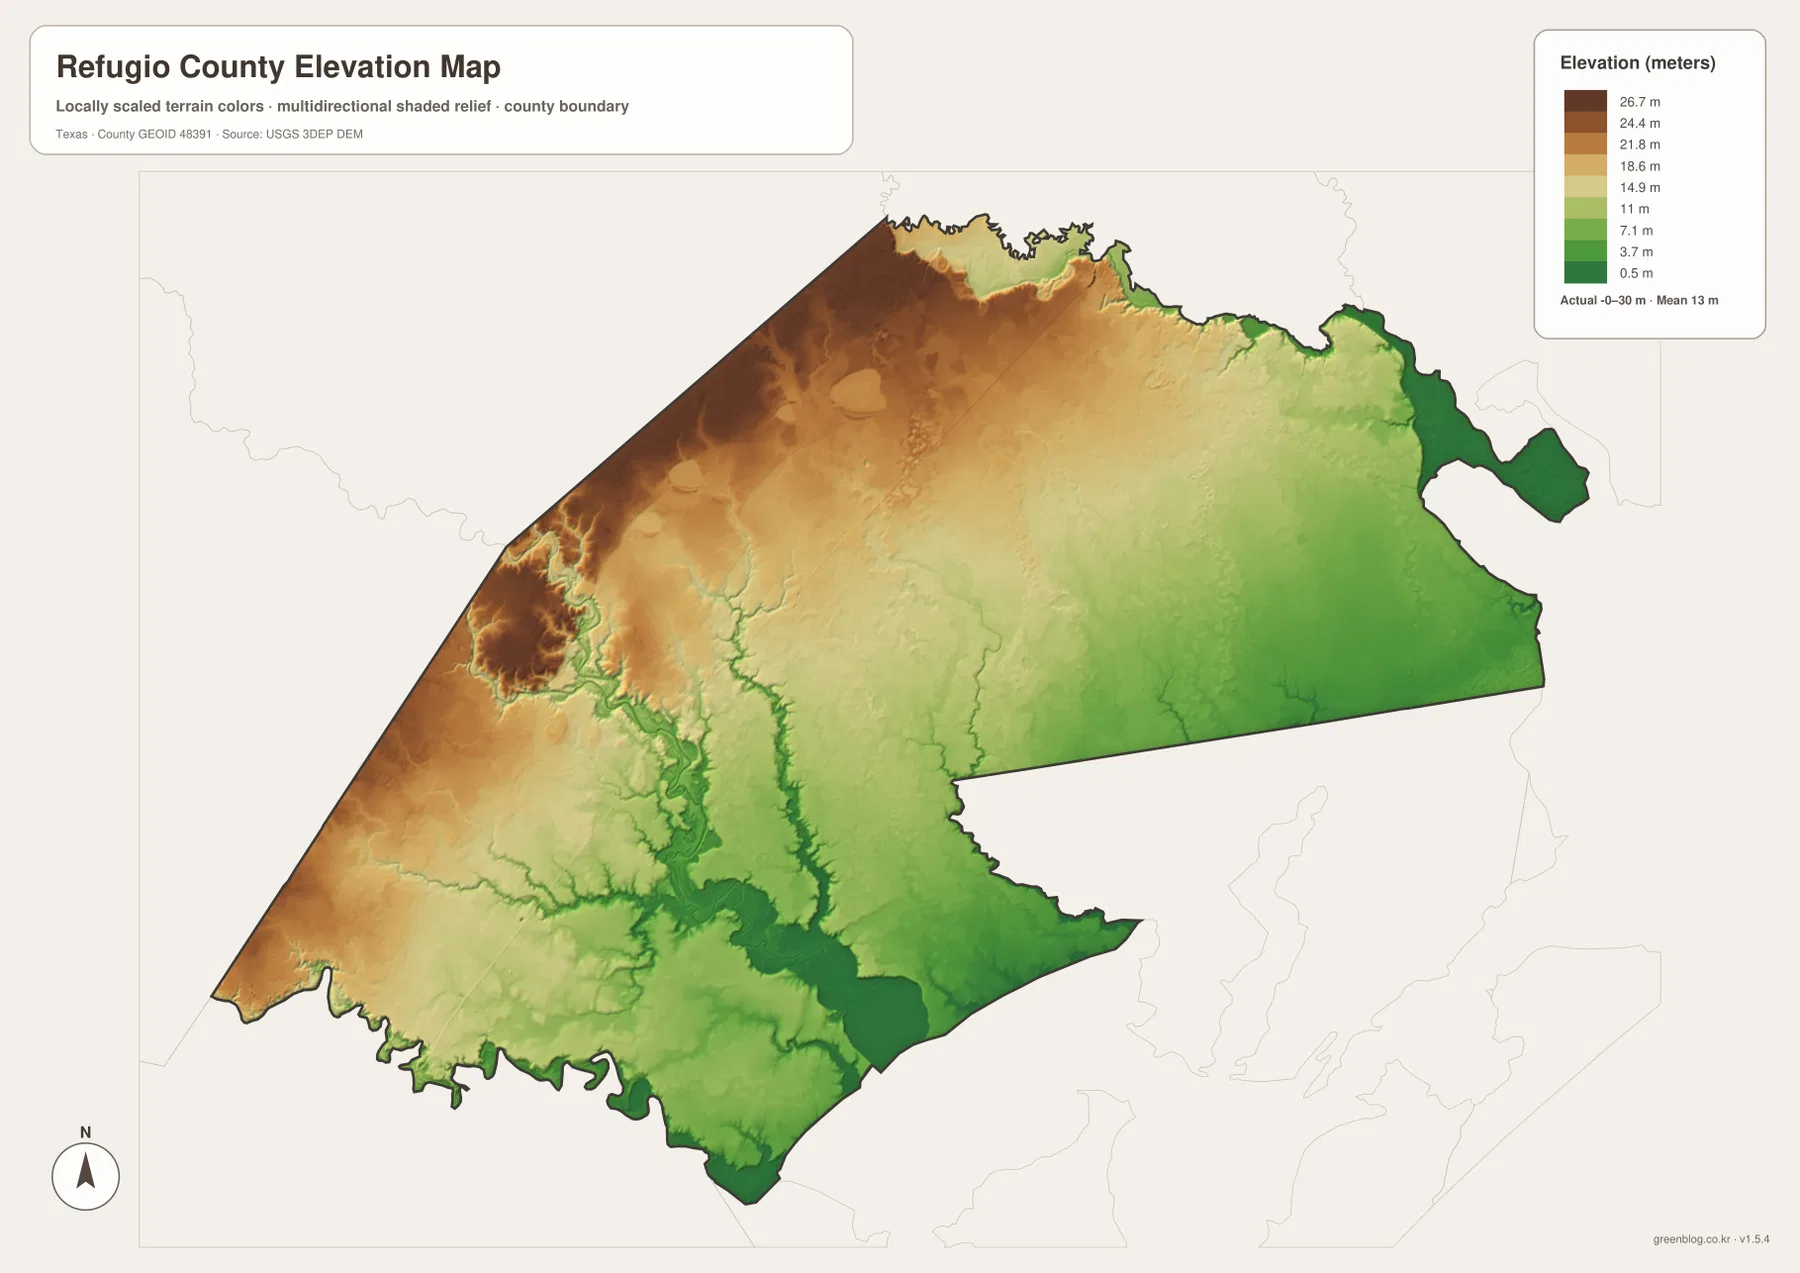
Several low corridors appear as narrow green branches extending inland. Their shape follows many of the channels that are easier to identify by name on the water map. The broad low areas near Mission Bay and Copano Bay are also clear. Rather than showing mountains or steep slopes, this map is most useful for seeing subtle height differences across a generally flat coastal county.
The elevation surface is a generalized geographic reference rather than a survey-grade measurement for individual sites. It works best for comparing broad parts of the county, such as the somewhat higher western interior and the lower bay-side terrain. Engineering, construction, or precise site-elevation work requires a more detailed source.
Choosing the map that fits the task
For a quick location check, begin with the general county map. It combines the named communities with U.S. 77, 77A, U.S. 183, Route 202, Highway 35, Route 239, and the county outline. The city-connections map is better when the main question is how Refugio relates to Woodsboro, Bayside, and Austwell. It removes some visual detail and emphasizes direction and spacing.
The water map is the best choice for following Mission River, Melon Creek, Copano Creek, and the bay system. It also gives coastal context by labeling Mission Bay, Copano Bay, St. Charles Bay, Aransas Bay, San Antonio Bay, and the Gulf Intracoastal Waterway. The elevation map is useful when the question is not simply where a stream is, but how low the surrounding terrain is compared with the western and northwestern interior.
Using the maps side by side can answer questions that a single layer cannot. For example, the general and city maps show where Bayside is located, the hydrography map shows the nearby bay environment, and the elevation map confirms the low terrain along that side of the county. Refugio and Woodsboro can be compared in the same way using the inland road network, stream channels, and slightly higher ground.
Frequently Asked Questions
How far is Woodsboro from Refugio on the city map?
The city-connections map shows Woodsboro about 6 miles south of Refugio. That value is a straight-line distance between mapped points, not a road-driving distance.
Which large water bodies are shown around Refugio County?
Copano Bay and Mission Bay are prominent along the southern side, while St. Charles Bay, Aransas Bay, and San Antonio Bay are labeled farther east. The map also shows inland waterways including Mission River, Melon Creek, and Copano Creek.
What elevation range is shown for Refugio County?
The supplied elevation map states an actual range of about 0 to 30 meters and a mean of about 13 meters. The west and northwest are relatively higher, while the terrain becomes lower toward the stream corridors and coastal bays.
Sources and reference data
For official boundary and road data, see the U.S. Census Bureau TIGER/Line Shapefiles. Waterway reference data are available through USGS National Hydrography, and terrain data can be checked through the USGS 3D Elevation Program. The place, road, water, and elevation descriptions in this article are based on the four Refugio County map assets supplied with the rewrite package.
Map File Information
The download ZIP contains the high-resolution A3 JPG versions of the Refugio County general map, city map, terrain and water map, and elevation map. Use the archive if you need larger files for printing, closer inspection, or offline reference.
- Included Files: General county map, city map, terrain and water map, elevation map
- File Type: High-resolution A3 JPG
- Intended Use: Printing, education, presentations, and map reference
Related Maps
Green Map creates custom-edited map images using open geographic data sources such as geoBoundaries, Natural Earth, OpenStreetMap, and government open data.
These maps are edited visual materials, not raw data files, and are provided for education, documents, presentations, and graphic reference.