The Gila County Arizona Land Cover Map shows a county where shrubland is the largest surface class but forest still occupies a major share of the landscape. The 2025 summary lists shrubland at 58.83% and forest at 34.16%. Broad green forest zones cover much of the north and extend through the eastern half, while tan shrubland becomes more continuous through central, western, and southern areas. A large blue water body along the western side adds another strong geographic contrast.
This page includes four views: general land cover, forest and farmland, impervious surface/developed land, and 1985–2025 land-cover change. The original 2480 × 1754 JPG for each map can be downloaded together in one ZIP near the end of the page. The set is useful for classroom work, presentations, county-scale environmental comparison, and general reference, but it is not a parcel, zoning, ownership, or engineering map.
Table of Contents
The hard-surface map reveals a few compact settlement clusters inside a largely open county
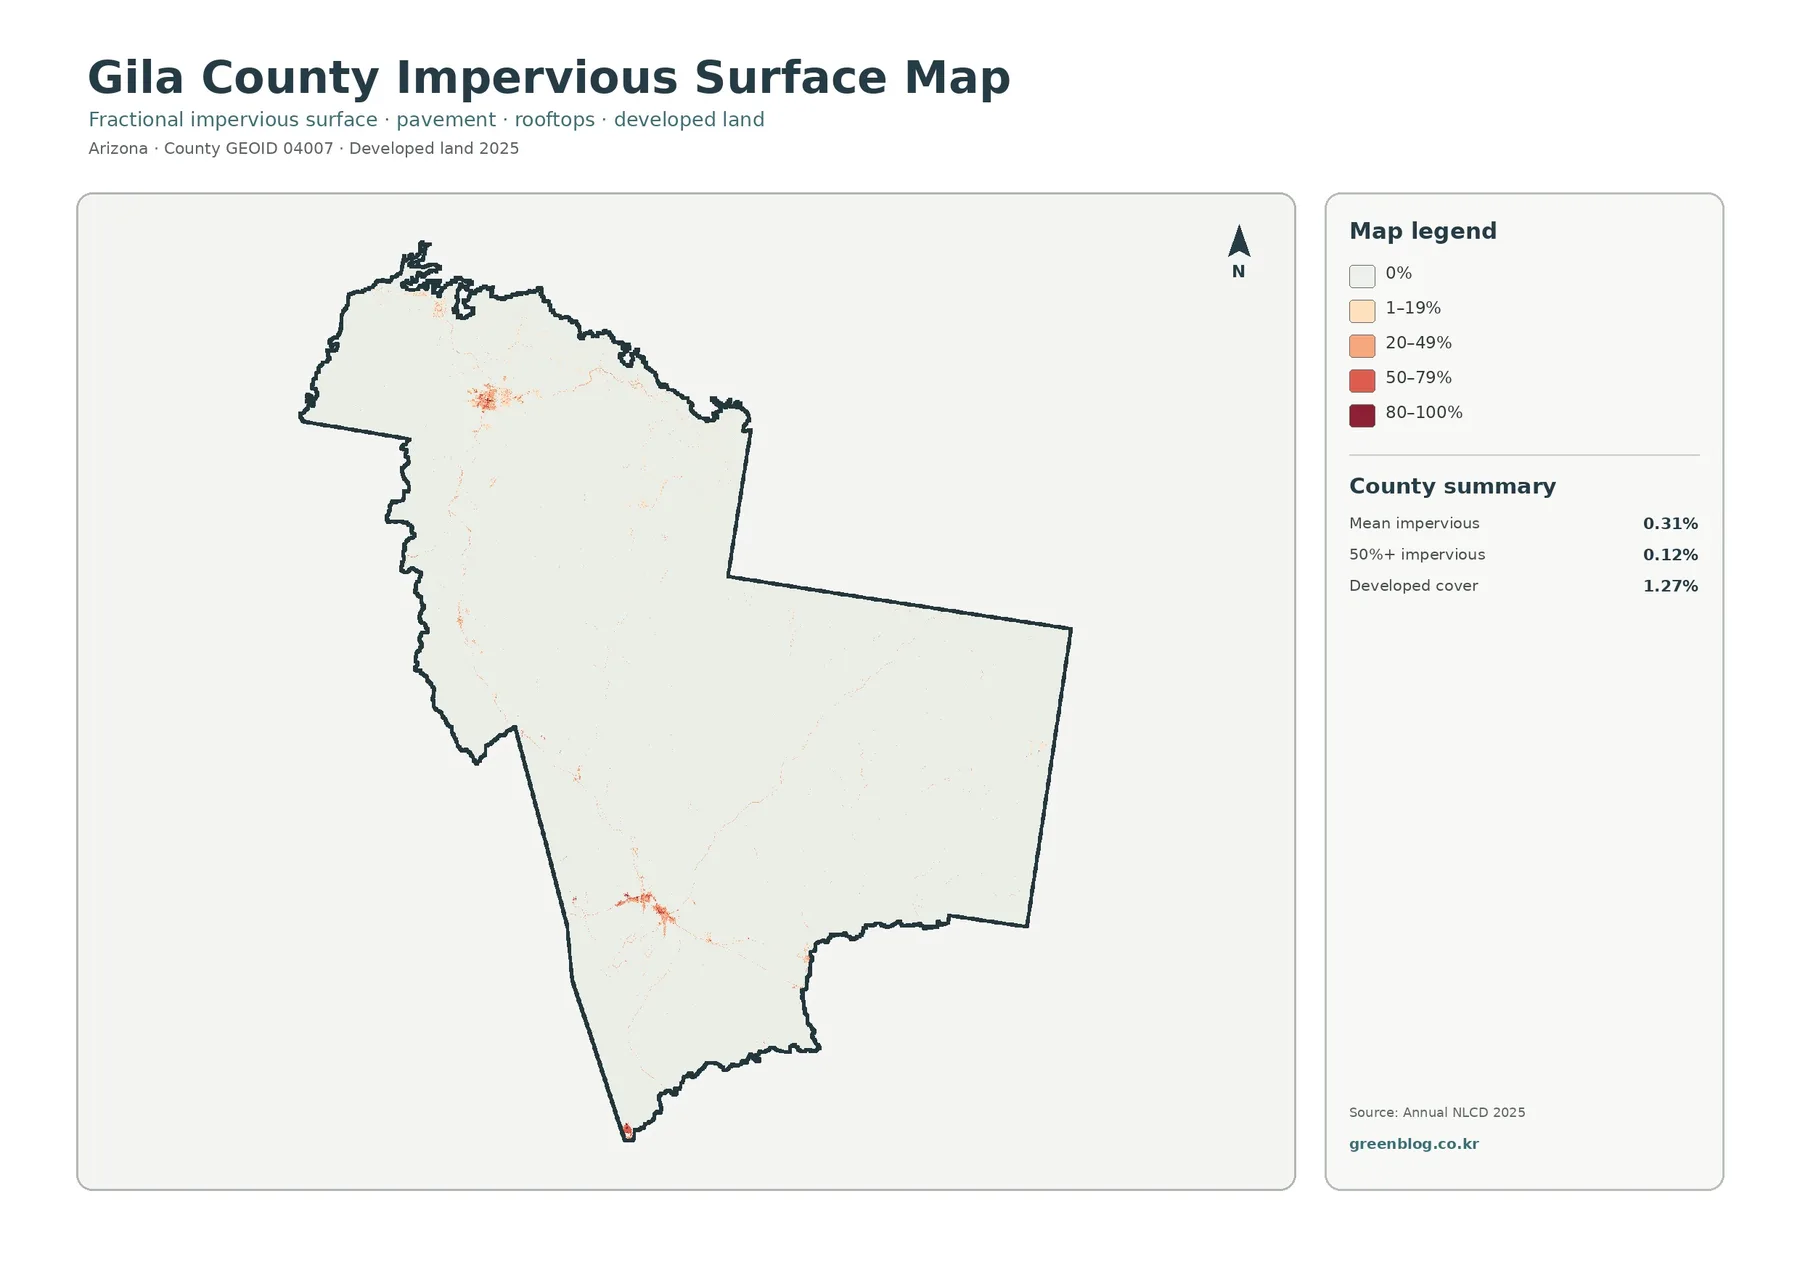
The impervious-surface view is a useful place to start because most of Gila County is nearly white. Pavement and rooftops are not spread evenly across the county. The strongest orange and red clusters appear around the northern Payson area and farther south around the Globe–Miami area, with smaller marks near other settlements. Gila County’s official background material lists Payson, Globe, Miami, Hayden, Winkelman, and Star Valley among its cities and towns, which helps place those localized built patterns in a countywide context.
A mean impervious value of 0.31% does not mean every part of the county is 0.31% paved. It is a countywide average across a very large area in which many raster cells contain no mapped hard surface at all. The 0.12% figure for cells that are at least 50% impervious is narrower still. Those dense hard-surface locations are tiny compared with the county, yet they are visually important because they identify the places where buildings and roads are concentrated.
Developed land cover is 1.27%, which is higher than the mean impervious percentage because the two measures describe different things. A developed class can contain a mixture of houses, streets, bare soil, trees, and yards. Imperviousness focuses more directly on the hard portion of a cell. This difference matters when comparing a town to surrounding open land: a developed cell is not automatically a completely paved cell.
Shrubland covers most of Gila County, but forest forms broad northern and eastern zones
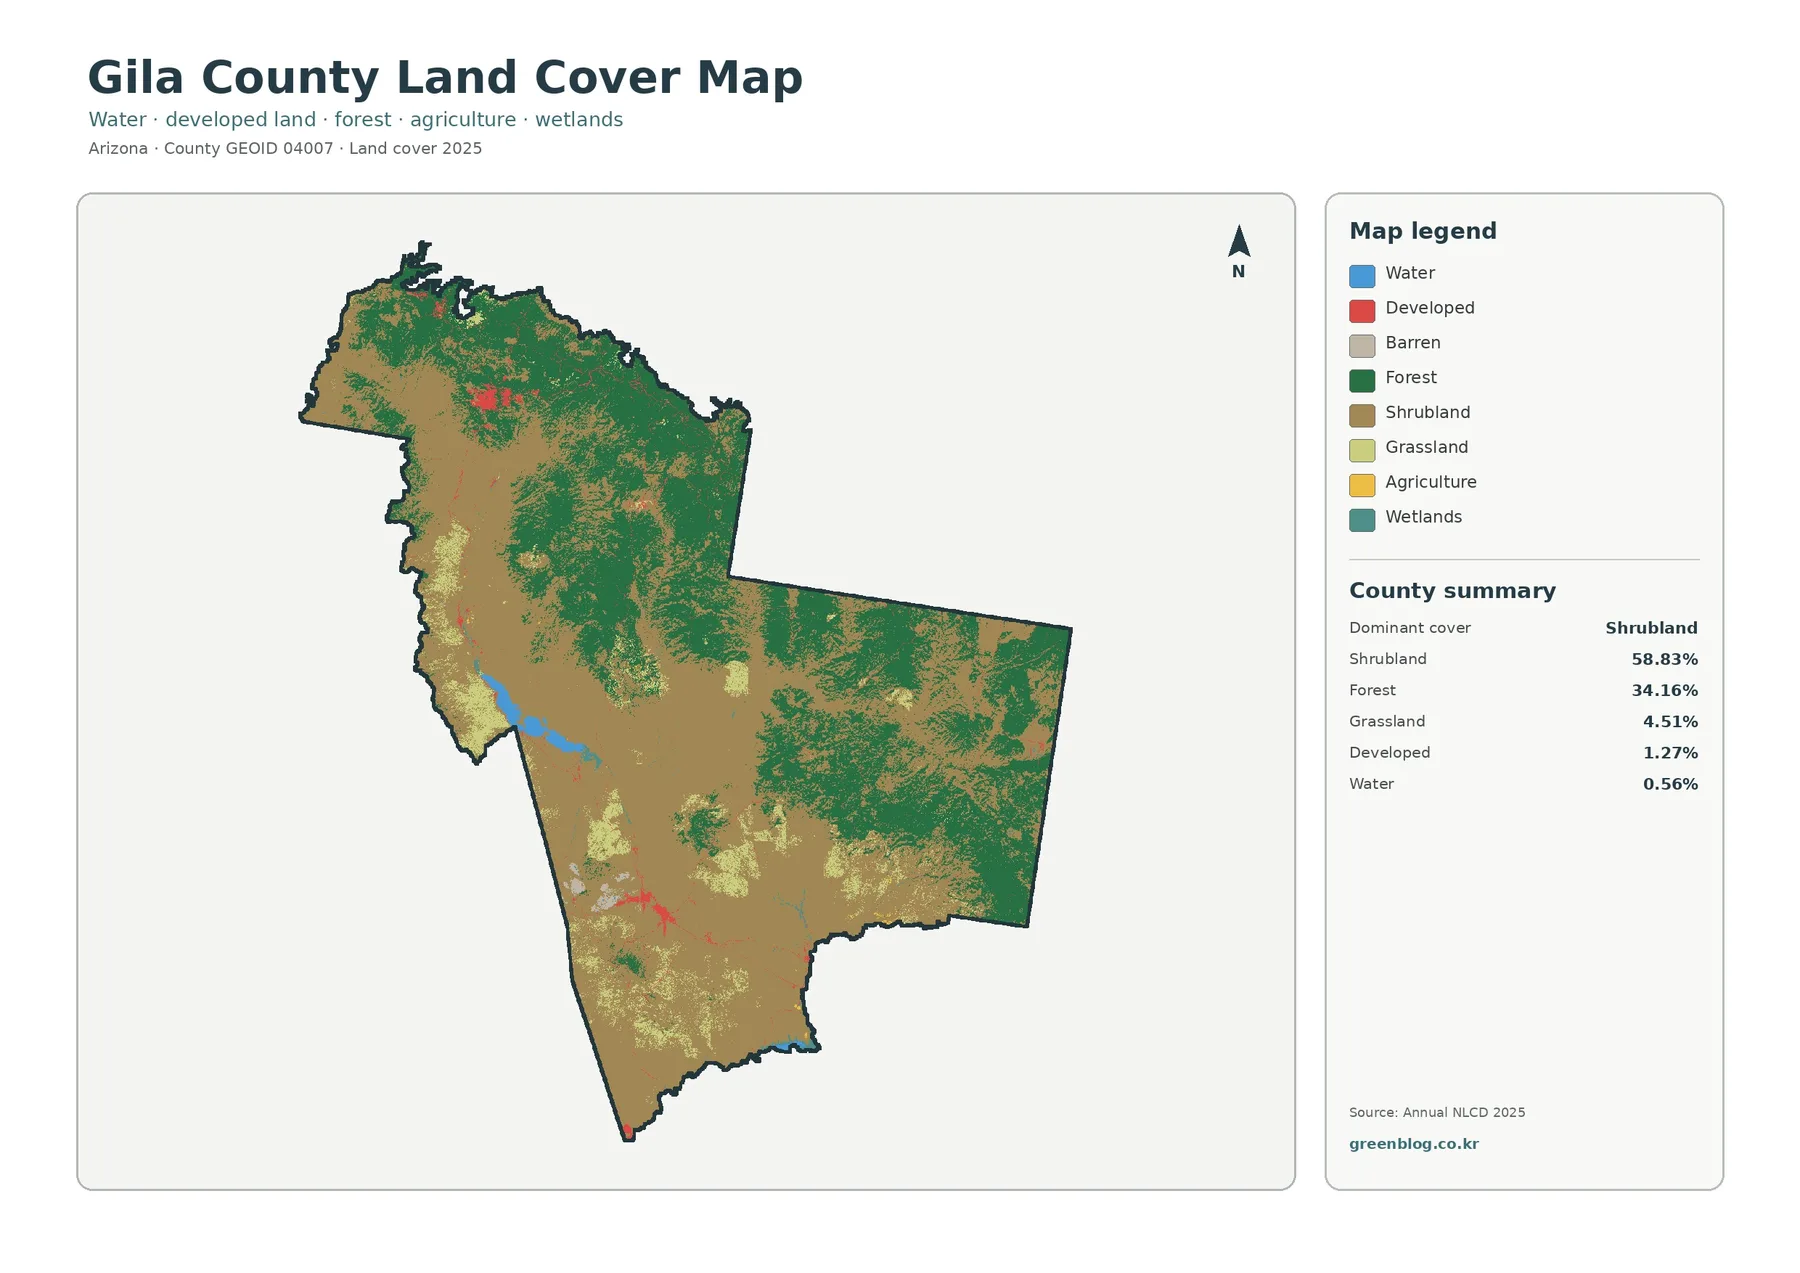
The general map makes the county’s two dominant surfaces easy to compare. Tan shrubland is extensive through the west-central interior, the south, and large parts of the middle of the county. Forest is less extensive overall, but it is not scattered randomly. Large green areas occupy the north, continue into the upper center, and appear in broad belts across the eastern half. The pattern gives the county a strong transition from forested uplands to more open shrub-dominated areas.
Grassland accounts for 4.51%. It appears in smaller light-colored patches, including areas near transitions between forest and shrubland. Developed cover is only 1.27% and therefore disappears quickly when the map is viewed at a small size, but the built clusters identified on the impervious map explain where much of that class is concentrated. Water accounts for 0.56%, yet one large western reservoir makes water visually more prominent than its countywide percentage might suggest.
Gila County’s official background describes the county as extending from the northeastern edge of the Sonoran Desert through mountain country and the Tonto National Forest. A U.S. Forest Service planning document for the Tonto also describes vegetation ranging from Sonoran Desert communities through chaparral and pinyon-juniper to ponderosa pine and mixed conifer. That verified regional context matches the broad contrast visible in the land-cover map without requiring the land-cover colors to be treated as management boundaries.
The forest-and-farmland view simplifies the legend and makes the north–south contrast easier to follow
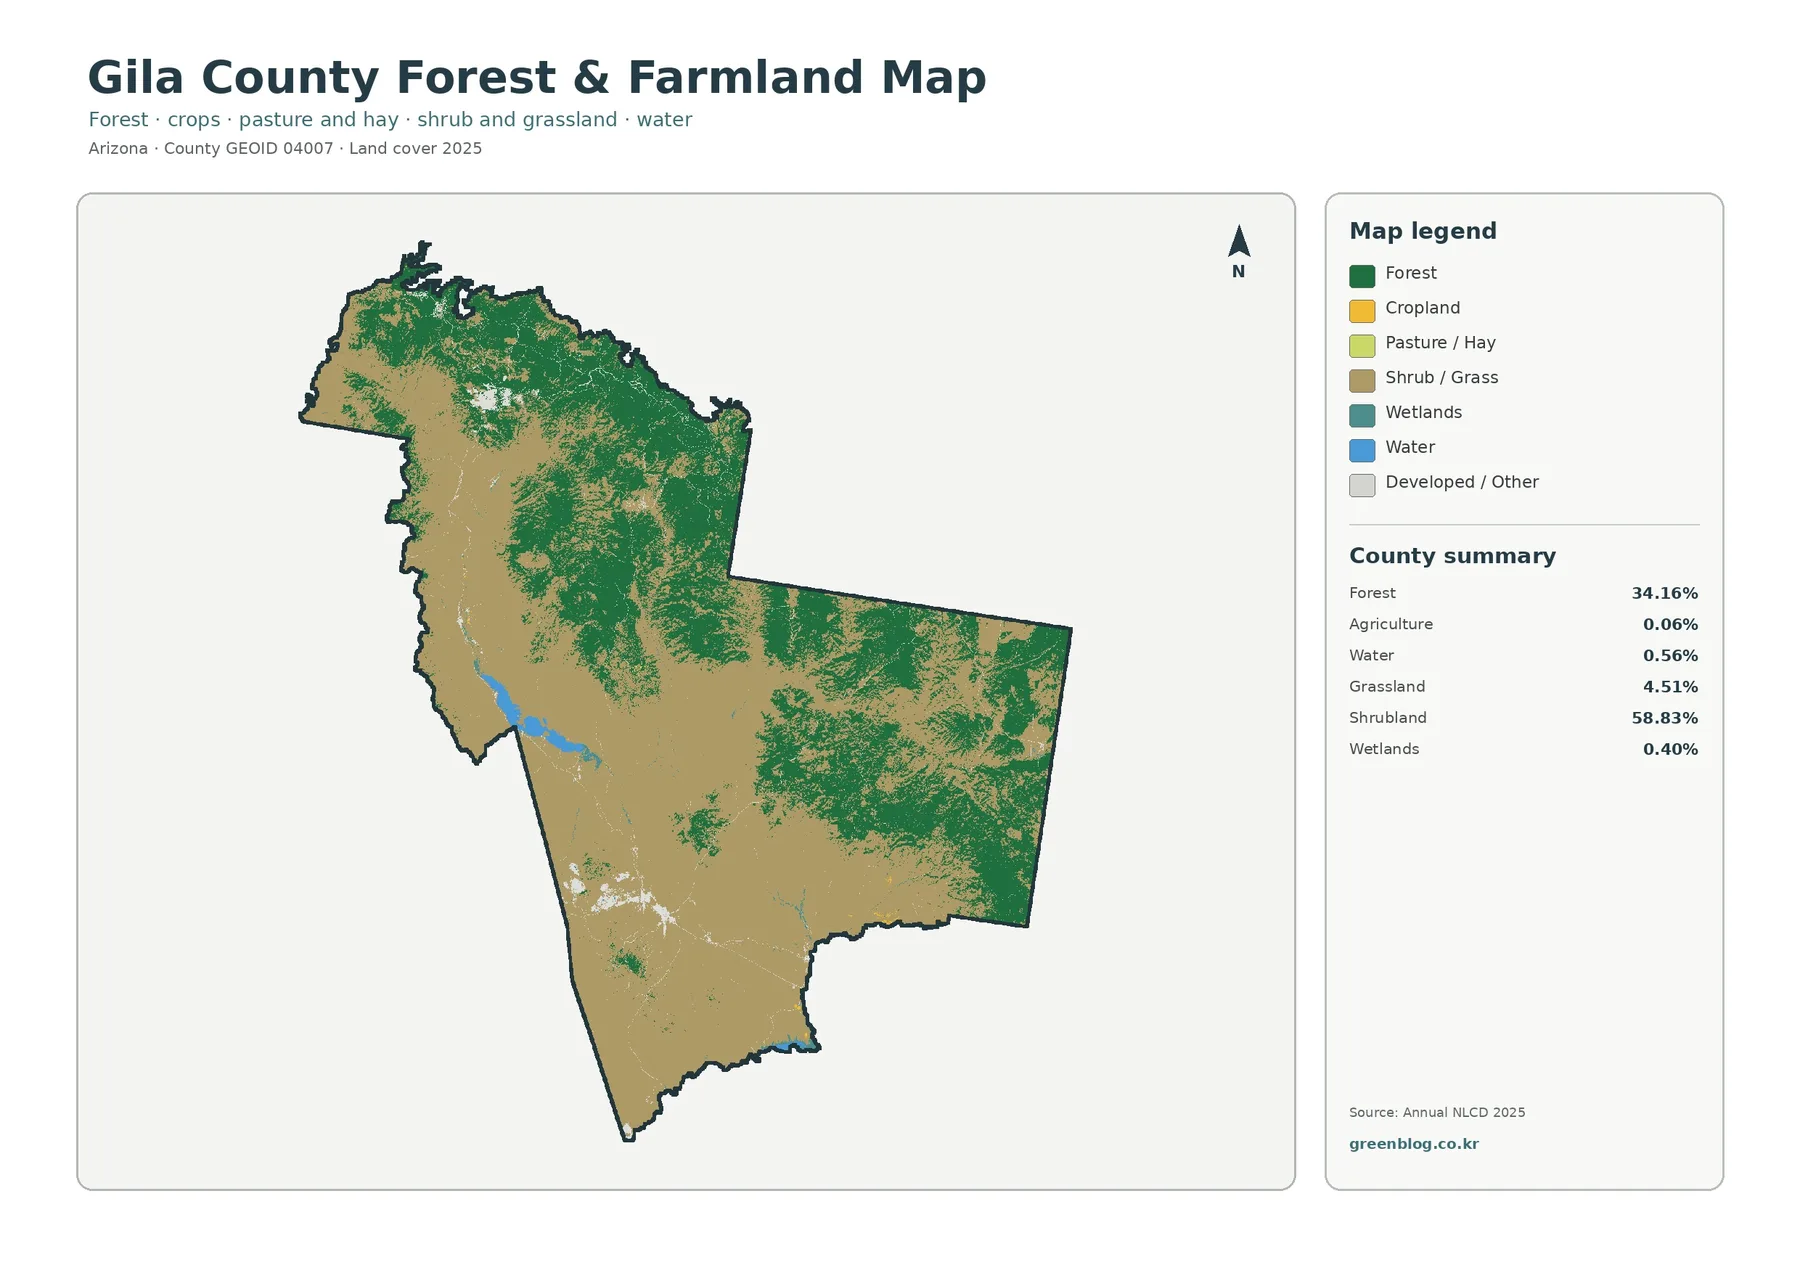
By grouping many minor classes together, this view makes the green forest areas stand out against the shrub-and-grass background. The north is heavily forested, and broad green belts continue through the northeast and east. Central and southern portions contain more tan shrub and grass classes, with smaller forest islands and strips interrupting the open cover. For a presentation about vegetation distribution, this simplified view is easier to read than the full general legend.
Agriculture is listed at only 0.06% in the 2025 classification. That number means a very small share of the county was assigned to cropland or pasture/hay classes in this raster product. It should not be expanded into the claim that agricultural activity is absent. Small fields or mixed surfaces can fall within cells represented by another dominant class, and agricultural production is better measured with agricultural statistics and local land-use records.
Roosevelt Lake is a useful water landmark even though water is only 0.56% of the county
The largest blue feature lies along the western side of the county and provides a strong landmark between shrub-dominated surroundings and nearby forested areas. Gila County’s official background identifies Roosevelt Lake as one of the county’s major recreation areas. That makes the reservoir useful for orienting the land-cover pattern: a relatively small water percentage can still produce a major geographic feature when the water is concentrated in one large body.
The 13.43% class difference includes forest loss and other changes, not just new development
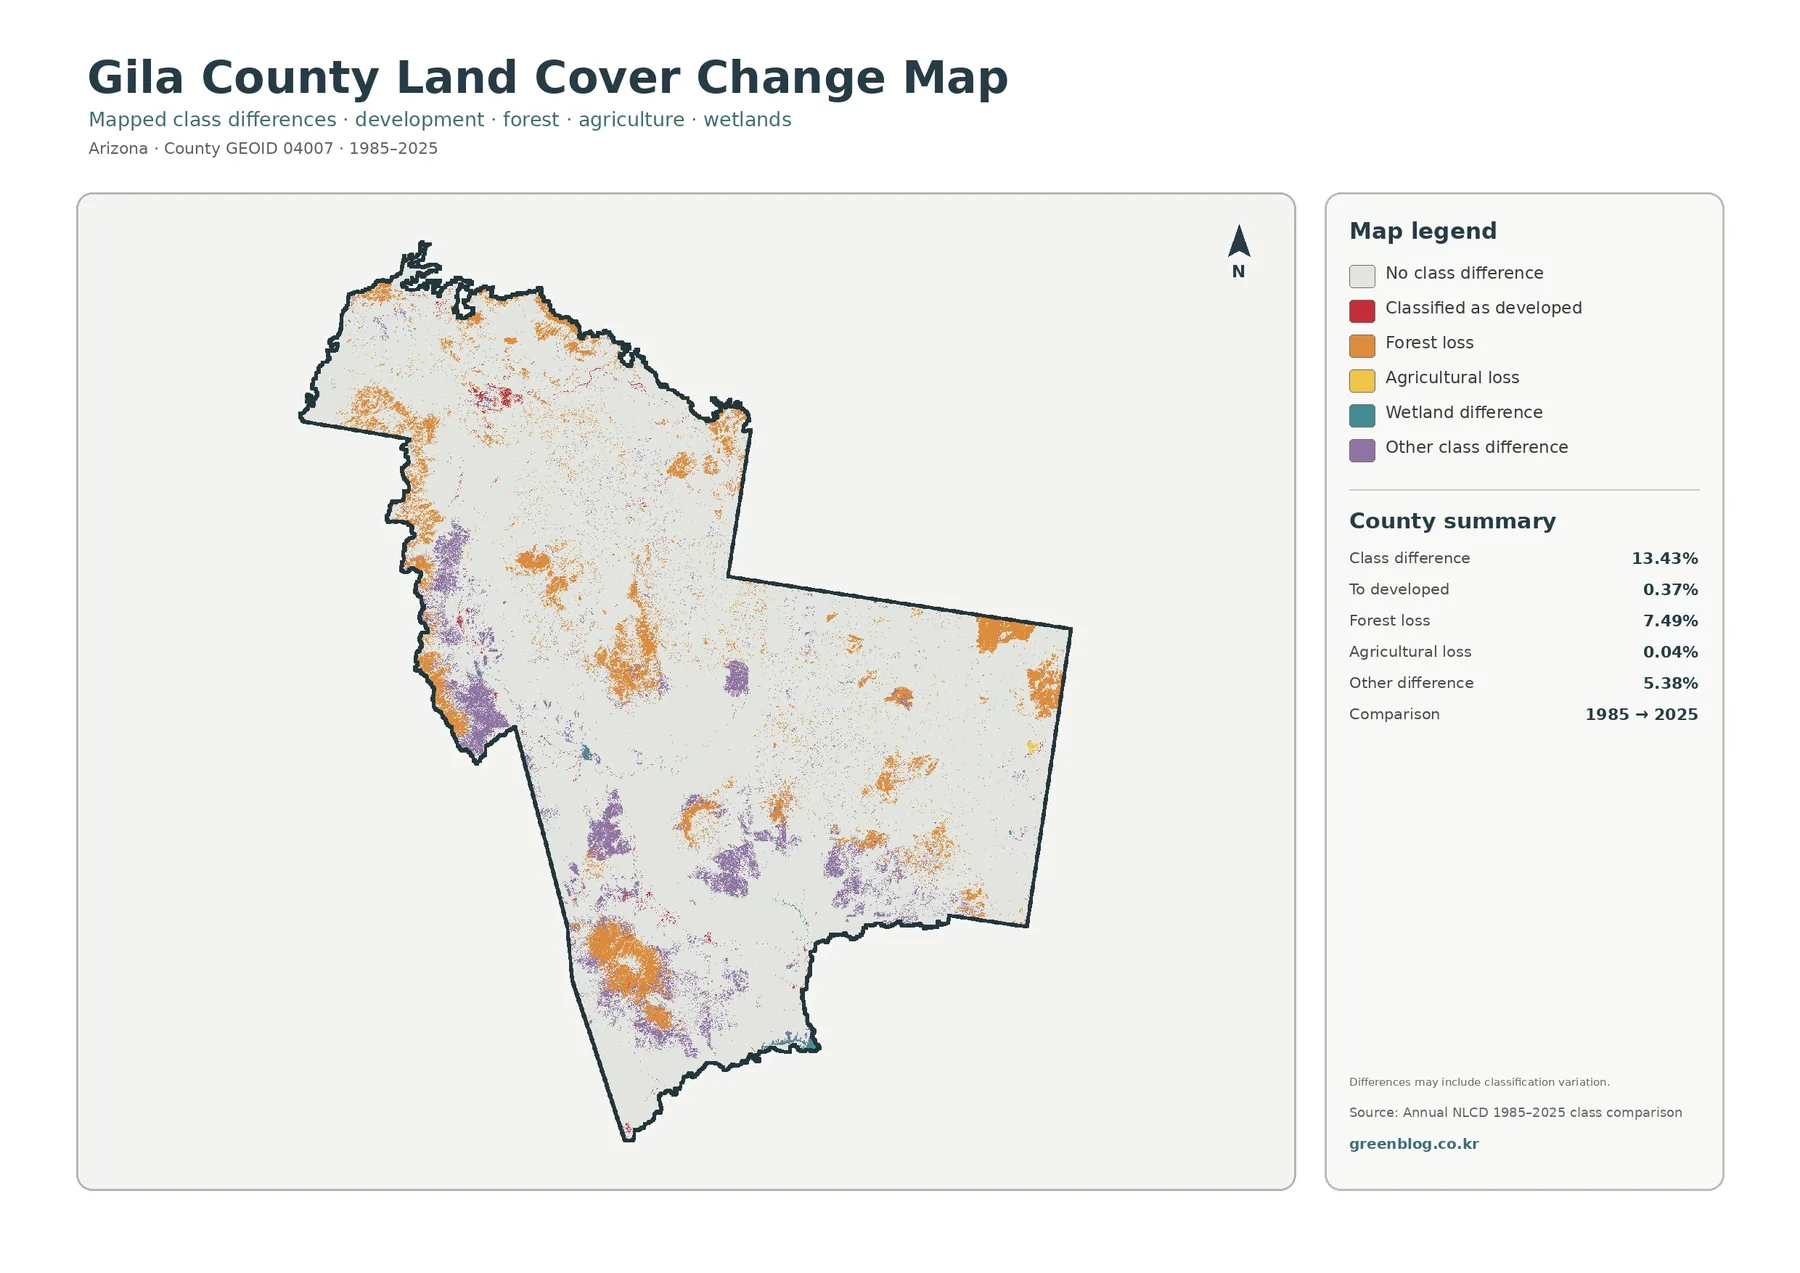
The most important number on the change map is also the easiest to misread. A 13.43% class difference means that 13.43% of cells were assigned to different land-cover classes in the 1985 and 2025 comparison. It does not mean that 13.43% of Gila County became developed. The map lists transition to developed separately at 0.37%, forest loss at 7.49%, agricultural loss at 0.04%, and other class difference at 5.38%.
Orange forest-loss cells appear in multiple parts of the northern and eastern forest zones and in several interior patches. Purple other-class differences are especially visible along parts of the western side and in southern areas. Red developed-transition cells are far more localized and appear near existing settlement clusters. The different colors occupy different places, which is a good reason to avoid describing the county’s 1985–2025 change as one simple trend.
The map identifies where classifications differ, not why they differ. A cell labeled as forest loss could reflect fire, vegetation change, timber activity, drought, management, classification variation, or another cause. Determining the cause requires event records, historical imagery, forestry information, or field evidence. The change map is best used to locate areas for follow-up rather than as a complete explanation by itself.
Tonto National Forest adds useful regional context without turning the map into an ownership map
The Tonto National Forest is especially relevant to Gila County because a Forest Service planning document states that 59% of the national forest lies in Gila County. The same document describes a broad vegetation range from Sonoran Desert settings through chaparral and pinyon-juniper to ponderosa pine and mixed conifer. Those verified descriptions help explain why the county land-cover map can contain large shrub areas and broad forest zones within the same boundary.
Use each map for a different question instead of treating the four images as duplicates
- Countywide pattern: use the general map to compare the 58.83% shrubland majority with the 34.16% forest share and the large western water feature.
- Vegetation emphasis: use the forest-and-farmland view to simplify the legend and focus on forest, shrub/grass, water, and the very small agricultural class.
- Settlement concentration: use the impervious map to identify compact hard-surface clusters around Payson and the Globe–Miami area.
- Time comparison: use the change map to locate 1985–2025 class differences while separating forest loss, development transition, and other differences.
For classroom use, the order can be changed depending on the lesson. A settlement lesson can begin with the impervious map, then move to general land cover to show the much larger open landscape around towns. A vegetation lesson can begin with the forest view and finish with the change map. For presentations, one or two large maps with readable legends are usually more effective than four small panels squeezed onto one slide.
Keep the 2025 date and 30-meter raster scale in mind
Annual NLCD-style land-cover products assign a representative class to raster cells rather than drawing every individual object. At roughly 30 meters, a cell can contain a mixture of vegetation, soil, road surface, buildings, and water-edge features. Small sites may therefore disappear into a surrounding class, while a developed cell can include substantial permeable area. This generalization is appropriate for county-scale pattern analysis but not for parcel surveys.
The current maps use a 2025 classification, and the change view compares 1985 with 2025. New construction, fire, vegetation recovery, or other changes after 2025 are not represented. Some small differences near class boundaries can also reflect classification variation rather than a simple physical conversion. When a decision depends on current conditions, use newer imagery and the appropriate local, state, federal, or tribal source.
Download four Gila County land-cover JPG maps
Frequently Asked Questions
What does the 58.83% shrubland figure mean?
It means that 58.83% of the county was represented by the shrubland class in the 2025 land-cover classification. It is not an ownership, zoning, or development-right percentage, and small mixed surfaces can be generalized within the raster grid.
Did 13.43% of Gila County become developed between 1985 and 2025?
No. The 13.43% value is the total share of cells assigned to a different class in the comparison. Transition to developed is listed separately at 0.37%, while forest loss and other class differences make up much of the remaining change.
What files are included in the download?
The ZIP contains four 2480 × 1754 JPG files: the general land-cover map, forest-and-farmland map, impervious-surface/developed-land map, and the 1985–2025 change map. The WebP previews in the article are not the download originals.
Map File Information
Gila County Land-Cover Map Files
- Included Files: Use only the versions confirmed in the article and supplied images
- File Type: Use the confirmed download contents
- Intended Use: Printing, education, presentations, and map-based projects
Related Maps
- Apache County Arizona Land Cover Map
- Cochise County Arizona Land Cover Map
- Coconino County Arizona Land Cover Map
Sources and reference links
- MRLC Annual NLCD Data — land-cover and impervious-surface data
- USGS Annual NLCD Land Cover Classification — class definitions and methodology context
- U.S. Census Bureau TIGER/Line Shapefiles — county boundary reference
- Gila County official budget background — county communities, Roosevelt Lake, and Tonto National Forest context
- U.S. Forest Service: Tonto National Forest planning document — regional vegetation and county-overlap context
Green Map creates custom-edited map images using open geographic data sources such as geoBoundaries, Natural Earth, OpenStreetMap, and government open data.
These maps are edited visual materials, not raw data files, and are provided for education, documents, presentations, and graphic reference.