Cassia County in south-central Idaho has a land-cover pattern that changes sharply from broad farm blocks in the north to extensive shrub and grass cover across much of the south and west. Forest occupies a smaller county-wide share, yet it stands out where wooded mountain areas interrupt the open rangeland. The four maps on this page separate those patterns into a 2025 land-cover view, a forest-and-farmland view, an impervious-surface layer, and a 1985–2025 class-difference map.
The map images can be compared on the page, and the four original JPG files are provided together in one ZIP through the file box below. That makes it possible to choose a general reference for printing, a simpler agriculture-versus-forest graphic, a closer look at built surfaces, or a historical comparison layer without treating one map as if it answered every question.
Table of Contents
A 2025 map dominated by shrubland, with farming concentrated in the north
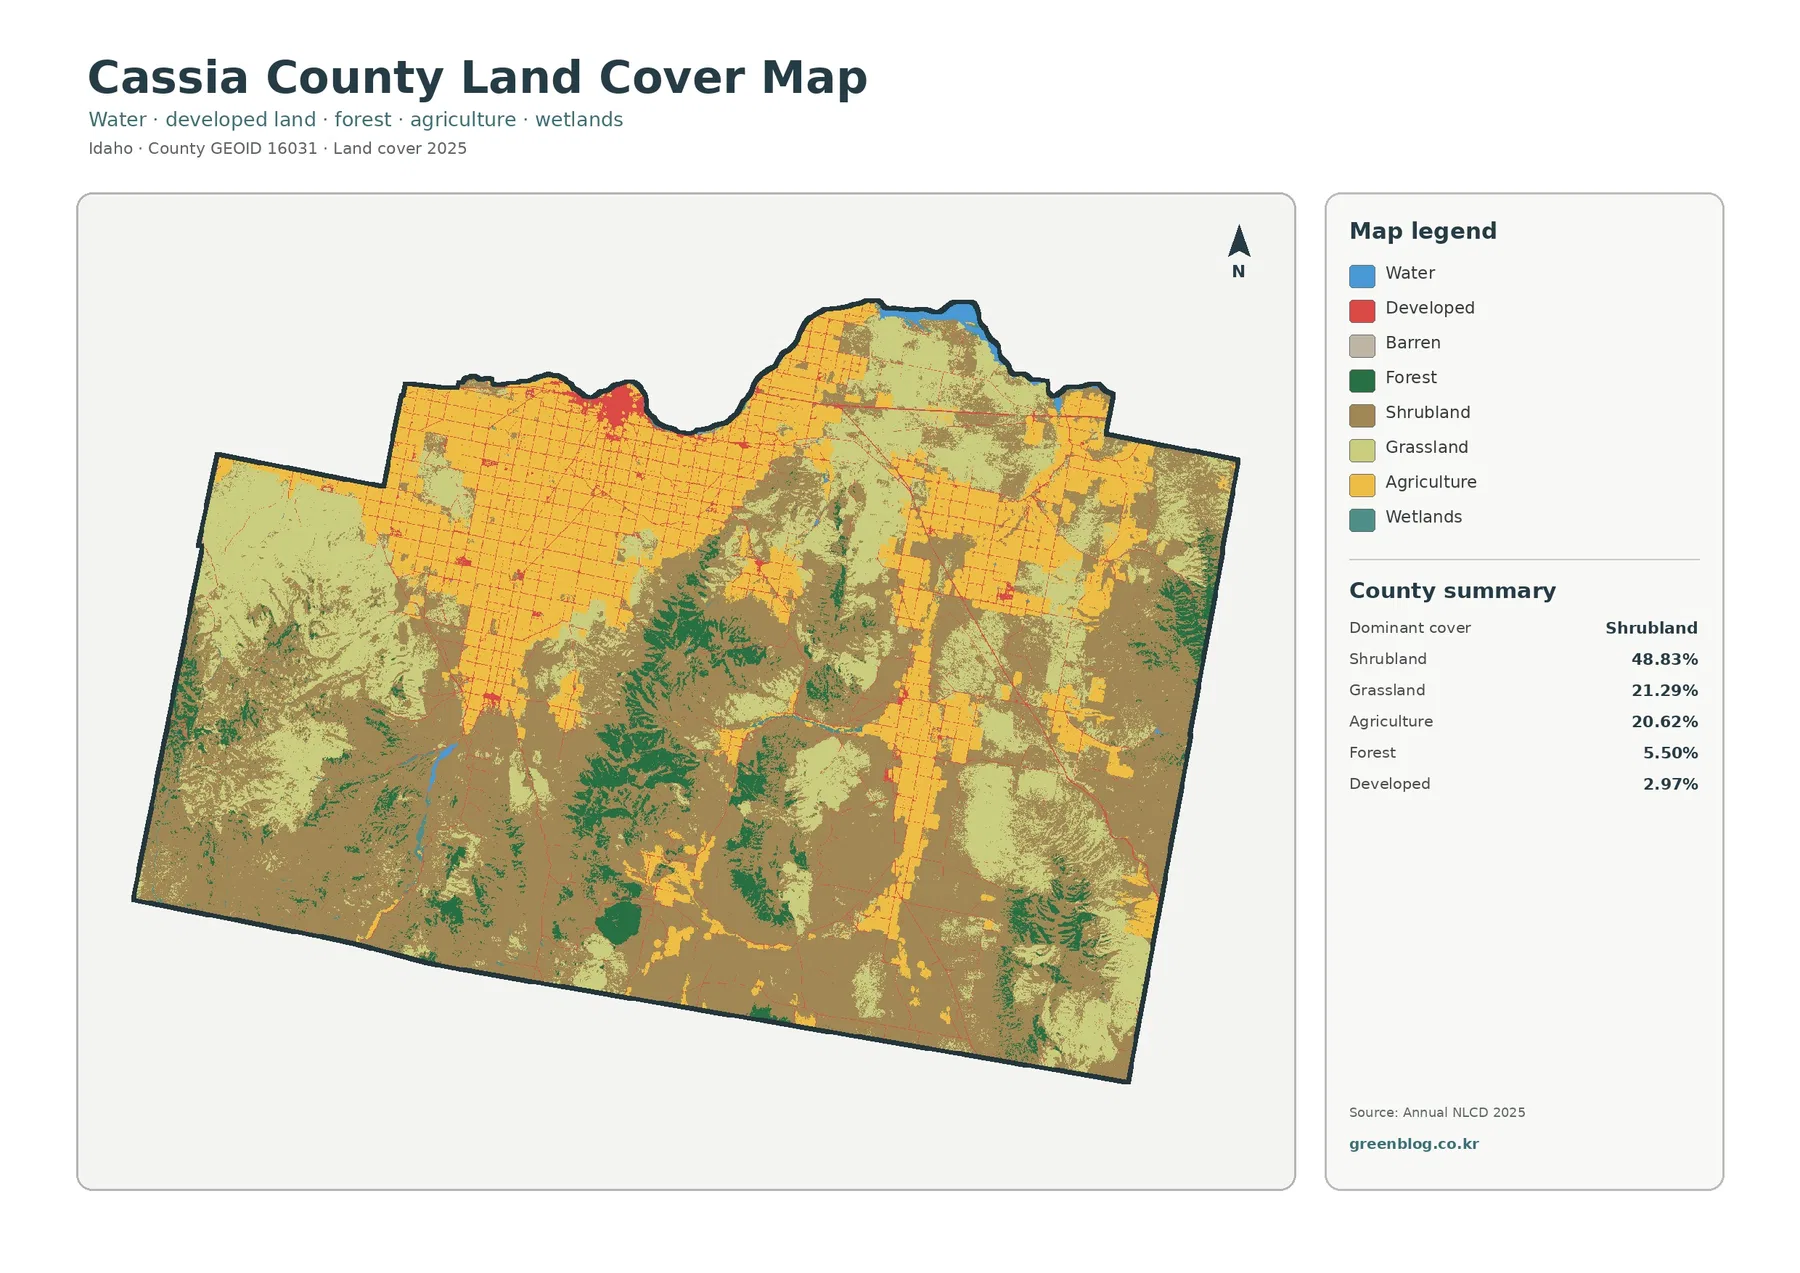
Shrubland is the largest class in the supplied county summary at 48.83 percent. Grassland follows at 21.29 percent and agriculture at 20.62 percent. Forest accounts for 5.50 percent, while developed land covers 2.97 percent. The companion forest-and-farmland view also reports water at 0.54 percent and wetlands at 0.25 percent. The percentages describe a county where built land is a small part of the total, but they do not show how strongly some classes are concentrated in particular districts.
The northern half makes that concentration obvious. Large yellow agricultural blocks form a regular grid across the northwest and north-central portion of the county, with additional farm areas toward the northeast. South of those fields, the pattern becomes much less geometric. Shrubland spreads over broad open areas, grassland appears in large patches, and forest follows irregular mountain-shaped zones rather than square field boundaries. The map is especially useful because it lets a reader see those changes inside one county outline instead of reducing the landscape to a single dominant percentage.
Why the farm pattern looks different from the mountain pattern
An East Cassia Soil and Water Conservation District plan describes a local landscape that includes the relatively flat to gently sloping Snake River Plain as well as the Sublett, Albion, Cotterel, Cassia, Black Pine, and Jim Sage mountain areas. That official description gives useful context for the visual contrast in the supplied maps. Regular agricultural blocks are concentrated on broad, gentler terrain, while forest and open shrub or grass cover become more prominent in the irregular mountain country. The same district plan describes agriculture as a major local economic base, while University of Idaho Extension highlights forage, alfalfa, and cereal production in Cassia County. Those references help explain the farm pattern without assigning a specific crop to any individual map cell. The land-cover image itself does not draw named mountain boundaries, so those names are context rather than labels taken from the map.
A simpler forest-and-farmland view makes the land-use contrast easier to see
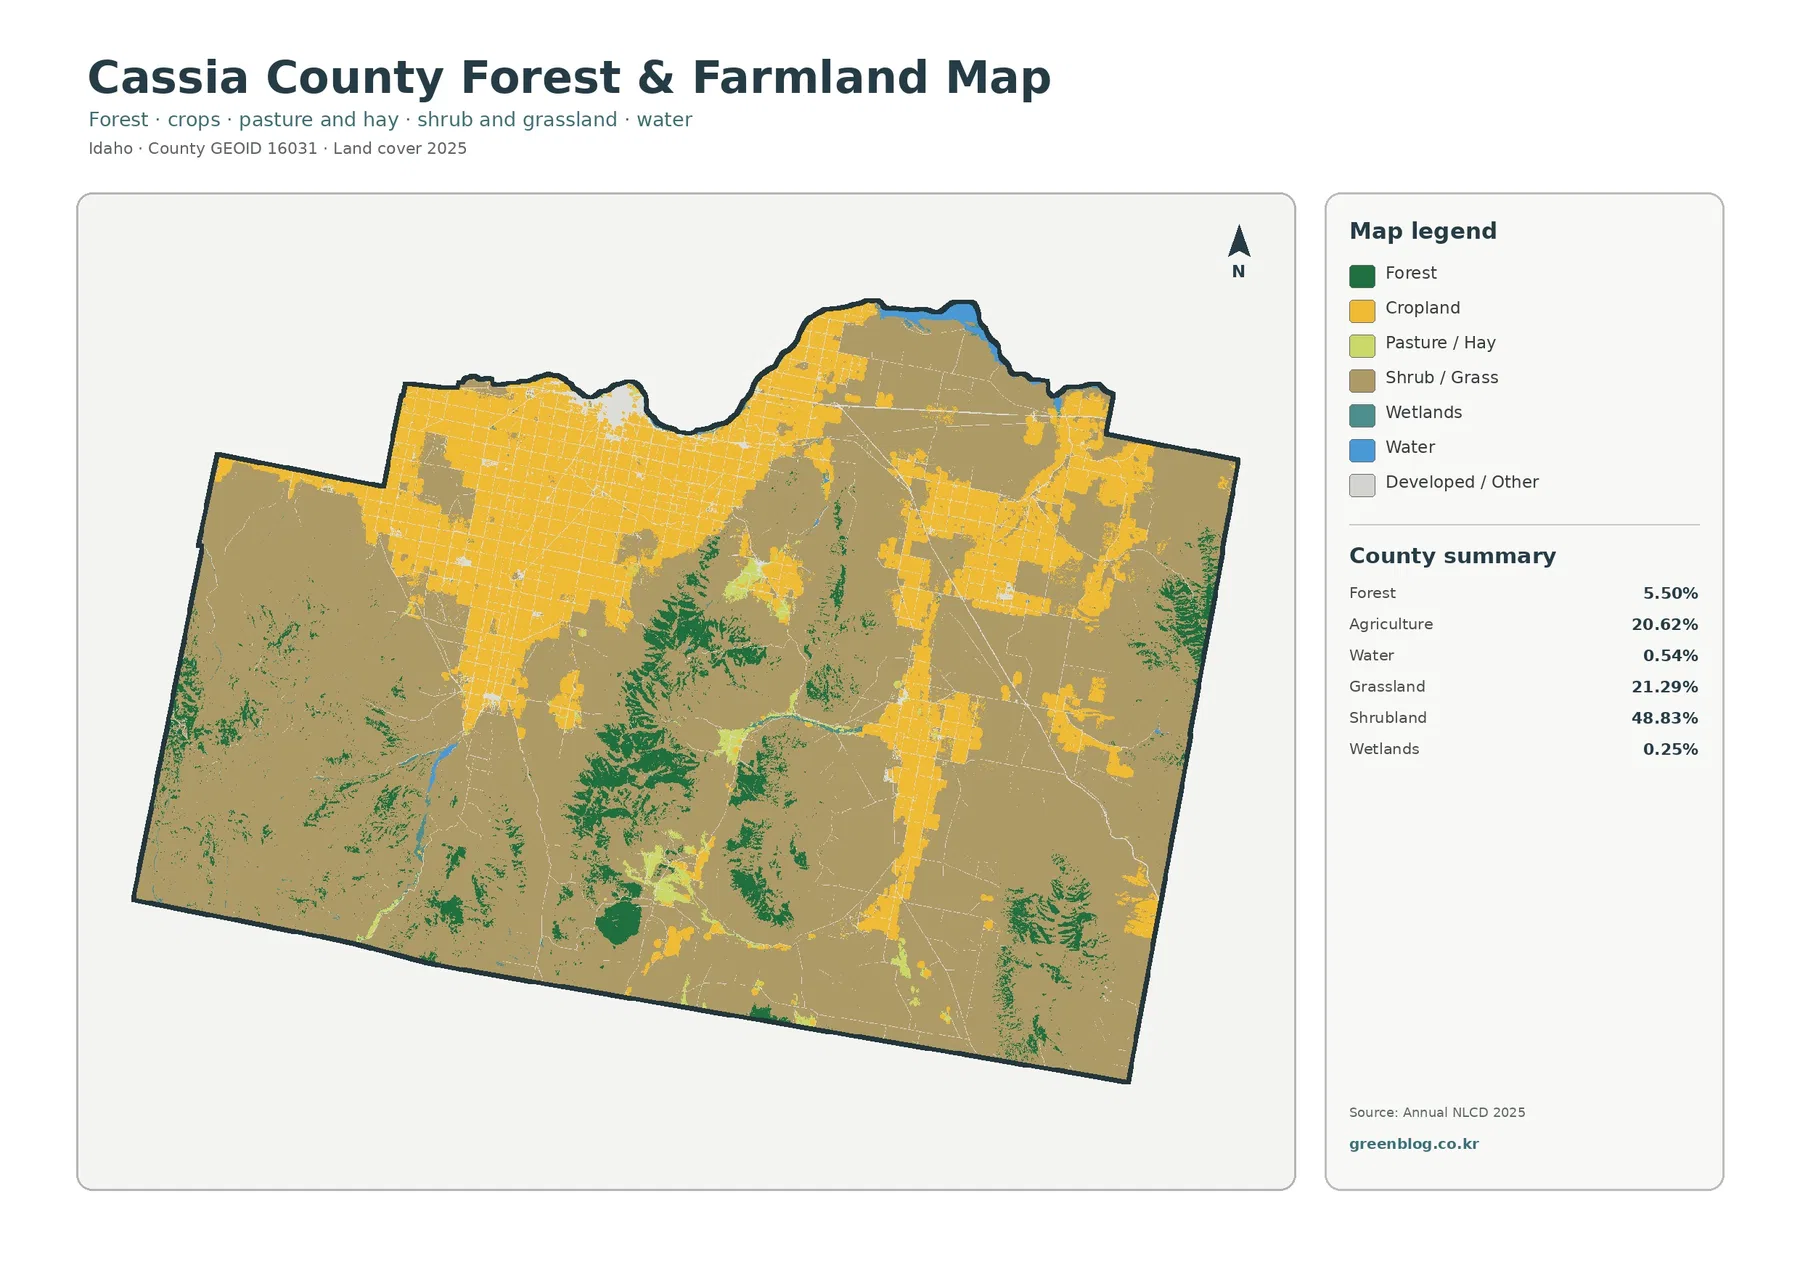
The second map reduces the number of categories so that working farmland can be compared directly with forest and open natural cover. Cropland becomes a broad yellow grid across the north, with smaller extensions along gentler areas farther south. Pasture and hay appear as lighter agricultural patches within or near the farm districts. Shrub and grass cover fill much of the space between those cultivated areas and the darker forested mountains.
Impervious surface reveals compact built areas that the county average can hide
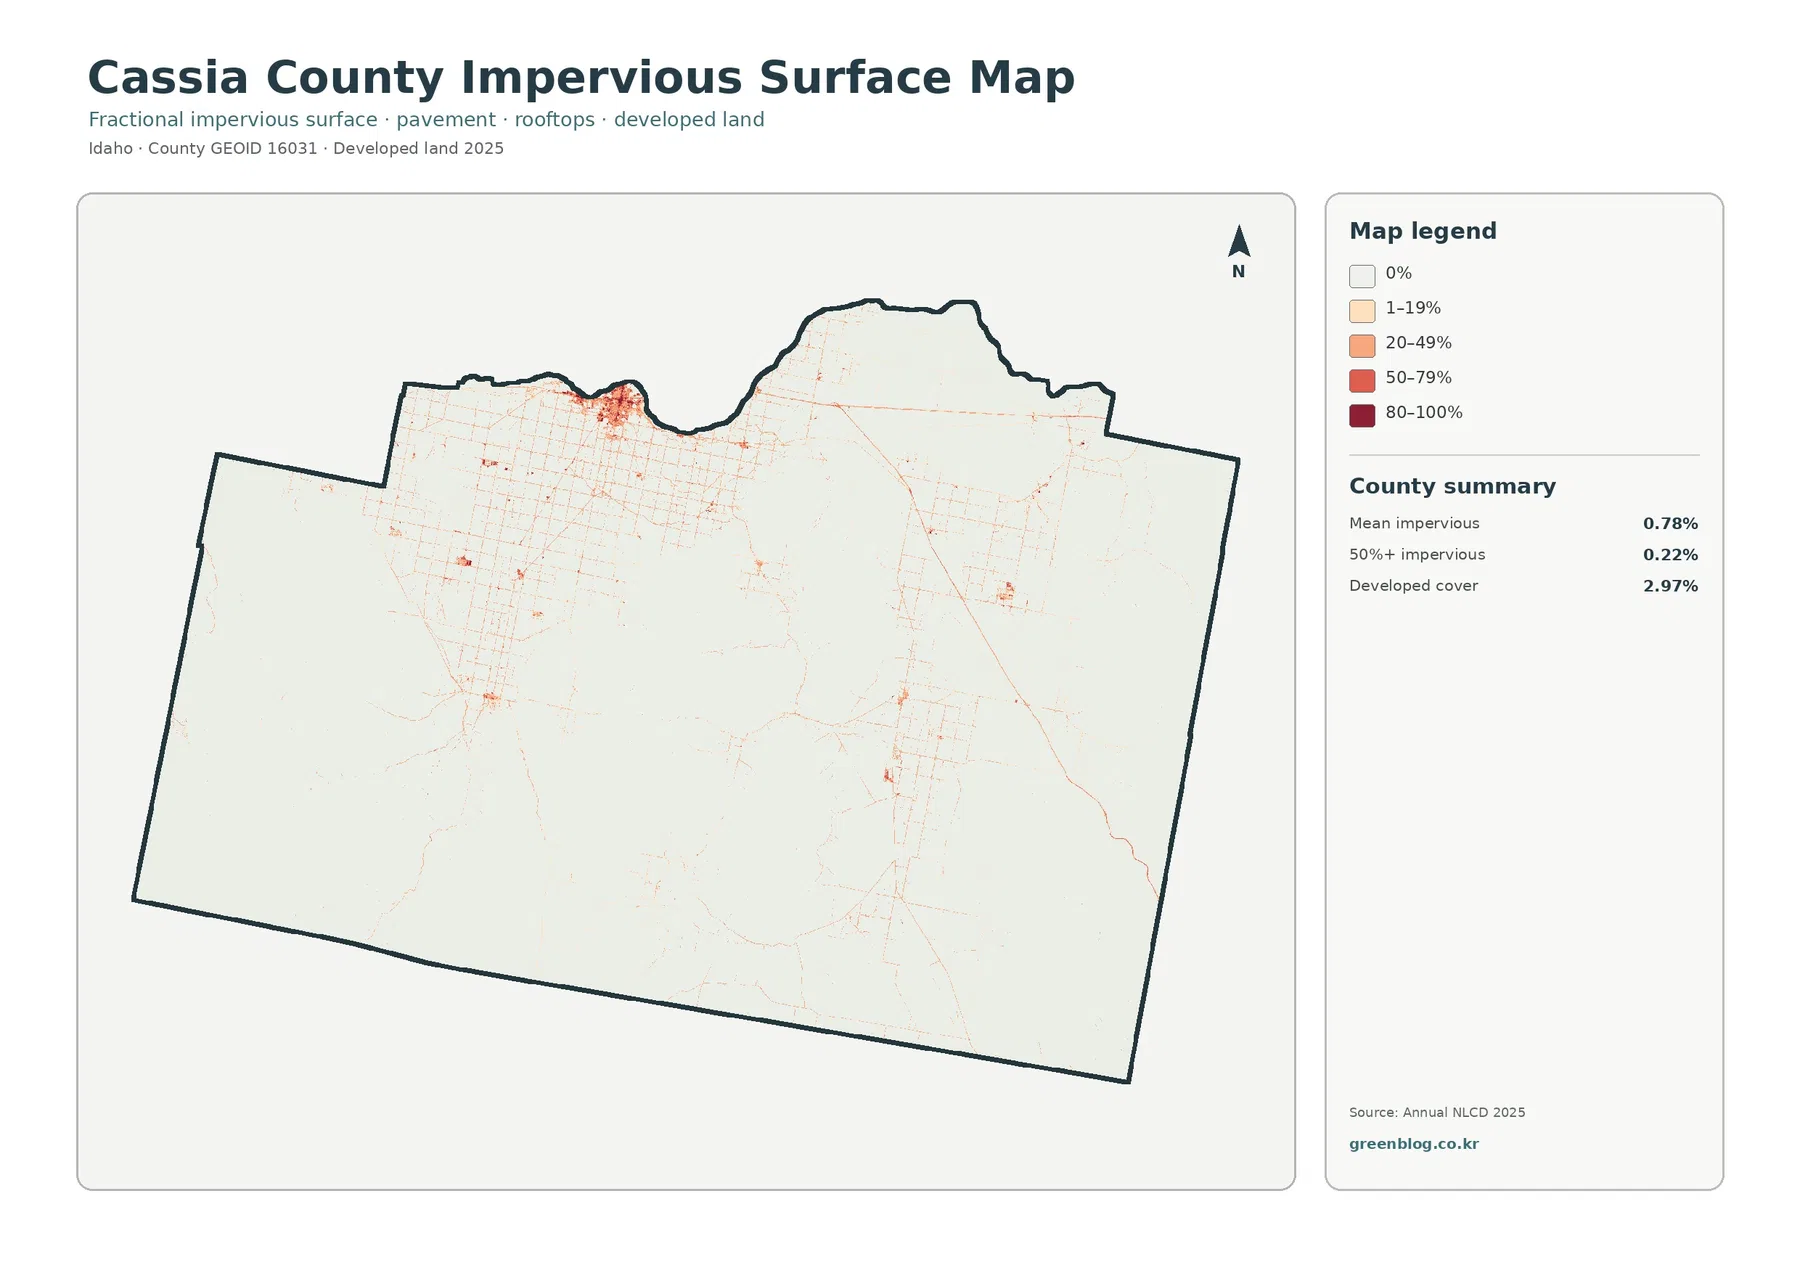
Impervious surface is the share of a mapped cell covered by hard material such as pavement, rooftops, and concrete that does not absorb water like soil or vegetation. Cassia County has a mean impervious value of 0.78 percent, and only 0.22 percent of the county is mapped at 50 percent impervious or higher. Those values are much smaller than the 2.97 percent developed-land share because “developed” and “impervious” measure different things. A residential area can be developed while still containing lawns, trees, bare soil, or other permeable surfaces.
Most of the impervious map is intentionally very pale. Against that background, the Burley area near the northern edge forms the clearest concentration, while roads appear as thin lines through the surrounding agricultural grid. Smaller clusters are visible elsewhere, including isolated settlement nodes and road junctions. Farther south, the mountain and rangeland sections remain mostly light, emphasizing how limited highly built surfaces are across the county as a whole.
The 1985–2025 layer marks classification differences, not one conversion rate
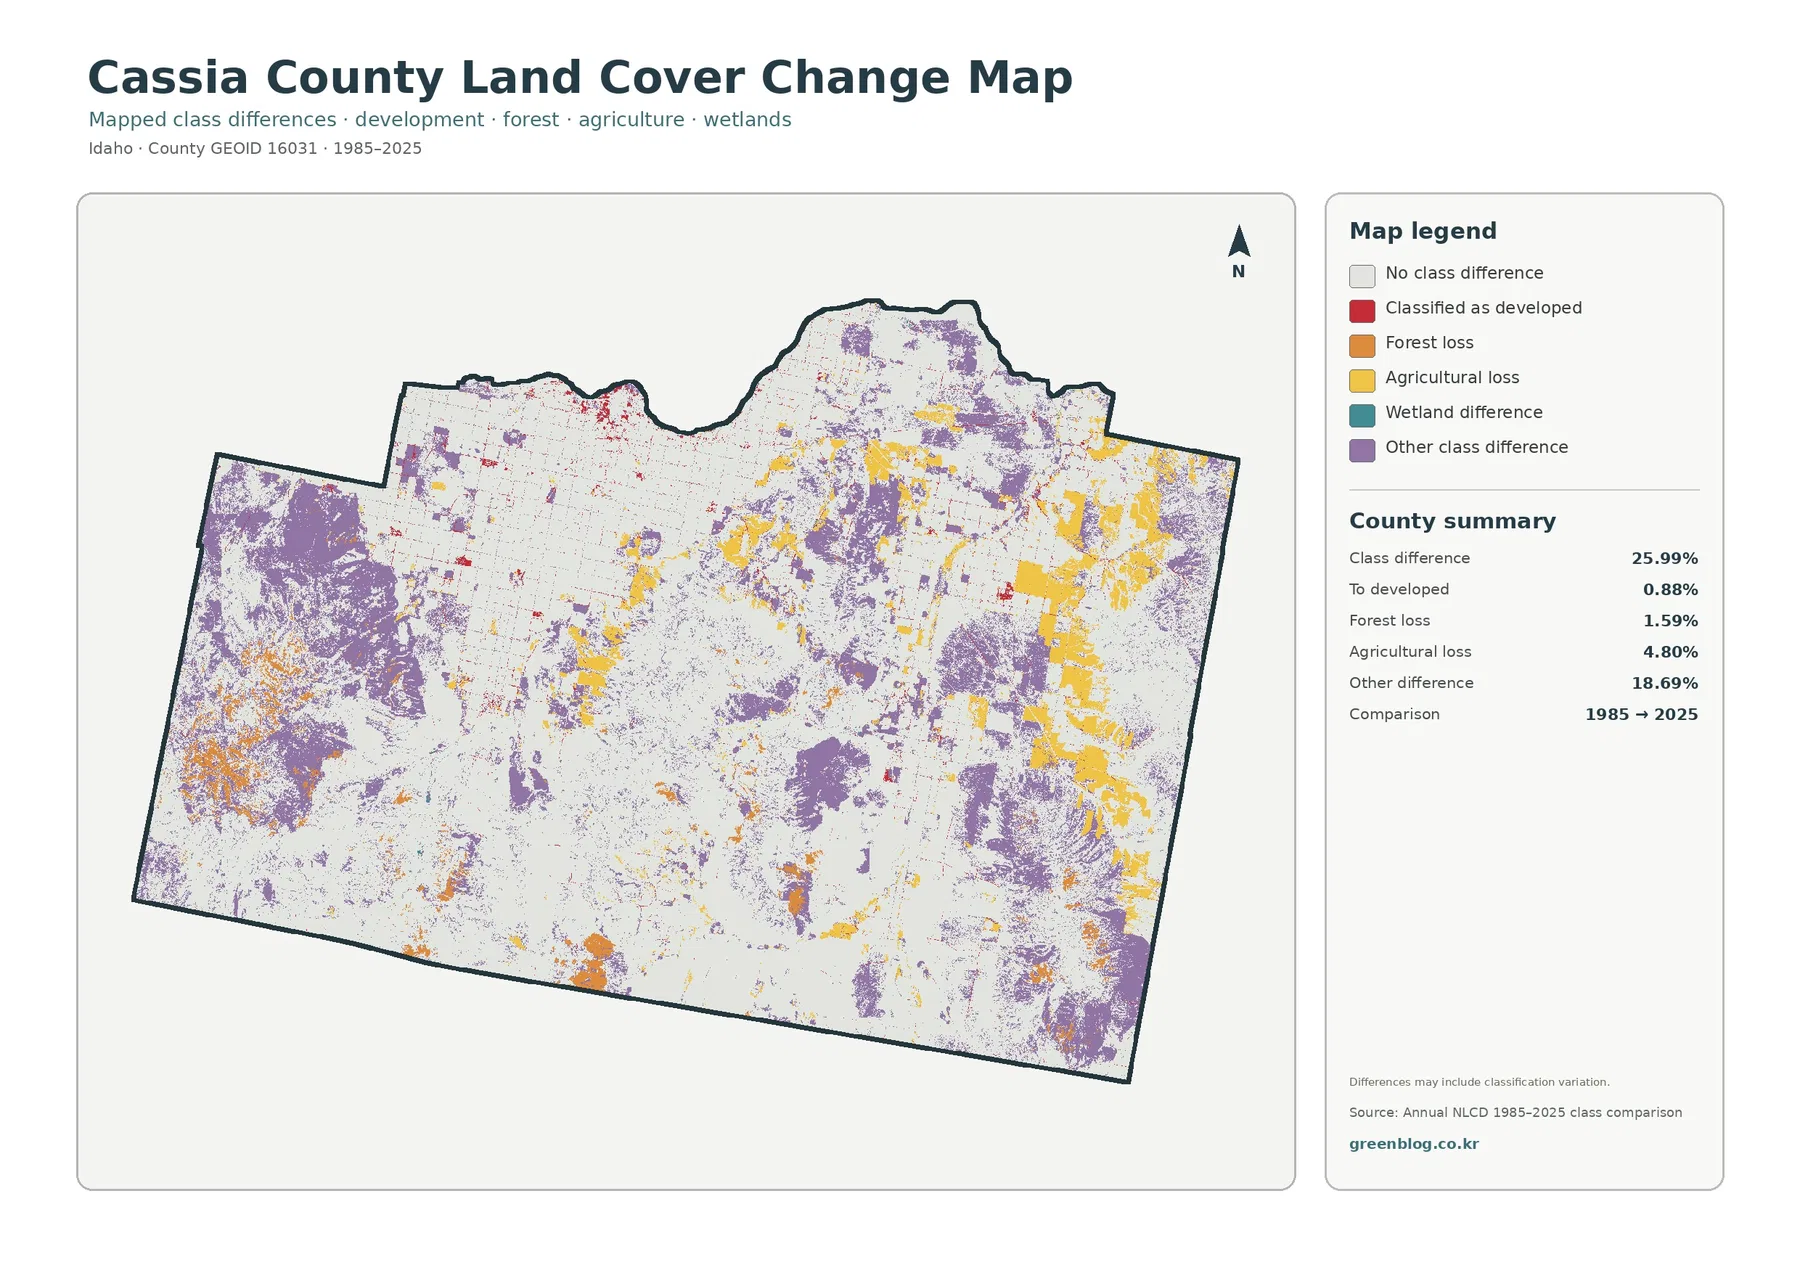
The largest number on the change map is a total class difference of 25.99 percent. It is important not to translate that directly into a claim that one quarter of Cassia County was developed or permanently converted. The map itself warns that differences may include classification variation. A safer interpretation is that 25.99 percent of the mapped county received a different class label at the two endpoints, creating a set of places that may deserve closer investigation.
The supplied summary breaks out 0.88 percent classified to developed, 1.59 percent forest loss, 4.80 percent agricultural loss, and 18.69 percent other class difference. Purple “other” differences are widespread in portions of the southwest and in several mountain areas. Agricultural-loss colors are visible around the edges of northern and northeastern farm blocks, while forest-loss markings occur in smaller patches within or near wooded terrain. Red developed-change cells occupy a much smaller area and are easiest to notice near existing developed centers and transportation lines.
Choosing the right Cassia County map for a specific task
For a general county reference, start with the 2025 land-cover map. It preserves the widest set of categories and makes the 48.83 percent shrubland share, the northern farm grid, mountain forest, small developed centers, wetlands, and water visible together. When the main question is agricultural geography, the forest-and-farmland map is faster to read because it removes some category detail and gives the field pattern more visual space.
Scale, dates, and boundaries matter when reading the maps
The supplied land-cover products come from the Annual NLCD family. USGS documentation describes Annual NLCD land cover as a 30-meter raster product. A raster divides the landscape into grid cells, and the mapped value represents information at that scale. Real ground conditions can be more complicated than a cell boundary: a road may cross vegetation, a farm edge may include a ditch or windbreak, and a developed cell may contain both buildings and yards. Small or narrow features can therefore be generalized.
County percentages are best used for broad comparison. Saying that shrubland covers 48.83 percent or agriculture covers 20.62 percent is useful when describing the overall composition of Cassia County, but those values should not be applied to a specific parcel without more detailed information. Land cover does not determine ownership, zoning, building rights, irrigation rights, or legal wetland status. Those questions belong to official county records, agency maps, surveys, and current site information.
Dates are equally important. The 2025 map represents the mapped product year and cannot automatically include development, crop changes, vegetation changes, or disturbances that occurred afterward. The 1985–2025 layer compares two endpoints rather than showing every event that happened during the forty-year period. A project concerned with a recent construction site, fire, field conversion, or changing wetland condition should use these maps as context and then verify the current situation with newer imagery or local records.
Frequently Asked Questions
What is the dominant land-cover class in Cassia County?
At 48.83 percent, shrubland is the dominant class in the supplied 2025 summary. Grassland follows at 21.29 percent and agriculture at 20.62 percent. Shrub and grass cover are especially extensive across the southern and western parts of the county, while the large agricultural grid is concentrated mainly in the north.
Why does farmland look so prominent when agriculture is 20.62% of the county?
Agricultural cover is concentrated rather than evenly distributed. Large, connected field blocks in the north and northeast create a strong visual pattern even though most of the county is classified as shrubland, grassland, forest, developed land, water, or wetlands. A county-wide percentage and a locally dominant landscape can both be true at the same time.
Does the 25.99% class difference mean that 25.99% of Cassia County was permanently converted?
No. The map compares class labels at the 1985 and 2025 endpoints, and the supplied legend states that differences may include classification variation. The layer is useful for locating places where the two endpoints differ, but permanent conversion and its cause should be confirmed with annual data, imagery, or local records.
Map File Information
The ZIP contains the four original JPG map files prepared for Cassia County.
- Included Versions: land cover, forest and farmland, impervious/developed land, and land-cover change
- File Type: ZIP containing four JPG files
- Intended Use: printing, county comparison, classroom reference, and presentations
Related Maps
Sources and References
- MRLC Annual NLCD Data – official access to Annual NLCD land-cover, impervious-surface, and change products
- USGS Annual NLCD Land Cover Classification – land-cover classes and guidance for interpreting the 30-meter raster product
- University of Idaho Extension – Agriculture in Cassia County – county-specific information on forage, alfalfa, cereal production, and farm management
- East Cassia Soil & Water Conservation District FY2026 Plan – local topography, agriculture, communities, and natural-resource context
- U.S. Census Bureau TIGER/Line Shapefiles – county boundary reference
Green Map creates custom-edited map images using open geographic data sources such as geoBoundaries, Natural Earth, OpenStreetMap, and government open data. These maps are edited visual materials, not raw data files, and are provided for education, documents, presentations, and graphic reference.