Clark County in eastern Idaho is dominated by open shrubland, while forest becomes much more visible along the mountainous northern and eastern parts of the county. The 2025 summary places shrubland at 65.80%, followed by forest at 16.57%, grassland at 9.69%, agriculture at 4.09%, and wetlands at 2.36%.
The maps can be viewed on the page, and the four original JPG files are available together in one ZIP below. That makes it possible to start with the county-wide pattern, then switch to a simpler farm-and-forest view, inspect the small developed corridors, or locate places where the two comparison years received different land-cover classes.
Table of Contents
A shrubland-dominant county with forest around the mountain margins
The most important fact in the Clark County land-cover summary is the scale of shrubland. At 65.80%, it covers far more of the county than any other category.
County planning material helps explain the geographic setting without turning the land-cover map into a topographic map. Clark County describes its southern and southeastern area as part of the upper Snake River Plain, with gently sloping surfaces, foothills, and bench lands where sagebrush and grasses are common.
Land cover should not be confused with land use. A shrubland cell tells the reader what vegetation is dominant at the surface; it does not say whether that ground is privately owned, publicly managed, leased for grazing, zoned for a particular purpose, or legally available for development.
Where the 2025 cover map changes from open ground to mountain forest
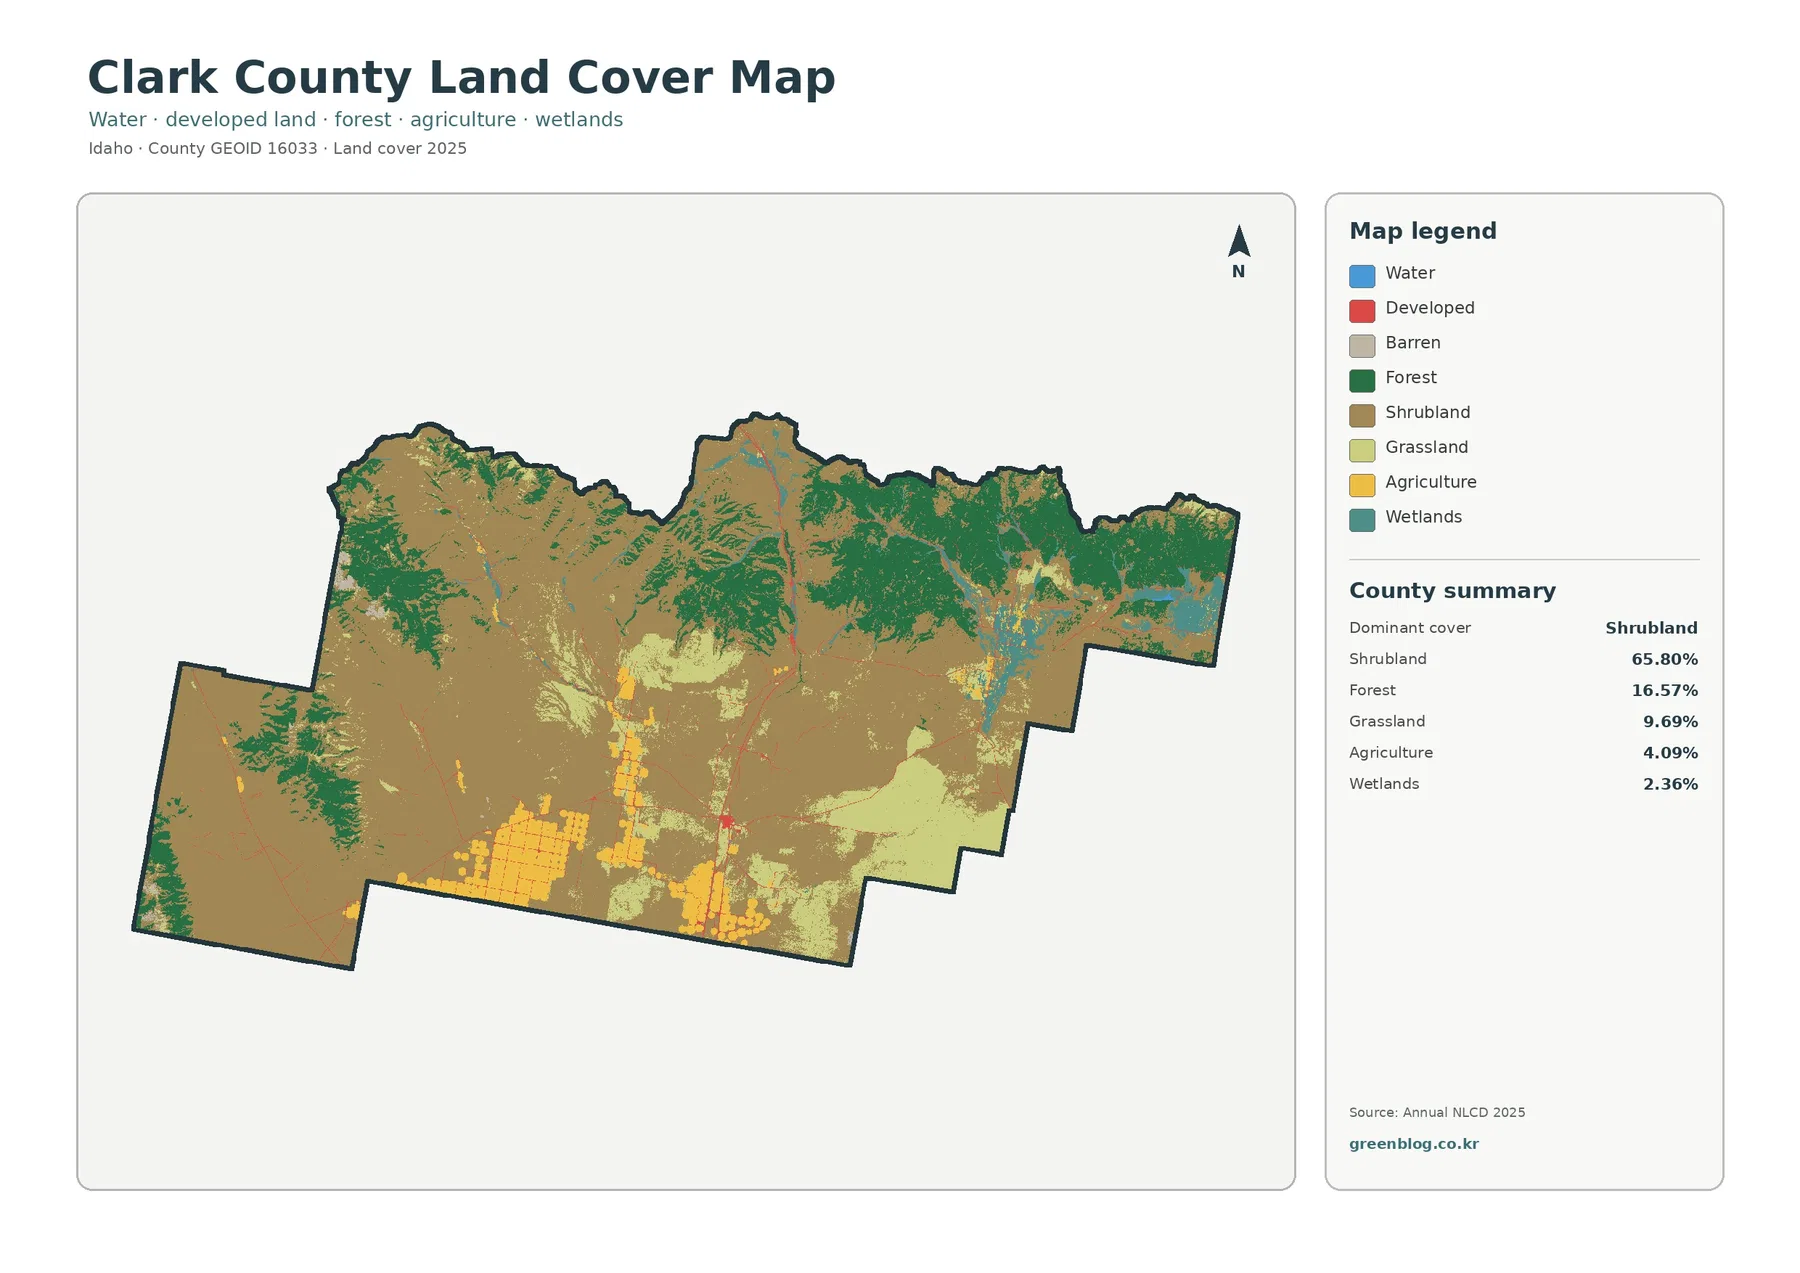
The general land-cover map is the best place to see the county as one landscape. Brown shrubland forms a large, nearly continuous background across the middle and southern sections.
Agriculture accounts for only 4.09% of the county, but it is visually noticeable because the yellow areas are clustered rather than evenly dispersed. The largest block lies in the southern part of the county, where rectangular and circular field patterns stand out sharply against surrounding shrubland.
Wetlands make up 2.36% of the summary and appear much more selectively. Teal lines and patches are easiest to see in the eastern and northeastern part of the county, with narrower wet features also tracing some drainage areas farther north.
Developed cover is also sparse. The general map contains only small red marks compared with the huge area of shrubland, grassland, and forest.
Farm blocks become clearer when forest and working land are simplified
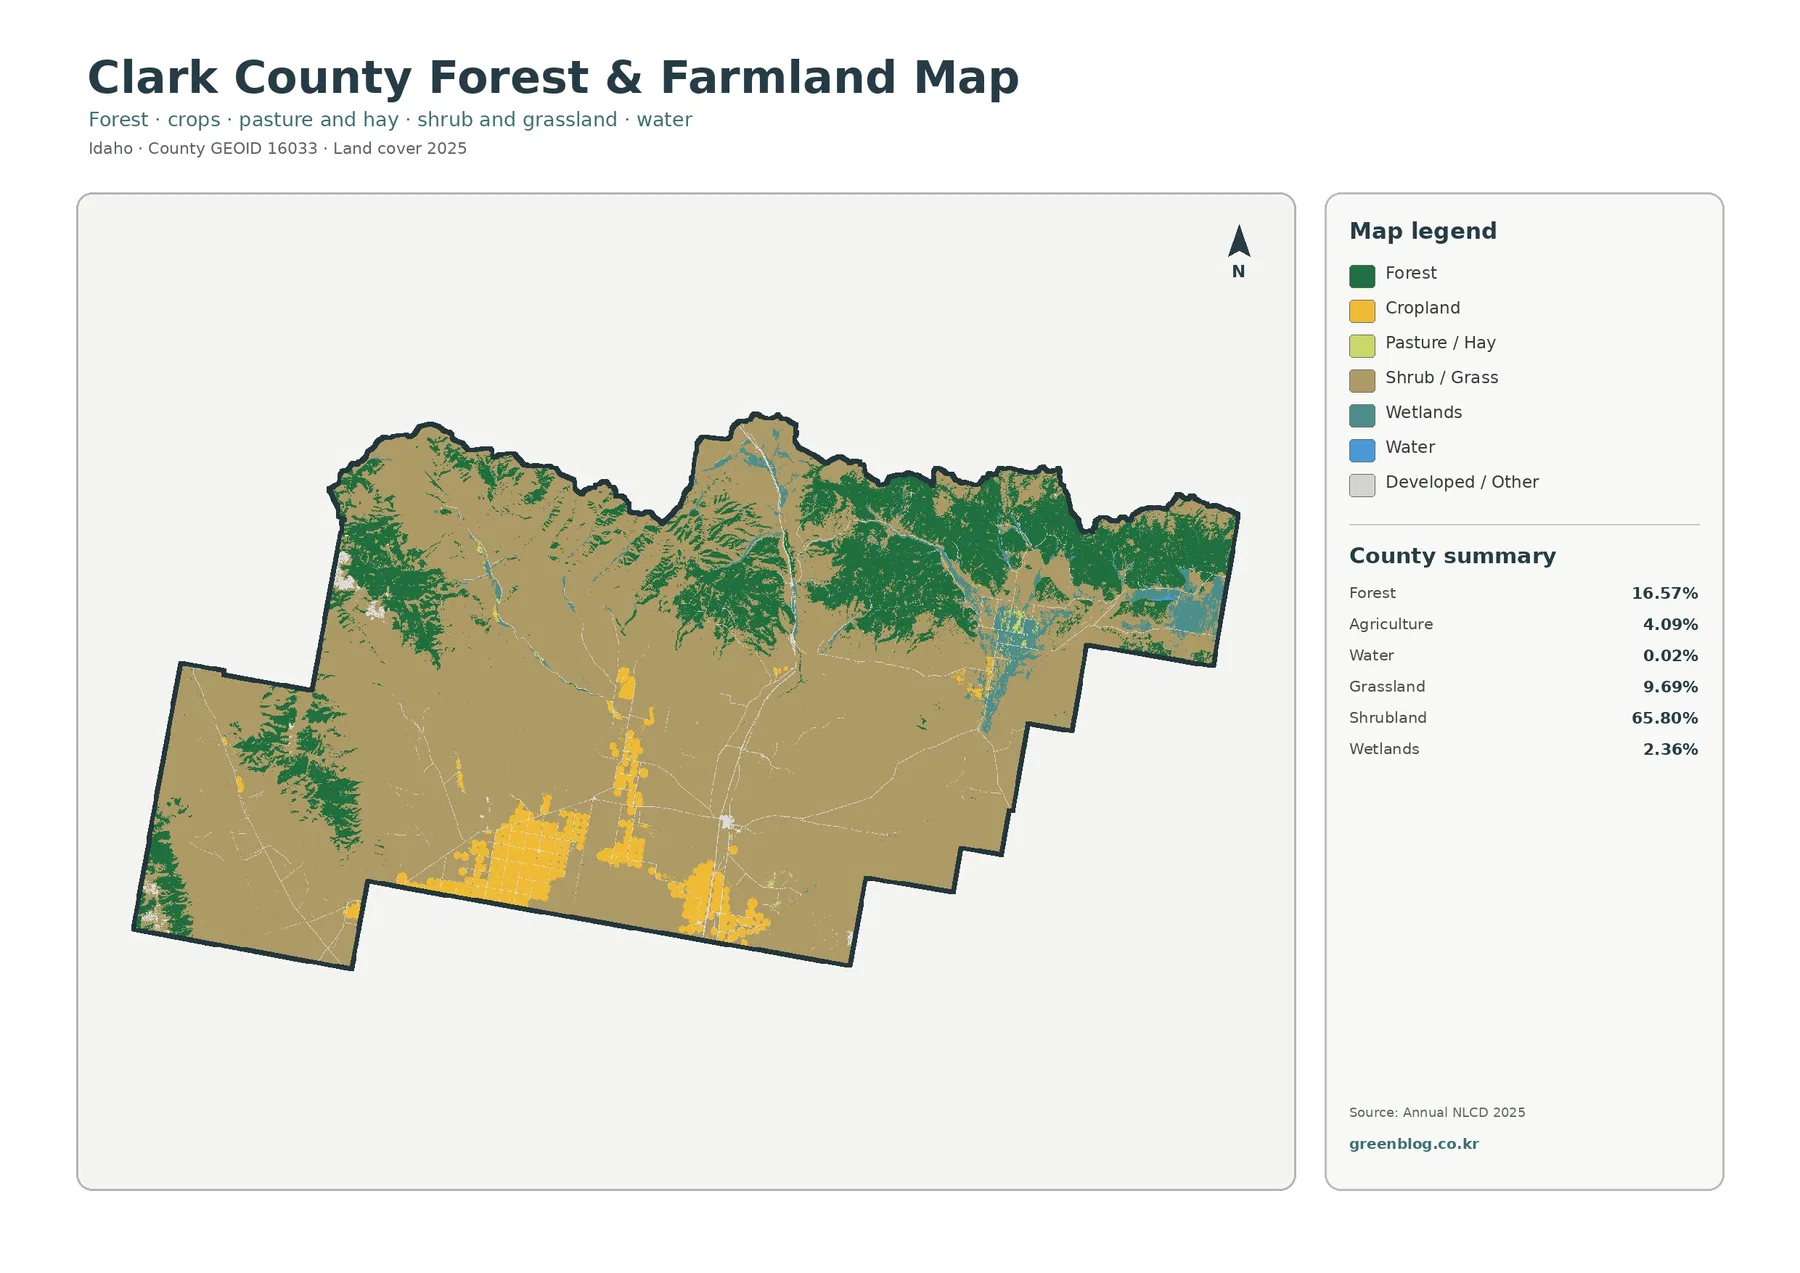
The forest-and-farmland view removes some of the detail that can make the general map busy. Shrub and grass become a broad neutral background, while cropland stands out in yellow and forest remains dark green.
University of Idaho Extension in Clark County lists forage and livestock production, crop production, pasture management, farm business topics, and small-acreage farming among its local programs. The Clark Soil Conservation District also describes irrigated pasture and hayland in low-elevation areas and mountain valleys, with cropland and rangeland occurring within the broader local resource system.
The separation between forest and open ground is also easier to follow in this version. Large forest blocks run along the northern and eastern mountain country, while the south and center remain mostly shrub and grass.
For close property-level work, however, the simplified map has important limits. Annual NLCD is a raster product, so the landscape is represented by grid cells rather than surveyed parcel lines.
A 0.28% mean impervious surface reveals just how sparse the built footprint is
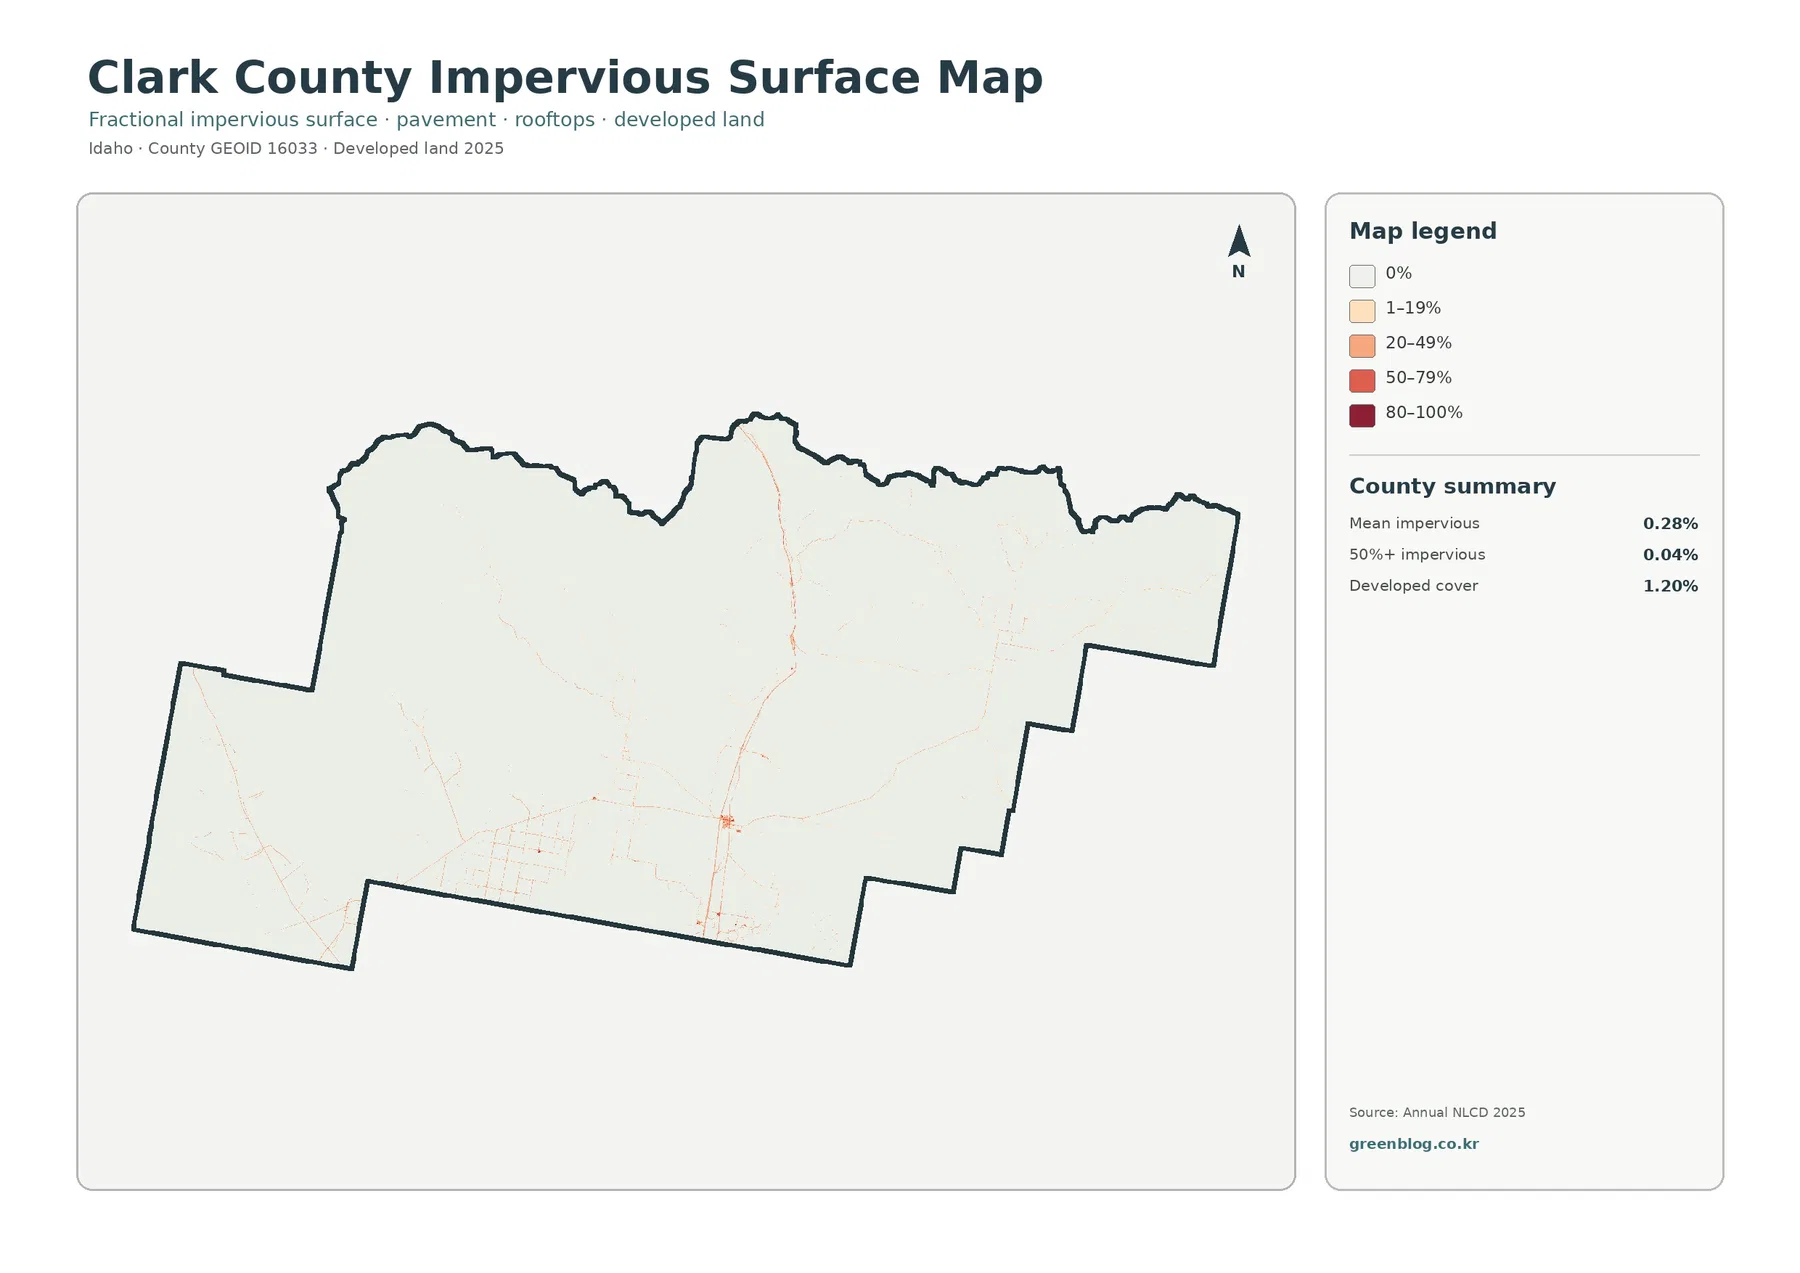
Impervious surface means pavement, rooftops, concrete, and similar surfaces that do not readily absorb water. Clark County’s county-wide mean is only 0.28%, and just 0.04% of the county falls in cells that are at least 50% impervious.
The built pattern becomes visible only when the map is read closely. Dubois forms the clearest small node in the south-central area, where several roads meet and a stronger orange-red mark appears.
The difference between 1.20% developed cover and a 0.28% mean impervious surface is expected because the two measures describe different things. A developed NLCD class can include houses, yards, vegetation, soil, and pavement in the same area.
The 12.17% class difference is a comparison signal, not a simple change rate
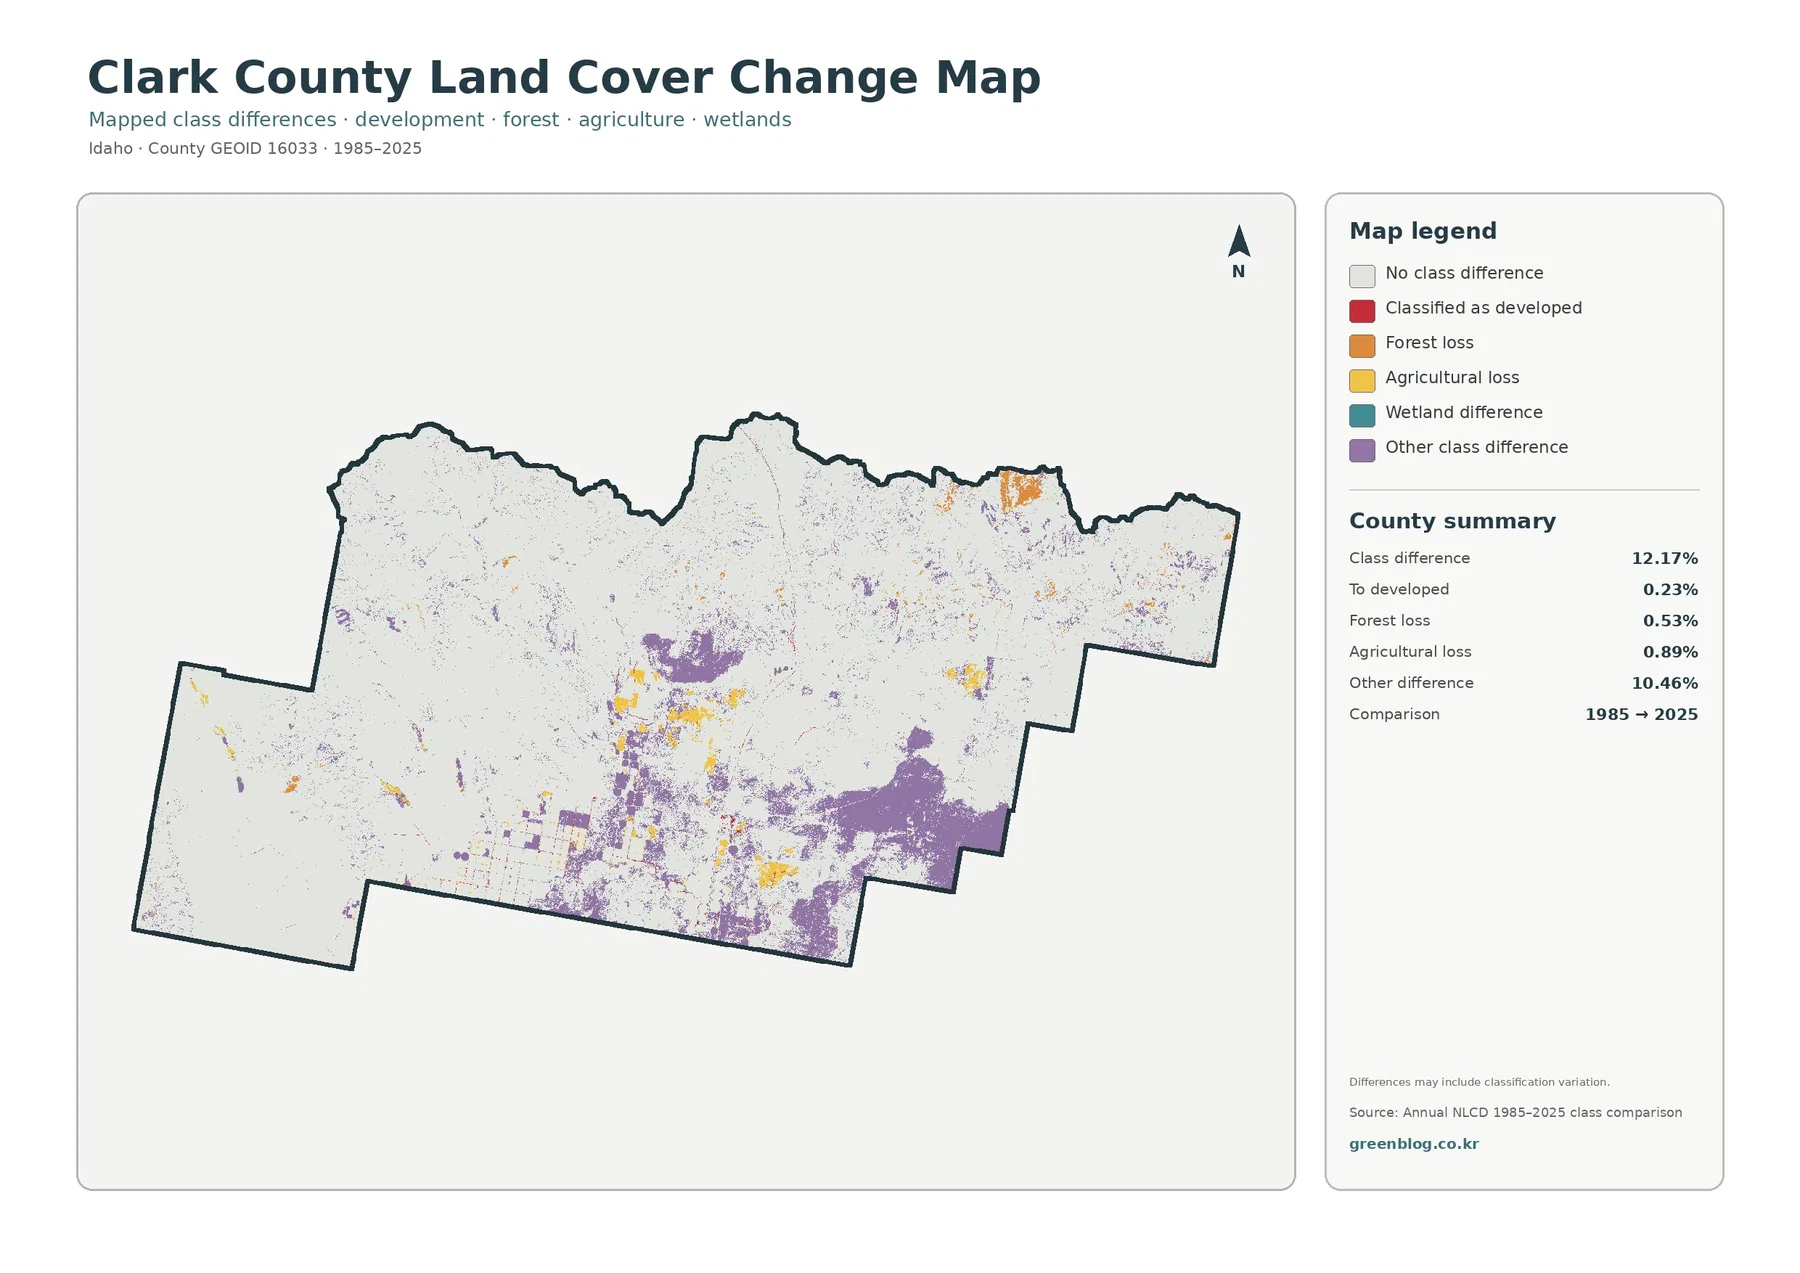
The change map needs more caution than the other three maps. Its total class difference is 12.17%, but that number does not mean 12.17% of Clark County was permanently converted to a new land use.
The breakdown makes that limitation clear. Only 0.23% is labeled as classified to developed, 0.53% as forest loss, and 0.89% as agricultural loss.
Yellow agricultural-loss patches are most noticeable around the southern farm district and smaller cultivated areas. Orange forest-loss marks appear in portions of the northern and northeastern wooded zones and in a few other forest edges.
The map also compares endpoints rather than every year in between. A location with the same class in 1985 and 2025 could still have experienced temporary changes during the intervening decades.
The upper Snake River Plain and mountain country help explain the color pattern
Clark County’s own planning information describes substantial variation in elevation and terrain. The southern and southeastern parts lie on the upper Snake River Plain, while mountain ranges rise toward other parts of the county boundary.
The Clark Soil Conservation District adds more local detail around Camas Creek and nearby agricultural and pasture settings. Its plan describes irrigated pasture and hayland in low areas and higher mountain valleys, cropland and rangeland uses, and varied soils across the subbasin.
Wetland cover in the east and northeast is another example of why local geography matters. The teal patches and narrow bands are more concentrated there than in much of the southern shrubland.
Choosing the right Clark County map for the question
Use the general land-cover map when the goal is to understand the county at a glance. It is the only one of the four that puts shrubland, grassland, forest, agriculture, wetlands, water, and developed land into the same visual frame.
The forest-and-farmland map is better when the main question is where farming, pasture or hay, and forest occur relative to open shrub and grass. The impervious map is the choice for settlement and transportation corridors because it separates the tiny built footprint from the surrounding natural surface.
The on-page WebP previews are convenient for quick comparison. The original JPG files are more useful when a small wetland strip, road, forest edge, or farm block needs to be enlarged for closer inspection or printed.
How to read percentages and boundaries without overinterpreting them
Annual NLCD is a raster data product. In simple terms, the landscape is divided into grid cells and each cell stores a classification or a percentage value.
County-wide shares such as 65.80% shrubland and 16.57% forest are valuable for broad comparison, but they are not parcel statistics. A shrubland color does not establish a grazing permit or zoning category.
Date is another limitation. The main cover and impervious maps are based on the supplied 2025 product, so very recent construction, vegetation change, fire effects, or farming changes may not appear.
Practical ways to use the Clark County map set
For a county overview, start with the land-cover map and explain the dominance of shrubland before moving to the mountain forest and small agricultural share. A classroom or presentation can then use the forest-and-farmland map to make the north-south contrast easier to see.
Natural-resource or agricultural reference work can begin with the simplified farm-and-forest view, then return to the full map for wetlands and grassland. If a particular field edge, road corridor, or forest boundary looks important, the JPG version can be enlarged before comparing it with local records or newer imagery.
Frequently Asked Questions
What is the largest land-cover type in Clark County?
Shrubland is the dominant 2025 category at 65.80%. Forest is 16.57%, grassland 9.69%, agriculture 4.09%, and wetlands 2.36%. The map shows shrubland across much of the center and south, while the larger forest blocks are concentrated mainly around the northern and eastern mountain country.
Why do the southern farm areas stand out when agriculture is only 4.09%?
The agricultural cover is clustered rather than spread evenly through the county. Large, regular yellow field patterns occupy a limited southern area, so they contrast strongly with the much larger shrubland background.
Does the 12.17% class difference mean 12.17% of the county truly changed land use?
No. The supplied map warns that the comparison can include classification variation, and 10.46% of the county is placed in the broad “other difference” category.
Map File Information
The four original Clark County land-cover JPG maps are provided together in one ZIP file.
- Included Files: land cover map, forest and farmland map, impervious and developed land map, land cover change map
- File Type: ZIP containing four JPG files
- Intended Use: printing, regional comparison, classroom reference, and presentations
Related Maps
Sources and references
- MRLC Annual NLCD Data – official access to Annual NLCD land cover, impervious, and annual products
- USGS Annual NLCD Land Cover Classification – land-cover classes and 30-meter raster interpretation
- University of Idaho Extension – Clark County – local forage, livestock, crop, pasture, and small-acreage programs
- Clark County, Idaho Planning Information – local Snake River Plain, mountain, sagebrush, and forest context
- Clark Soil Conservation District FY2026 Plan – Camas Creek, pasture, cropland, soil, and local natural-resource context
Green Map creates custom-edited map images using open geographic data sources such as geoBoundaries, Natural Earth, OpenStreetMap, and government open data. These maps are edited visual materials, not raw data files, and are provided for education, documents, presentations, and graphic reference.