Ada County has one of the sharpest internal contrasts in this map series. The 2025 summary is led by grassland at 50.42%, while shrubland accounts for 19.39% and developed land for 19.38%. Agriculture covers 9.68%. Water, forest, and wetlands are much smaller shares, yet they help define the river corridor, reservoir edge, and scattered natural patches that break up the broader open landscape.
The page pairs four views of that landscape: current land cover, forest and farmland, impervious surface and developed land, and a 1985–2025 class-difference map. The WebP versions are placed with the discussion, and the four original 2480 × 1754 JPG files are available together in one download below. They are especially useful for comparing the Boise-area built footprint with the much more open grassland and shrubland that dominate the southern part of the county.
Table of Contents
A dense northern urban footprint gives way quickly to open southern country
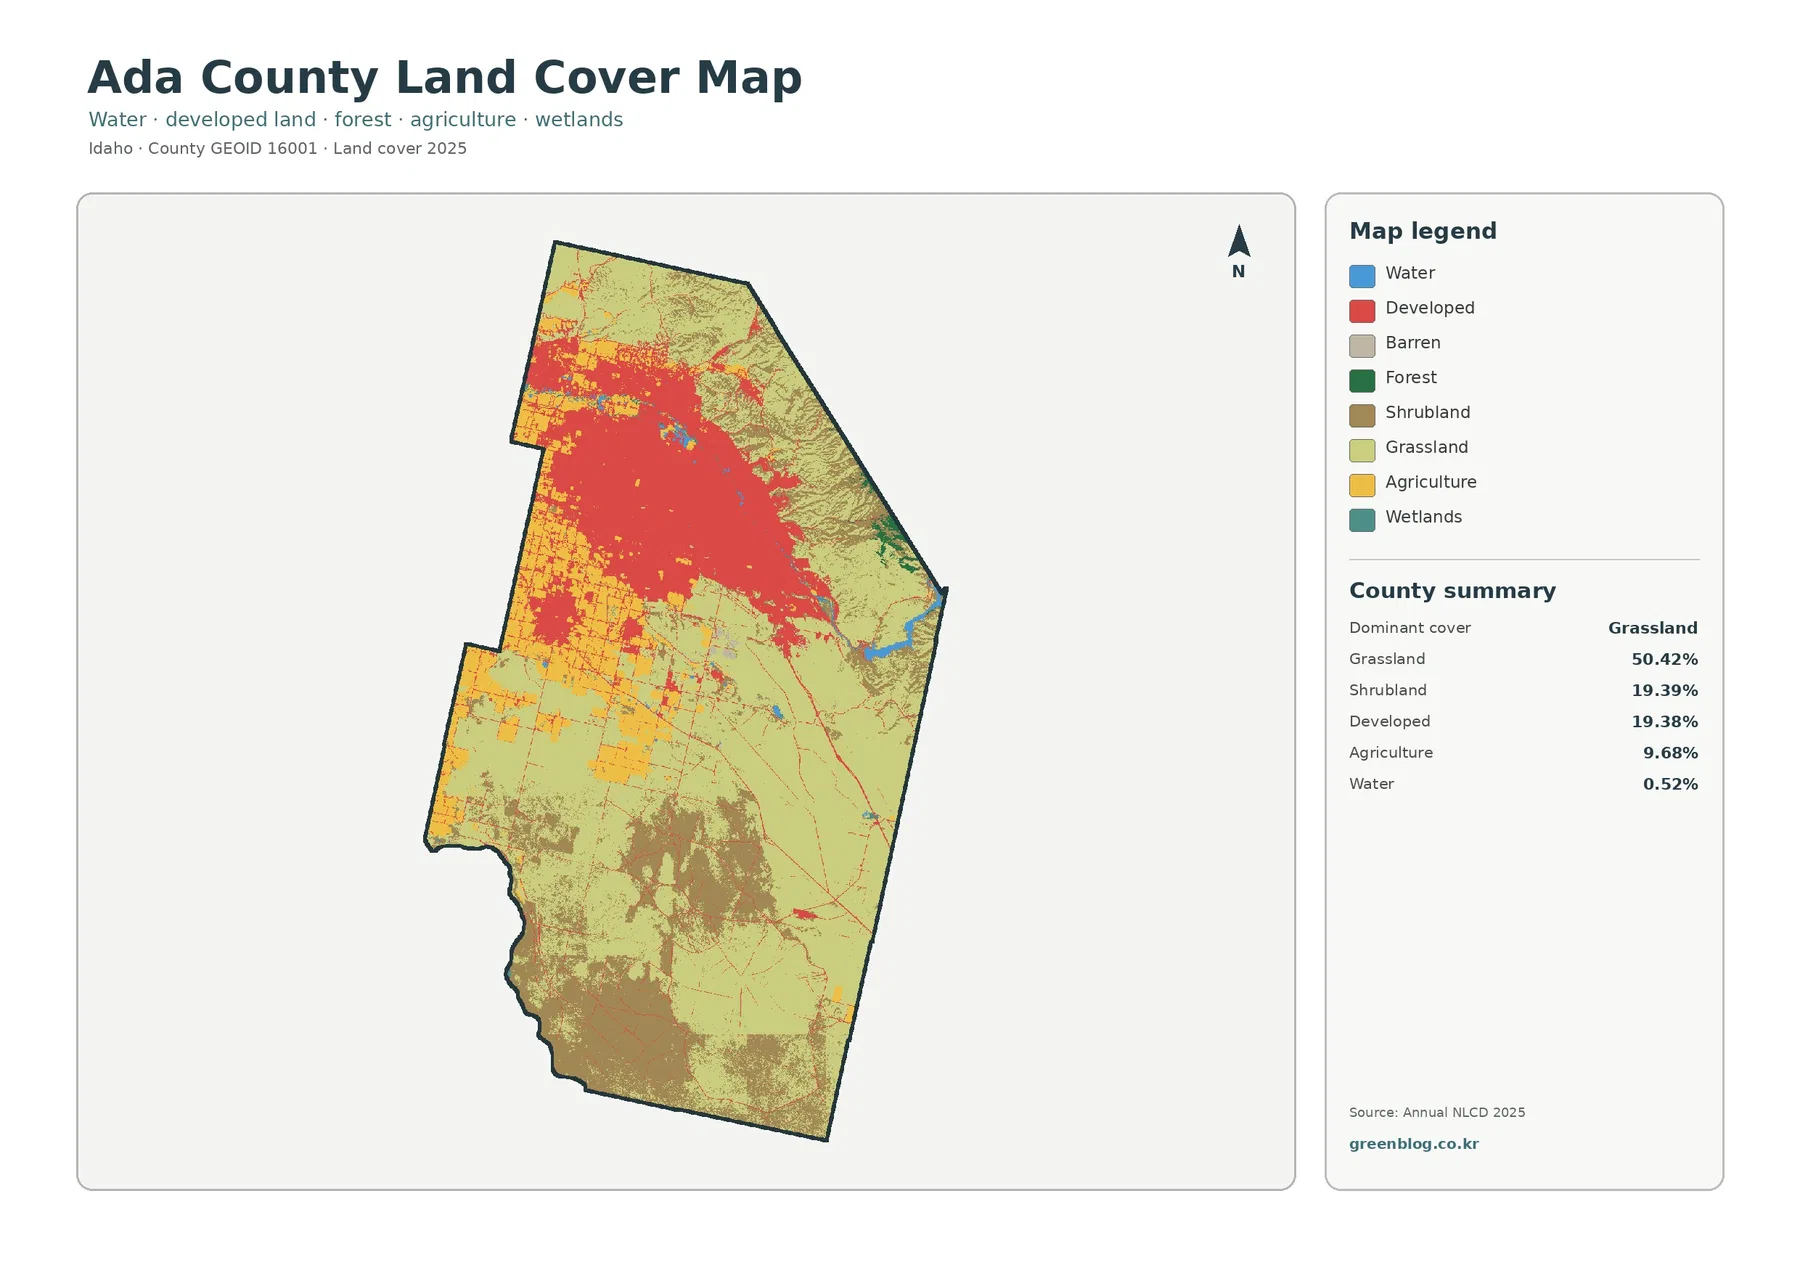
The strongest red developed area occupies the northern part of the county, broadly matching the Boise–Meridian urban side of Ada County. It spreads across a wide block rather than appearing as a single small town center, and thinner developed traces continue outward from that core. South of this concentration, the map changes rapidly. Red becomes sparse and large areas of grassland and shrubland take over, producing a clear urban-to-open-land transition within the same county boundary.
Grassland alone represents 50.42% of the supplied summary. Shrubland adds another 19.39%, so these two open-cover classes occupy far more of the county than agriculture. That distinction matters because pale or open-looking land should not automatically be called farmland. Agriculture is separately mapped at 9.68%, with larger yellow blocks in the west and northwest and additional pieces near the edge of the developed area. The southern half is mostly grass and shrub cover rather than one continuous agricultural plain.
Forest is only 0.34% and wetlands 0.15%, which is very different from heavily wooded or wet counties elsewhere in the country. Small forest patches occur mainly toward the eastern and northeastern side of the map. Water is 0.52%, but the blue features are visually important because a reservoir and narrow river traces create recognizable breaks through otherwise dry-looking cover. The remaining tiny share is made up of other mapped classes rather than a large hidden category.
The Boise River and Lucky Peak corridor adds a narrow blue thread to the built landscape
Ada County’s official comprehensive plan treats the Boise River as an important natural resource, and the county’s Parks & Waterways department manages Greenbelt segments running from the Lucky Peak area toward Garden City. That local context helps explain why a relatively small water percentage can still matter on the map. Blue water appears strongly at the eastern side and continues as a much narrower feature through the northern developed zone.
The land-cover image does not label the Boise River, Lucky Peak Reservoir, city limits, or individual channels, so it should not be used to assign every blue pixel to a named feature. At county scale, however, the eastern water body and narrow water corridor give a useful reference for comparing developed surfaces with adjacent natural cover. In a presentation about Ada County, this is more informative than simply stating that water occupies only 0.52% of the area.
Impervious cover shows how intensely the northern developed area is built
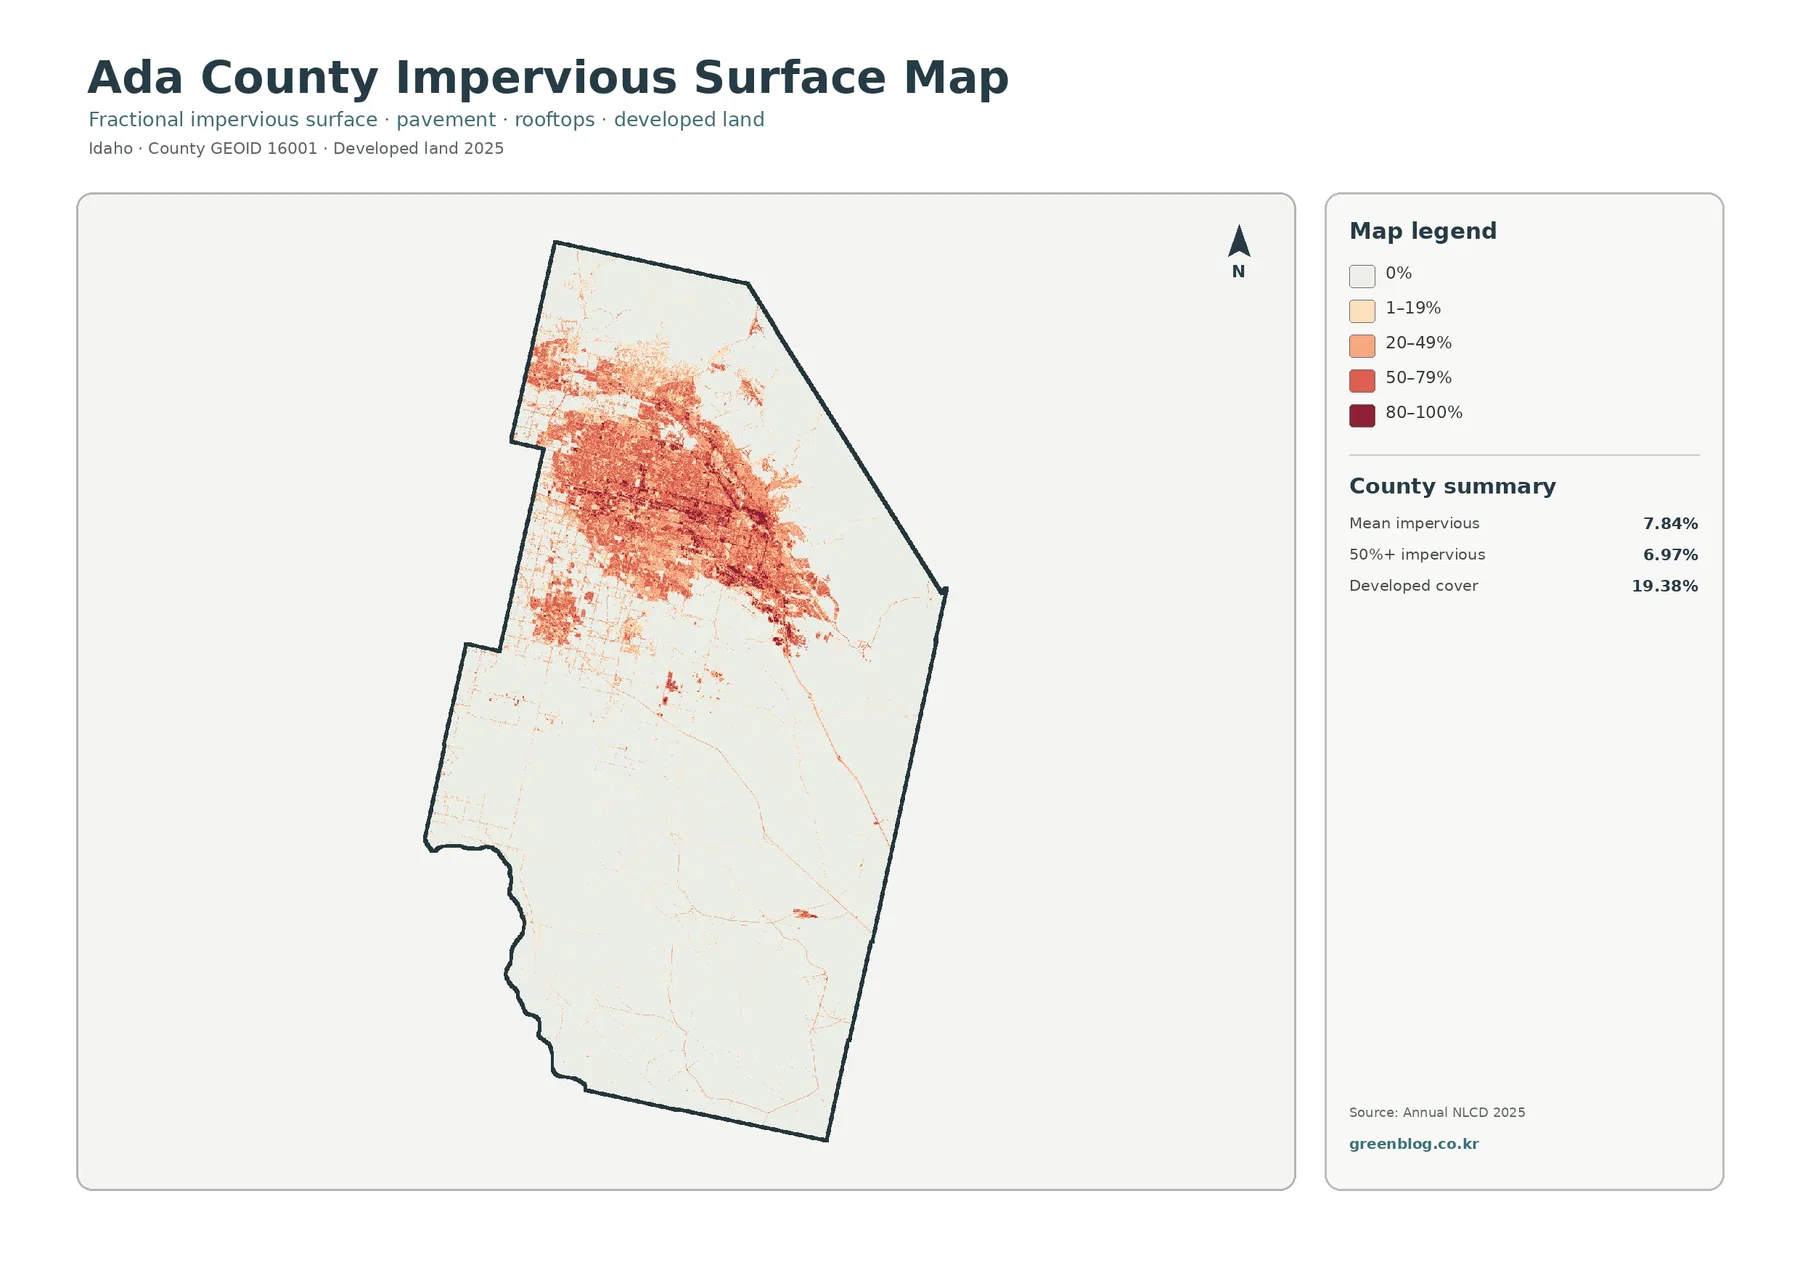
Impervious surface is the share of ground covered by hard materials such as roofs, paved streets, and parking areas where water does not readily soak into soil. Ada County has a mean impervious value of 7.84%, and 6.97% of the county is mapped at 50% or more impervious. The highest values form a broad, dense northern concentration. Orange and red areas are tightly packed there, while thin linear traces extend away from the main built zone.
The southern half is almost the opposite. Most cells are at or near the lowest impervious category, with only a few faint linear or isolated marks. That makes this map useful for showing not just where developed land exists, but where hard surfaces are actually concentrated. The 19.38% developed-cover share is much larger than the 7.84% mean impervious value because a developed land-cover class can contain lawns, trees, bare soil, and other permeable surfaces around buildings and roads.
Ada County Development Services lists Boise, Eagle, Meridian, Kuna, Star, and Garden City among the jurisdictions it coordinates with for permitting-related matters. The map does not draw those municipal boundaries, but that official context explains why the northern half contains a large multi-center urban footprint rather than one isolated red spot. The safest interpretation is regional: hard surfaces are highly concentrated in the northern urban area and decline sharply toward the open south.
The vegetation map keeps farmland separate from the much larger grass and shrub cover
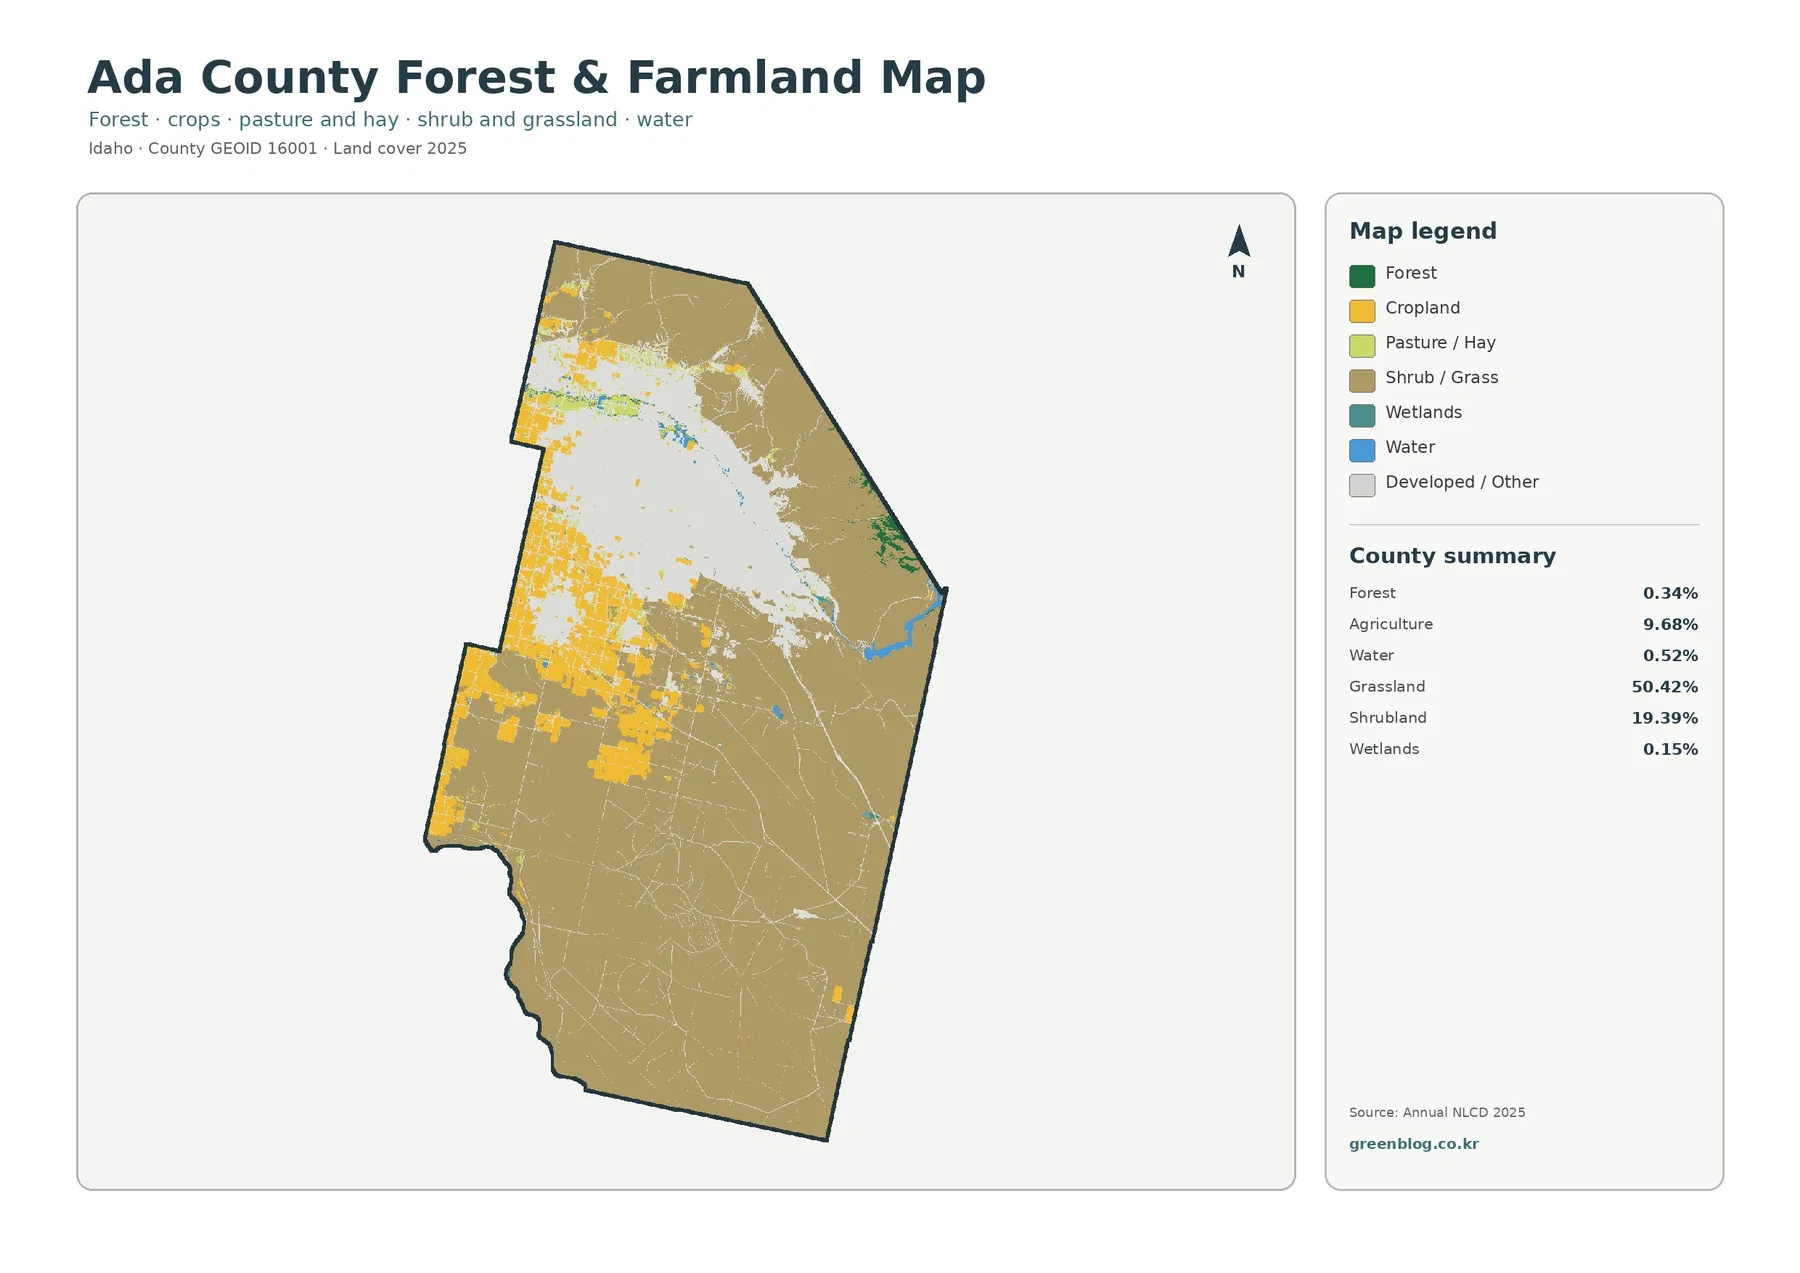
The forest-and-farmland view is useful precisely because Ada County is not dominated by either forest or cropland. Agriculture covers 9.68%, and the clearest agricultural blocks appear west and northwest of the main developed zone, with smaller areas elsewhere. Grassland at 50.42% and shrubland at 19.39% cover most of the south. A viewer who looked only at the amount of open ground could easily overestimate farmland, so the simplified legend helps keep working land distinct from naturally open vegetation.
The same map makes the very small forest share easier to notice. Dark forest color is limited to small patches toward the east and northeast instead of forming a continuous belt. Wetlands at 0.15% and water at 0.52% appear as narrow or localized features. In other words, Ada County’s natural-cover story is primarily about grassland and shrubland, not broad forest or wetland cover. That county-specific balance is important when comparing it with wetter or more heavily forested counties.
It is also important not to translate this map into legal land use. A cell classified as agriculture does not by itself identify a farm boundary, crop type, ownership, or agricultural zoning. Grassland and shrubland do not mean that development is prohibited. The image summarizes surface cover from a raster dataset; planning, property, and regulatory questions require separate local records.
The 1985–2025 map separates urban-class expansion from other kinds of difference
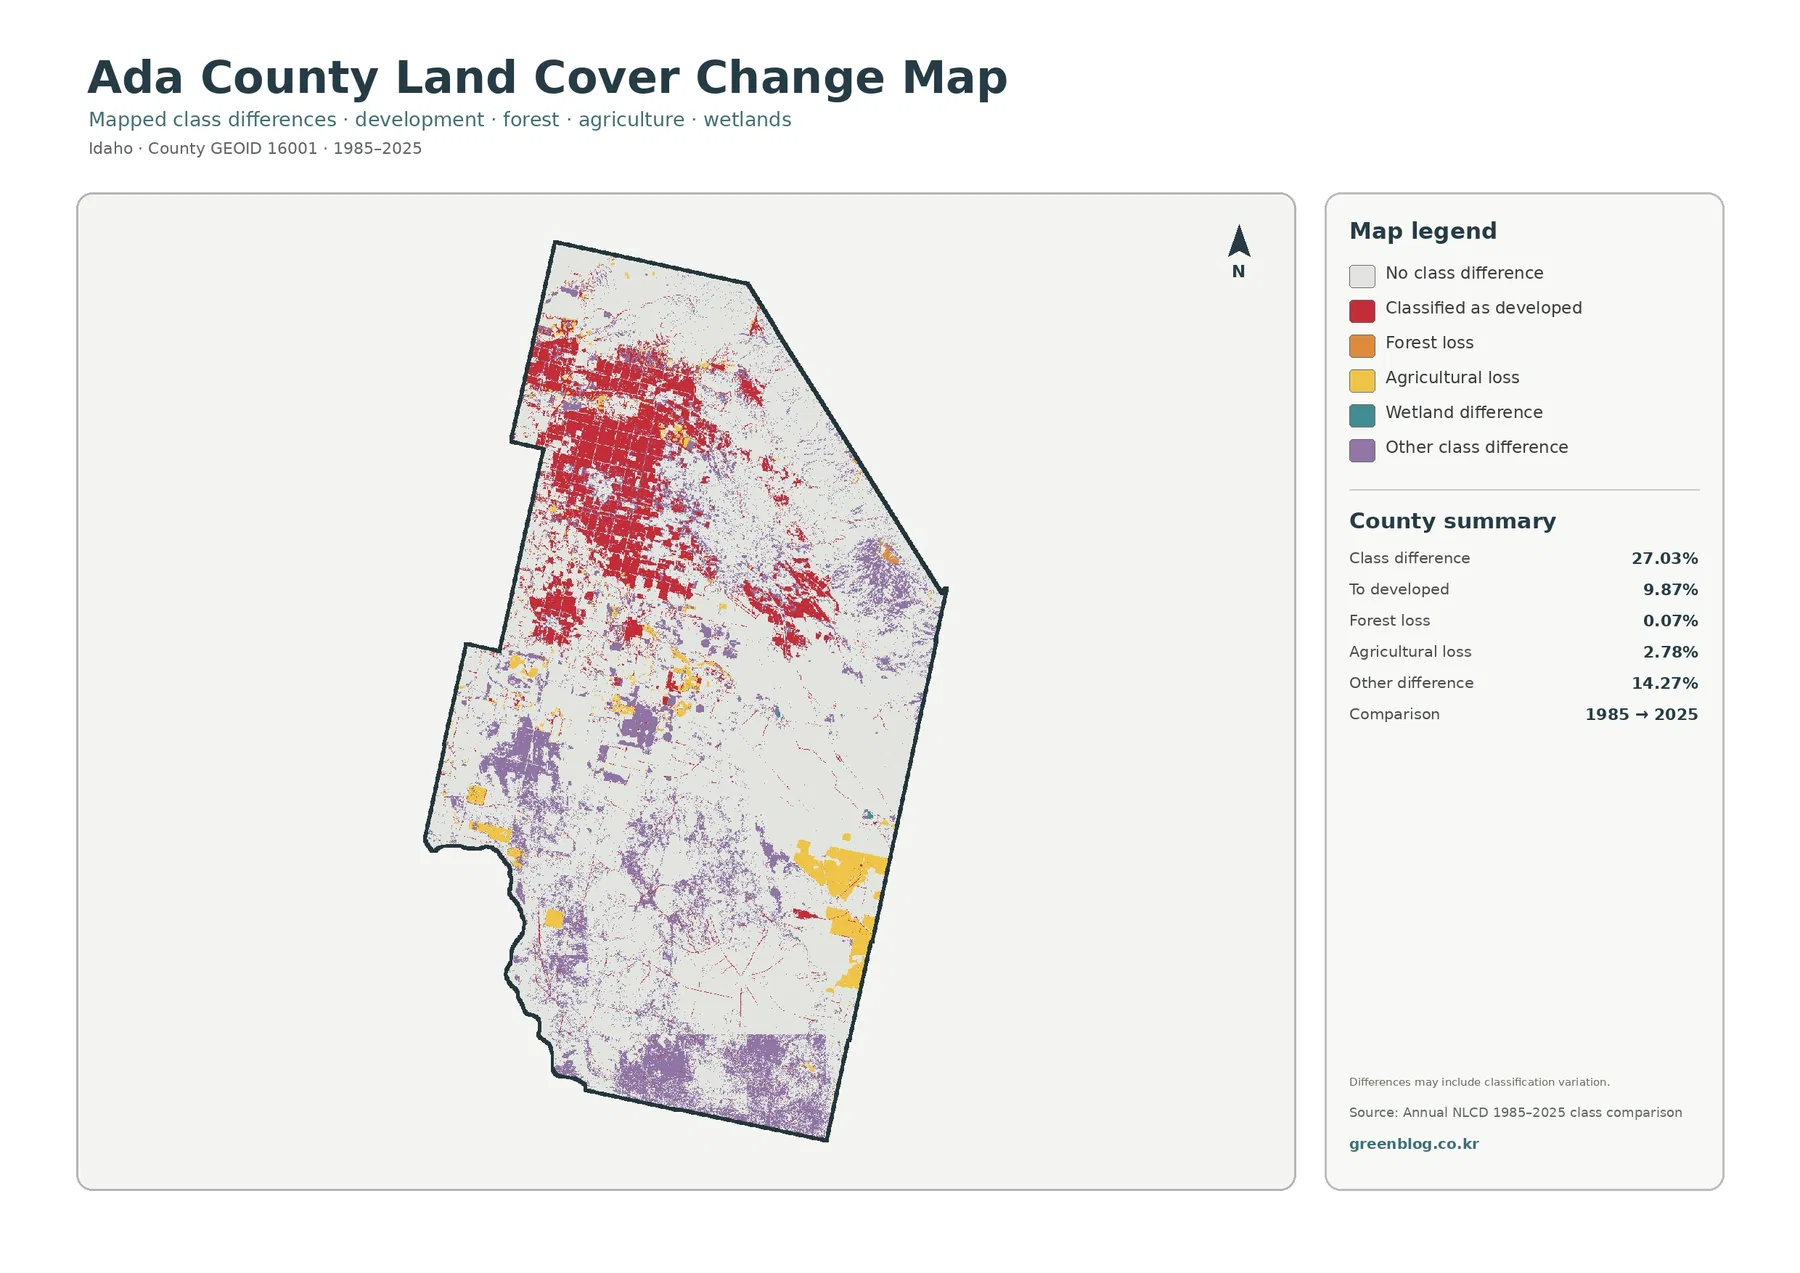
The two-date comparison reports a total class difference of 27.03%. Of that area, 9.87% is mapped as classified to developed, 2.78% as agricultural loss, 0.07% as forest loss, and 14.27% as other class difference. Red developed-change cells form the strongest coherent pattern in the north and north-central part of the county. Purple other-difference cells are much more scattered, especially across the south and along parts of the east.
The 27.03% total is not the percentage of Ada County that became urban. The specific developed-change category is 9.87%; the rest includes agriculture, forest, wetland-related or other class differences and possible classification variation. The map compares 1985 with 2025 endpoints, so it cannot show the exact year a location changed, whether it changed more than once in between, or the direct reason for that difference.
Southern change colors should not be mistaken for the northern urban-growth pattern
A large amount of purple appears across the southern half of the change map, but the current land-cover image shows that this same area remains primarily grassland and shrubland. That means the southern differences should not be described automatically as development. They may reflect shifts among open vegetation classes, other cover changes, or classification variation. The supplied map does not provide enough evidence to identify a cause, so the most accurate wording is that these cells were classified differently at the two endpoints.
The northern red pattern can be described more directly because the legend specifically identifies it as classified to developed. When the current map and change map are viewed together, the strongest developed-change area overlaps the same general part of Ada County that now has the highest developed and impervious concentration. That makes the pair useful for a long-term visual comparison, but it still should not be treated as a zoning-history map, a permit record, or a precise municipal growth boundary.
County planning context is useful, but land cover is not zoning
The Ada County Comprehensive Plan discusses growth, natural resources, the Boise River, foothills, open space, and development policy in unincorporated areas and municipal growth areas. Those topics provide valuable context for why readers may care about the patterns shown here. They do not change what the map measures. Land cover describes the physical surface seen by the classification system, while zoning and planning documents describe legal policy, permitted uses, and development rules.
A developed pixel can include residential landscaping, commercial land, public facilities, or other built settings, and the map does not say which one applies. Likewise, grassland or shrubland color says nothing by itself about ownership or whether a parcel could be developed. Water and wetland classes do not establish jurisdictional wetland boundaries. Property, permit, conservation, and legal decisions need current county, city, state, or federal records in addition to this county-scale reference.
Use the four files in a sequence that matches the question
For a general Ada County profile, begin with the 2025 land-cover overview. It immediately establishes the most important contrast: a large northern developed area beside broad southern grassland and shrubland. If the topic shifts to farming or natural vegetation, add the forest-and-farmland map. It makes the 9.68% agricultural share easier to separate from the much larger open vegetation classes.
When development intensity is the main question, the impervious map is more informative than the general red developed class because it shows where hard surfaces are actually dense. Use the change map last when the discussion needs a 1985–2025 endpoint comparison. Its colors represent differences between dates, not current land-cover categories. Presenting the current map first reduces the chance that viewers will mistake red or purple change colors for present-day surface classes.
For classroom work, the overview and impervious map make a strong pair for explaining why “developed land” and “pavement or rooftops” are not identical measures. For environmental context, the overview and vegetation map can highlight the small water share, the Boise River/Lucky Peak setting, agricultural blocks, and the large grass-shrub landscape. A planning-oriented presentation can use the current map and change map as regional context while clearly stating that neither replaces an adopted land-use or zoning map.
Thirty-meter raster cells set a clear limit on parcel-level interpretation
Annual NLCD is a raster product: the landscape is divided into small grid cells and each cell is assigned one predominant cover class. Real ground is often mixed. A single cell may contain a roof, lawn, trees, pavement, soil, or a field edge at the same time. Thin roads, narrow waterways, small wet areas, and the edges of development can therefore look wider, narrower, or less continuous than they are on the ground.
The current maps represent the supplied 2025 observation year. Construction, vegetation change, crop conditions, fire effects, restoration, or water-level changes after that date may not appear. Enlarging the JPG makes labels and colors easier to inspect, but it cannot create parcel detail that is absent from the source grid. Current site questions should be checked against recent aerial imagery, parcel data, and the relevant official agency records.
The original JPG package is best used as four separate reference views
The download contains one original JPG for each map discussed here: 2025 land cover, forest and farmland, impervious surface and developed land, and 1985–2025 land-cover change. Each image measures 2480 × 1754 pixels. The supplied package does not mark these files as meeting an A3 high-resolution reference, so a proof print is recommended before producing a large poster.
The files work well for screens, reports, ordinary print layouts, classroom materials, and presentations when the original proportions are kept. A single overview usually communicates more clearly than shrinking all four maps into one small panel. Add the vegetation, impervious, or change file only when it directly supports the point being made, and keep the legend visible so viewers can distinguish current cover from endpoint differences.
Frequently Asked Questions
What is the largest land-cover class in Ada County?
Grassland is the largest class in the supplied 2025 summary at 50.42%. Shrubland is 19.39%, developed land 19.38%, and agriculture 9.68%. The map shows the strongest grass and shrub cover across the south, while developed land is concentrated in the northern urban area.
Why is developed cover 19.38% when mean impervious cover is 7.84%?
Developed land-cover classes can include lawns, trees, bare soil, and other permeable surfaces around buildings and streets. Impervious percentage focuses on hard surfaces such as rooftops and pavement. Ada County also has 6.97% of its area mapped at 50% or more impervious, strongly concentrated in the northern urban footprint.
Does the 27.03% class difference mean that 27.03% of Ada County became developed?
No. The 27.03% figure includes all endpoint class differences. The map lists 9.87% as classified to developed, 2.78% as agricultural loss, 0.07% as forest loss, and 14.27% as other difference. Exact timing and causes require intermediate imagery and local records.
Sources and Reference Data
- MRLC Annual NLCD Data – official access point for the current land-cover and comparison products
- USGS Annual NLCD Land Cover Classification – definitions for developed land, grassland, shrubland, agriculture, water, forest, and related classes
- Ada County Comprehensive Plan – official county context for growth, the Boise River, foothills, natural resources, and development policy
- Ada County Boise River Greenbelt – county information on the Boise River corridor from the Lucky Peak area toward Garden City
Map File Information
The ZIP contains the four original Ada County JPG maps used to compare 2025 land cover, vegetation, impervious surfaces, and 1985–2025 class differences.
- Included Files: Four original JPG maps described on this page
- File Type: JPG images packaged in a ZIP archive
- Intended Use: Printing, education, presentations, and map-based projects
Related Maps
- Why the Idaho County Map
- A Craighead County Arkansas Land Cover Map
- Adams County Colorado Land Cover Map
Green Map creates custom-edited map images using open geographic data sources such as geoBoundaries, Natural Earth, OpenStreetMap, and government open data. These maps are edited visual materials, not raw data files, and are provided for education, documents, presentations, and graphic reference.