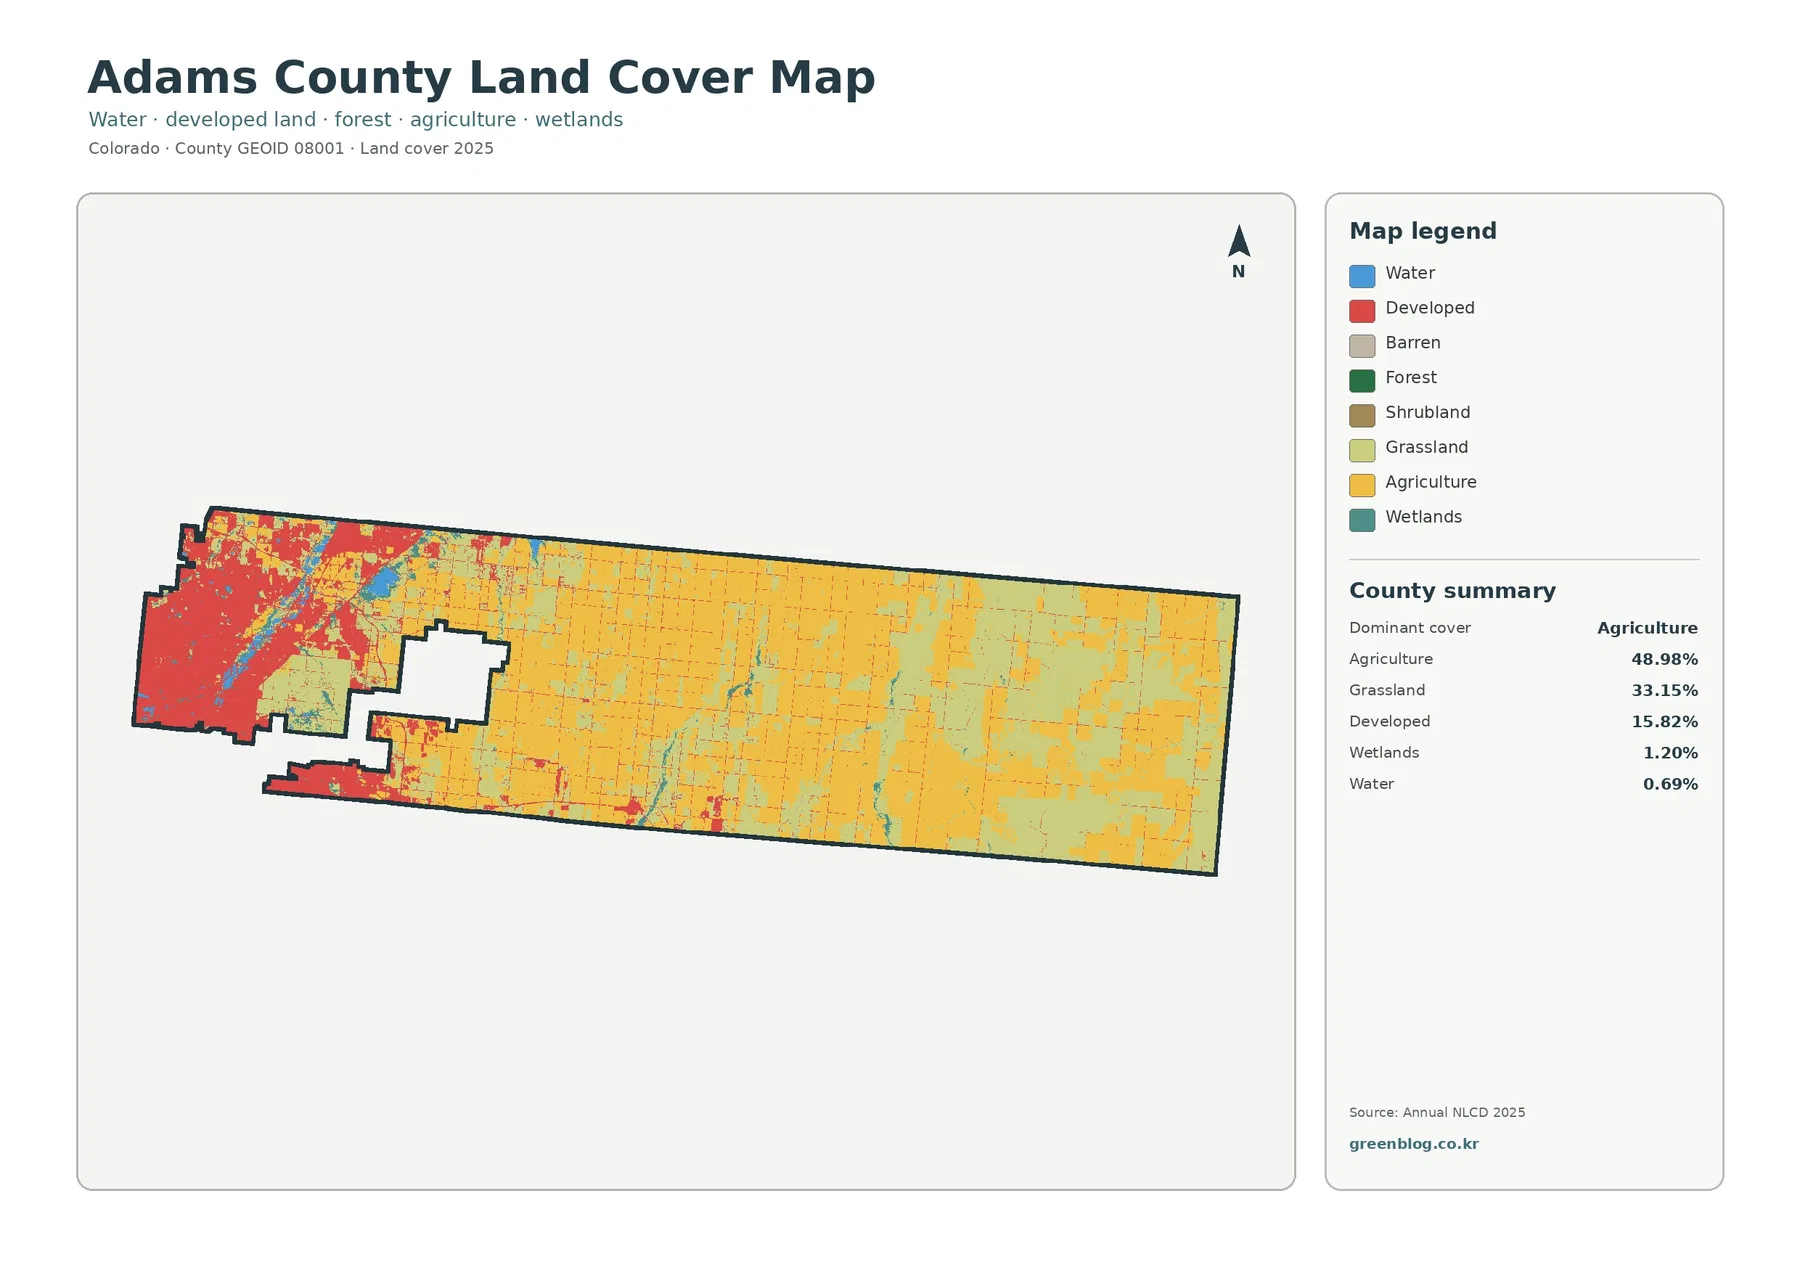
Adams County has one of the clearest west-to-east land-cover contrasts in the Denver-area plains. The 2025 map shows a dense block of developed land at the western end, then a rapid transition into broad agricultural and grassland areas across the central and eastern county. Agriculture accounts for 48.98% of the mapped area, grassland for 33.15%, and developed cover for 15.82%, so the countywide totals only make sense when they are read together with location.
This page compares four supplied views: current land cover, forest and farmland, impervious/developed surfaces, and mapped class differences from 1985 to 2025. The four original JPG maps are available together in one download below. Land cover is not the same as zoning, ownership, parcel boundaries, or development permission; it is a satellite-based classification of what is physically covering the ground at the mapped date.
Table of Contents
A compact urban west beside a much larger agricultural and grassland east
The county summary lists agriculture at 48.98%, grassland at 33.15%, developed land at 15.82%, wetlands at 1.20%, and water at 0.69%. The forest-and-farmland map also reports shrubland at 0.12% and forest at 0.00%. Those numbers immediately show that Adams County is dominated by open, nonforested cover, but the map adds the critical geographic detail: the developed share is packed into the western end instead of being evenly distributed across the long county.
On the western side, red developed classes form a broad, nearly continuous area with only narrow breaks for water, open space, and other cover. Moving east, that red pattern thins quickly. Agricultural yellow and grassland tones take over the middle of the county and remain dominant toward the eastern boundary. The result is not a gradual urban blanket but a strong spatial split between a metropolitan edge and a much larger rural landscape.
Adams County’s comprehensive planning documents describe a similar regional contrast from a different perspective. The county’s land-use framework places large-scale agriculture primarily in the eastern portion while western areas contain a more complicated mix of suburban, urban-edge, industrial, commercial, and residential uses. A planning map and an NLCD land-cover map do not classify land in the same way, so they should not be treated as interchangeable. They do, however, help explain why the current surface-cover map changes so sharply from west to east.
| 2025 mapped class | County share |
|---|---|
| Agriculture | 48.98% |
| Grassland | 33.15% |
| Developed | 15.82% |
| Wetlands | 1.20% |
| Water | 0.69% |
| Shrubland | 0.12% |
| Forest | 0.00% |
The table is best used as a summary of the classes explicitly reported on the supplied maps, not as a reason to invent values for every possible legend category. Barren land and other small classes may appear in the legend or image without a separate county percentage. Where the package does not provide a number, this article does not estimate one.
Why agriculture and grassland cover more than four-fifths of the county
The forest-and-farmland view makes the eastern part of Adams County easier to read because it reduces visual competition from the detailed developed classes. Large blocks of cropland spread across the central and eastern county, broken by extensive grassland and smaller areas of water, wetlands, and other cover. Development becomes increasingly sparse away from the western metro edge, and the far east is overwhelmingly open.
The 48.98% agricultural share should be understood as a mapped surface class, not as a cadastral inventory of farms. A yellow cell does not identify a property owner, crop type, conservation status, or zoning district. It means that the 2025 satellite-based land-cover product classified that ground as agricultural cover. Crop rotation, fallow conditions, irrigation changes, and mixed pixels can all affect how individual locations look from year to year.
Grassland is also a major part of the county at 33.15%. That high value reinforces how much of Adams County remains open even outside the mapped agricultural class. It does not mean that one-third of the county is public parkland. Grassland can occur on private ranches, undeveloped parcels, field margins, conservation land, and other settings. Legal status and land management must be checked in separate records.
The almost complete absence of mapped forest is another distinctive feature. Forest is reported at 0.00%, while shrubland is only 0.12%. This does not mean there are literally no trees in Adams County. Riparian trees, street trees, shelterbelts, farmstead vegetation, and small wooded patches can exist without being large enough to produce a measurable countywide forest percentage in this summary. At county scale, the dominant picture is still plains agriculture, grassland, and developed land rather than continuous woodland.
Adams County’s Parks, Open Space and Trails Master Plan gives useful local context for this open landscape. The plan treats working farms, ranches, rural character, and agricultural conservation as important community priorities and identifies central parts of the county, including Historic Splendid Valley, as places with strong farmland-preservation potential. Those planning goals are not part of the NLCD classification, but they explain why agricultural land is an important county issue beyond the percentage shown on the map.
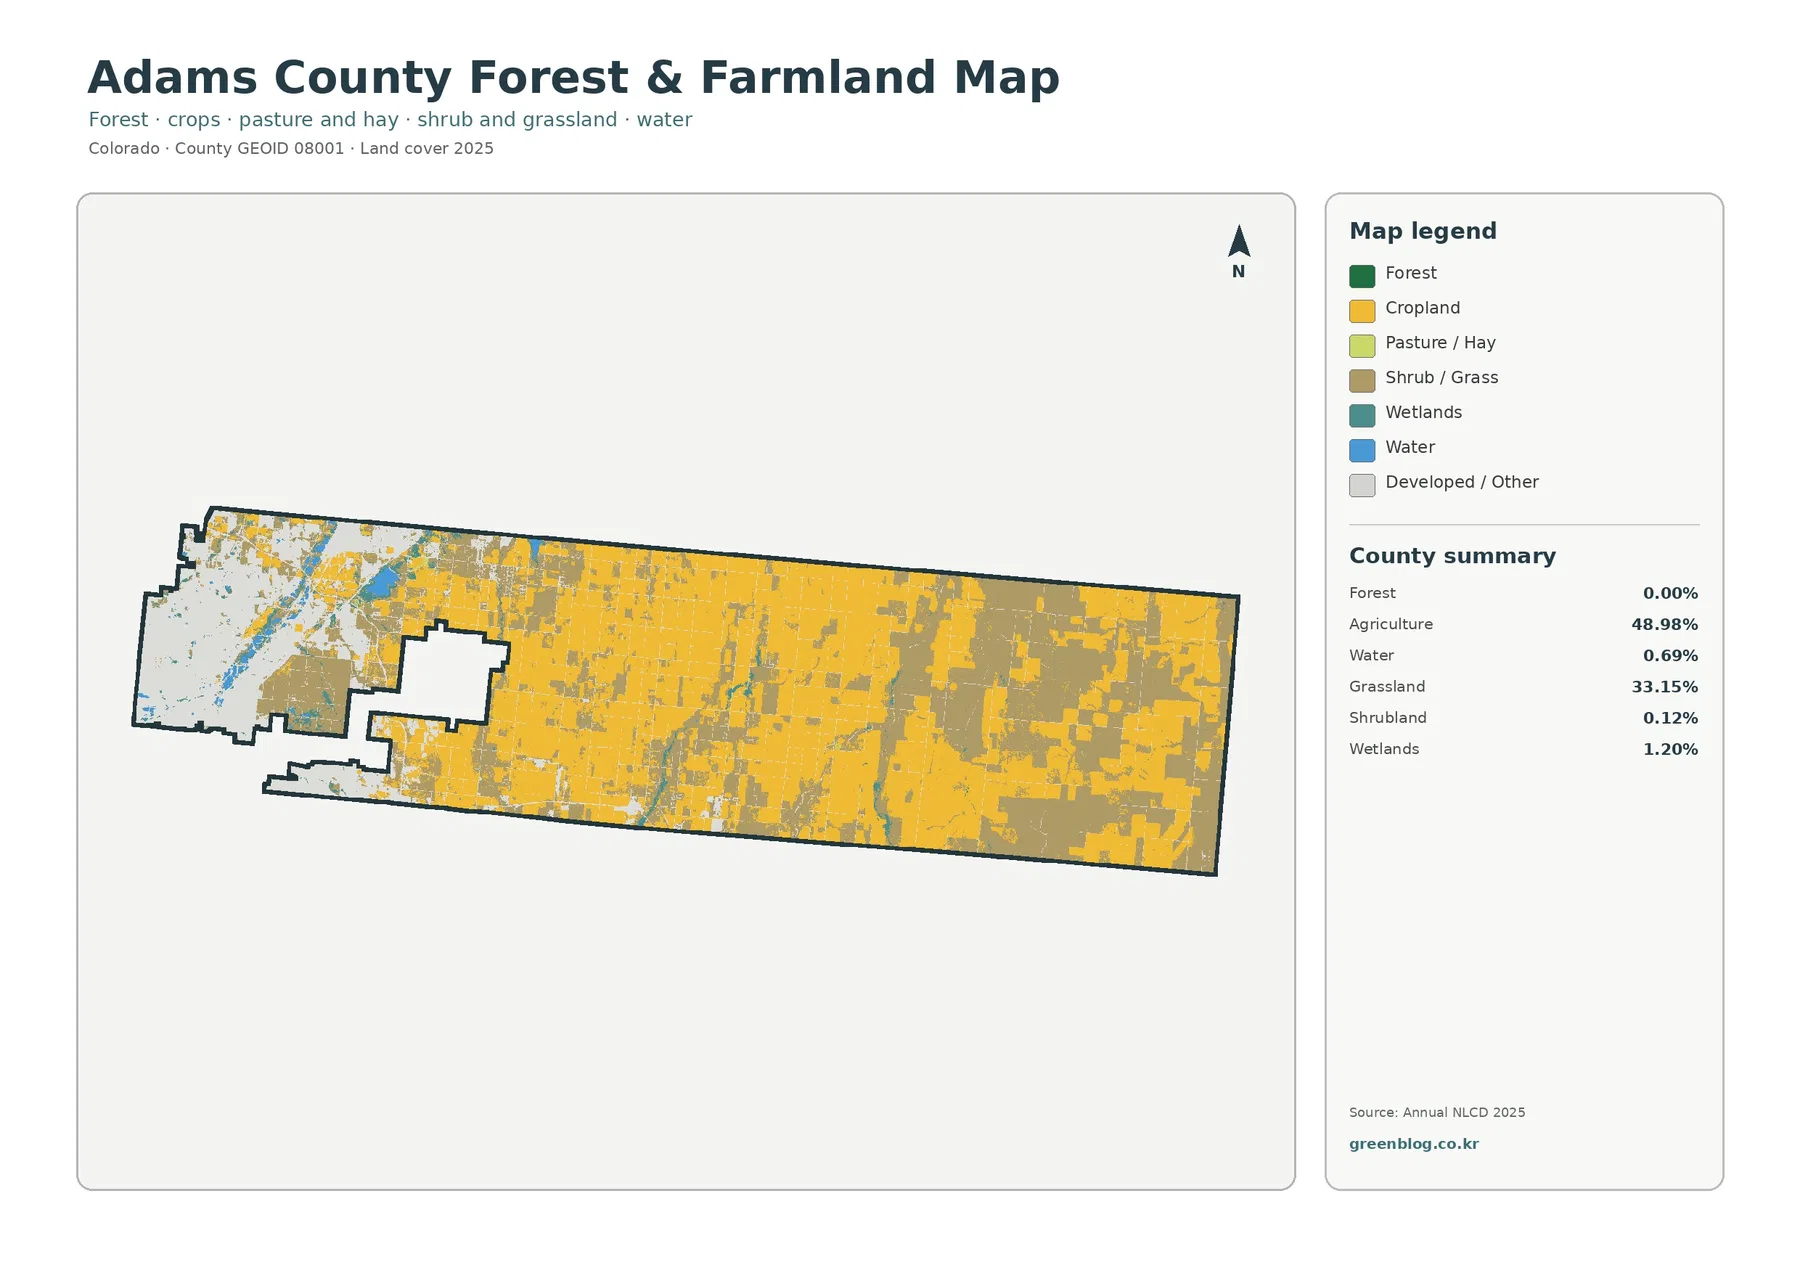
For a presentation about the rural side of Adams County, this map is often clearer than the full land-cover view. It immediately shows that the eastern landscape is not a suburban continuation of the west. The strong agricultural pattern, broad grassland areas, and sparse hard surfaces create a county-scale contrast that can be difficult to appreciate from a road map alone.
A 6.48% mean impervious value that is heavily concentrated in the west
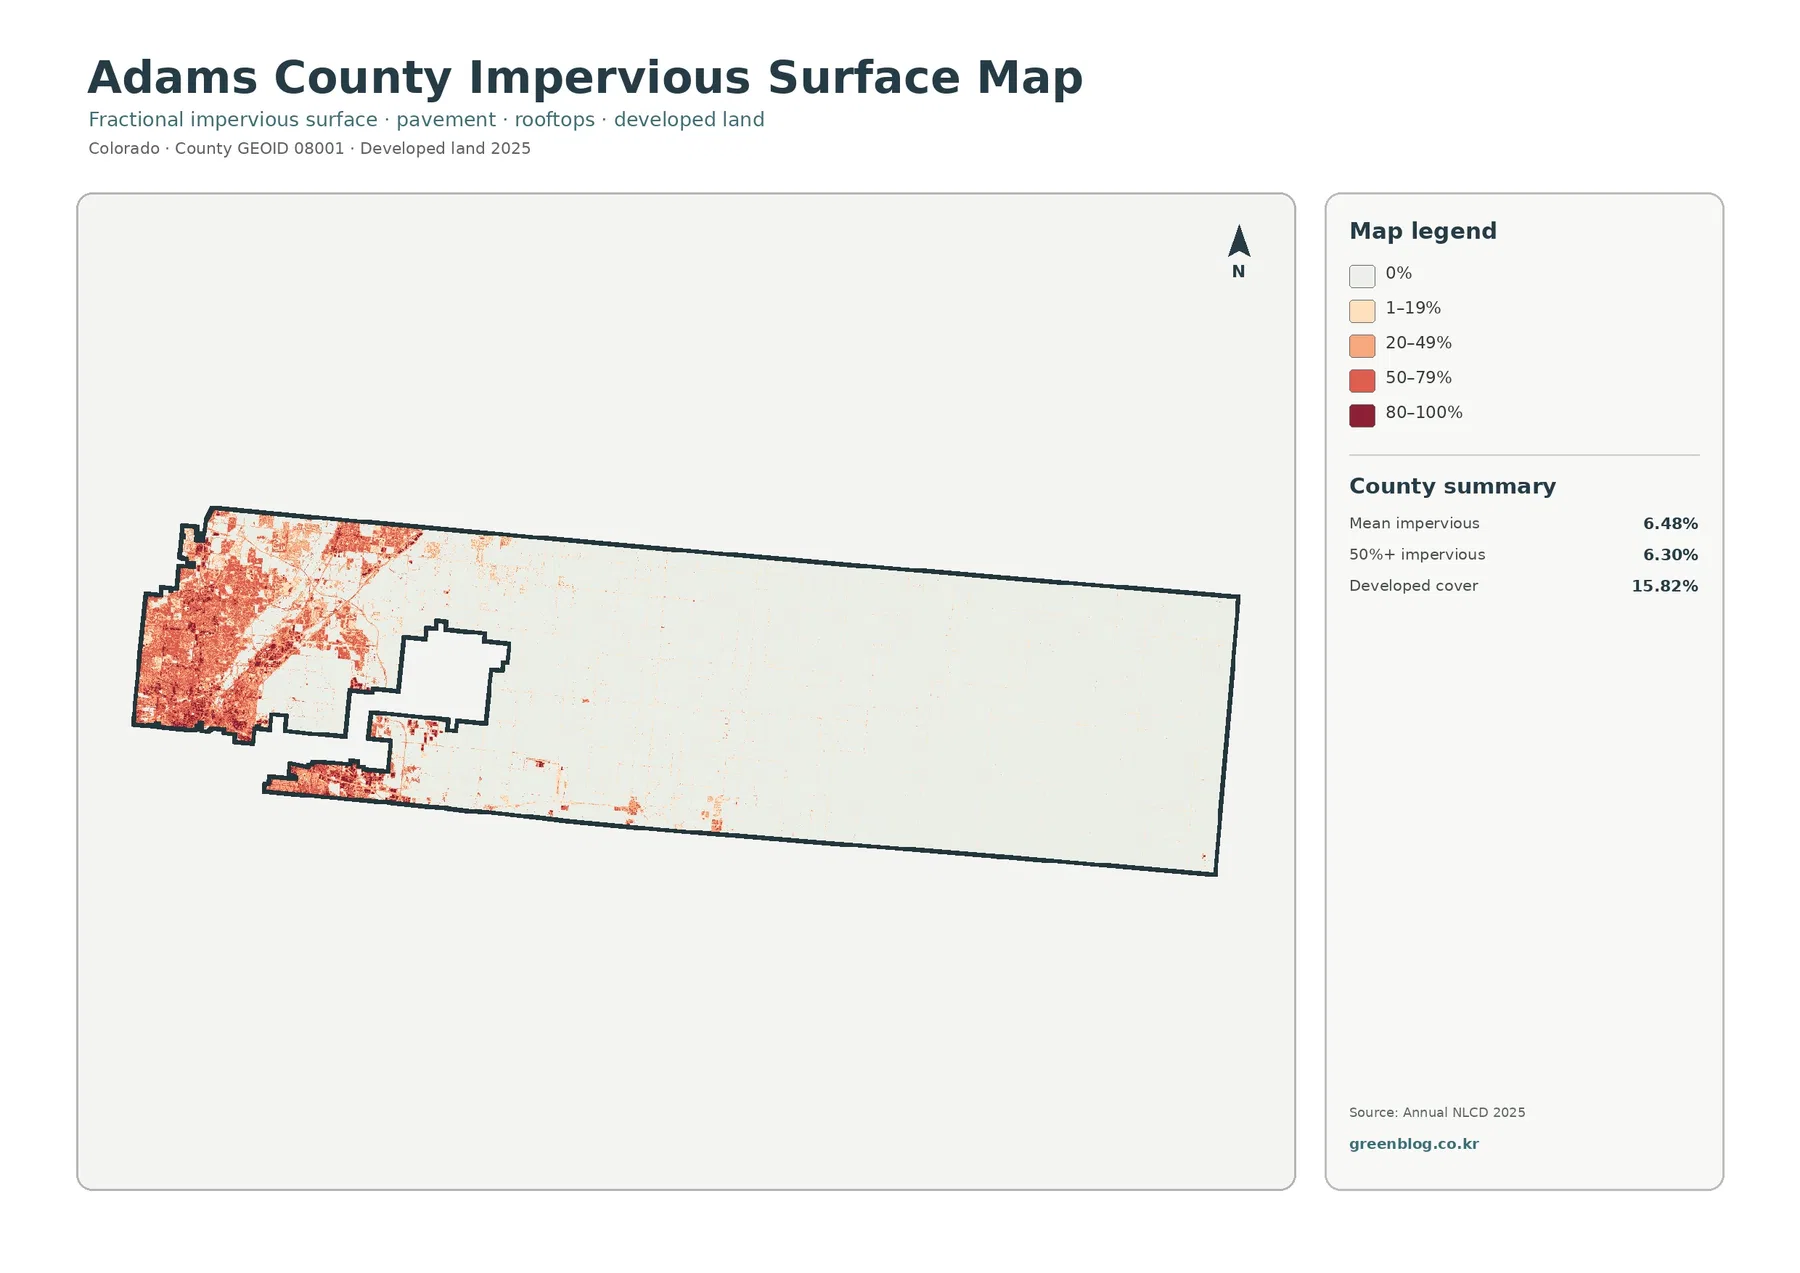
The impervious-surface map reports a countywide mean of 6.48%. It also shows 6.30% of the county in cells with at least 50% impervious cover, while developed land accounts for 15.82% on the general land-cover map. These values are different because developed land and impervious surface are not the same measurement. A developed class can include lawns, trees, bare soil, drainage areas, and other surfaces that still allow some water infiltration.
High impervious values are concentrated almost entirely in the western end of the county. Darker reds and oranges form a dense network there, reflecting rooftops, pavement, streets, parking areas, and other hard surfaces. The pattern becomes much lighter across the central transition and is nearly absent through large parts of the agricultural east, apart from thin road corridors and small developed sites.
This makes Adams County a good example of why a county average can hide local extremes. A mean impervious value of 6.48% might sound modest until the map shows that many western neighborhoods and employment areas have much higher local values while huge eastern areas remain close to zero. For runoff, heat, habitat fragmentation, or urban-growth discussions, location matters more than the single countywide mean.
The county’s comprehensive plan supports this general interpretation with land-use context. Western Adams County contains more suburban, urban-edge, industrial, and activity-center uses, whereas large-scale agriculture is emphasized farther east. The map does not identify zoning or permitted use, but the physical surface pattern is consistent with that broader urban-rural arrangement.
An impervious map can help introduce stormwater or urbanization questions, but it is not a flood-risk map. Flooding depends on terrain, soil, drainage infrastructure, river levels, levees, rainfall intensity, and other factors. A high hard-surface value may be relevant to runoff, yet a site-specific risk assessment needs hydrologic and engineering information that this layer does not provide.
Water and wetlands are small in area but locally important along river and drainage corridors
Water accounts for 0.69% of the county and wetlands for 1.20%. Those percentages are small next to agriculture and grassland, but the map shows that water-related classes are not randomly scattered. They follow river, reservoir, pond, wetland, and drainage features, with one of the most visible corridors running through the more developed western portion of the county.
Adams County’s official parks page identifies the South Platte River as a major regional corridor and notes that the South Platte River Trail extends from the Denver boundary north to 136th Avenue. That local information helps explain why water and open-space features in western Adams County can have significance that is not captured by their small countywide percentage. A narrow river corridor may occupy little area but still connect habitat, recreation, drainage, and nearby developed neighborhoods.
The 1.20% wetland value should be treated in the same way. It is a land-cover classification, not a legal wetland delineation. A mapped wetland cell can be useful for county-scale context, but permitting or development decisions require field investigation and the appropriate regulatory datasets. The map is most helpful for seeing where wet conditions cluster in relation to farms, grassland, and the western developed area.
Reading the 28.57% mapped class difference from 1985 to 2025
The comparison map reports class differences across 28.57% of the county. Of the highlighted categories, 6.93% is mapped as “to developed,” 15.64% as agricultural loss, and 5.79% as other class difference. Forest loss is 0.00%. A wetland-difference class is shown in the legend, but the supplied summary does not provide a separate percentage for it, so no number is added here.
The spatial pattern is just as important as the totals. Areas classified as becoming developed cluster most strongly in the west, where the current land-cover and impervious maps already show the largest urban footprint. Agricultural-loss colors are more widely distributed through the central and eastern portions, often in rectangular or patchy patterns that reflect the geometry of the open landscape. Other differences appear in scattered blocks across the county rather than forming one continuous band.
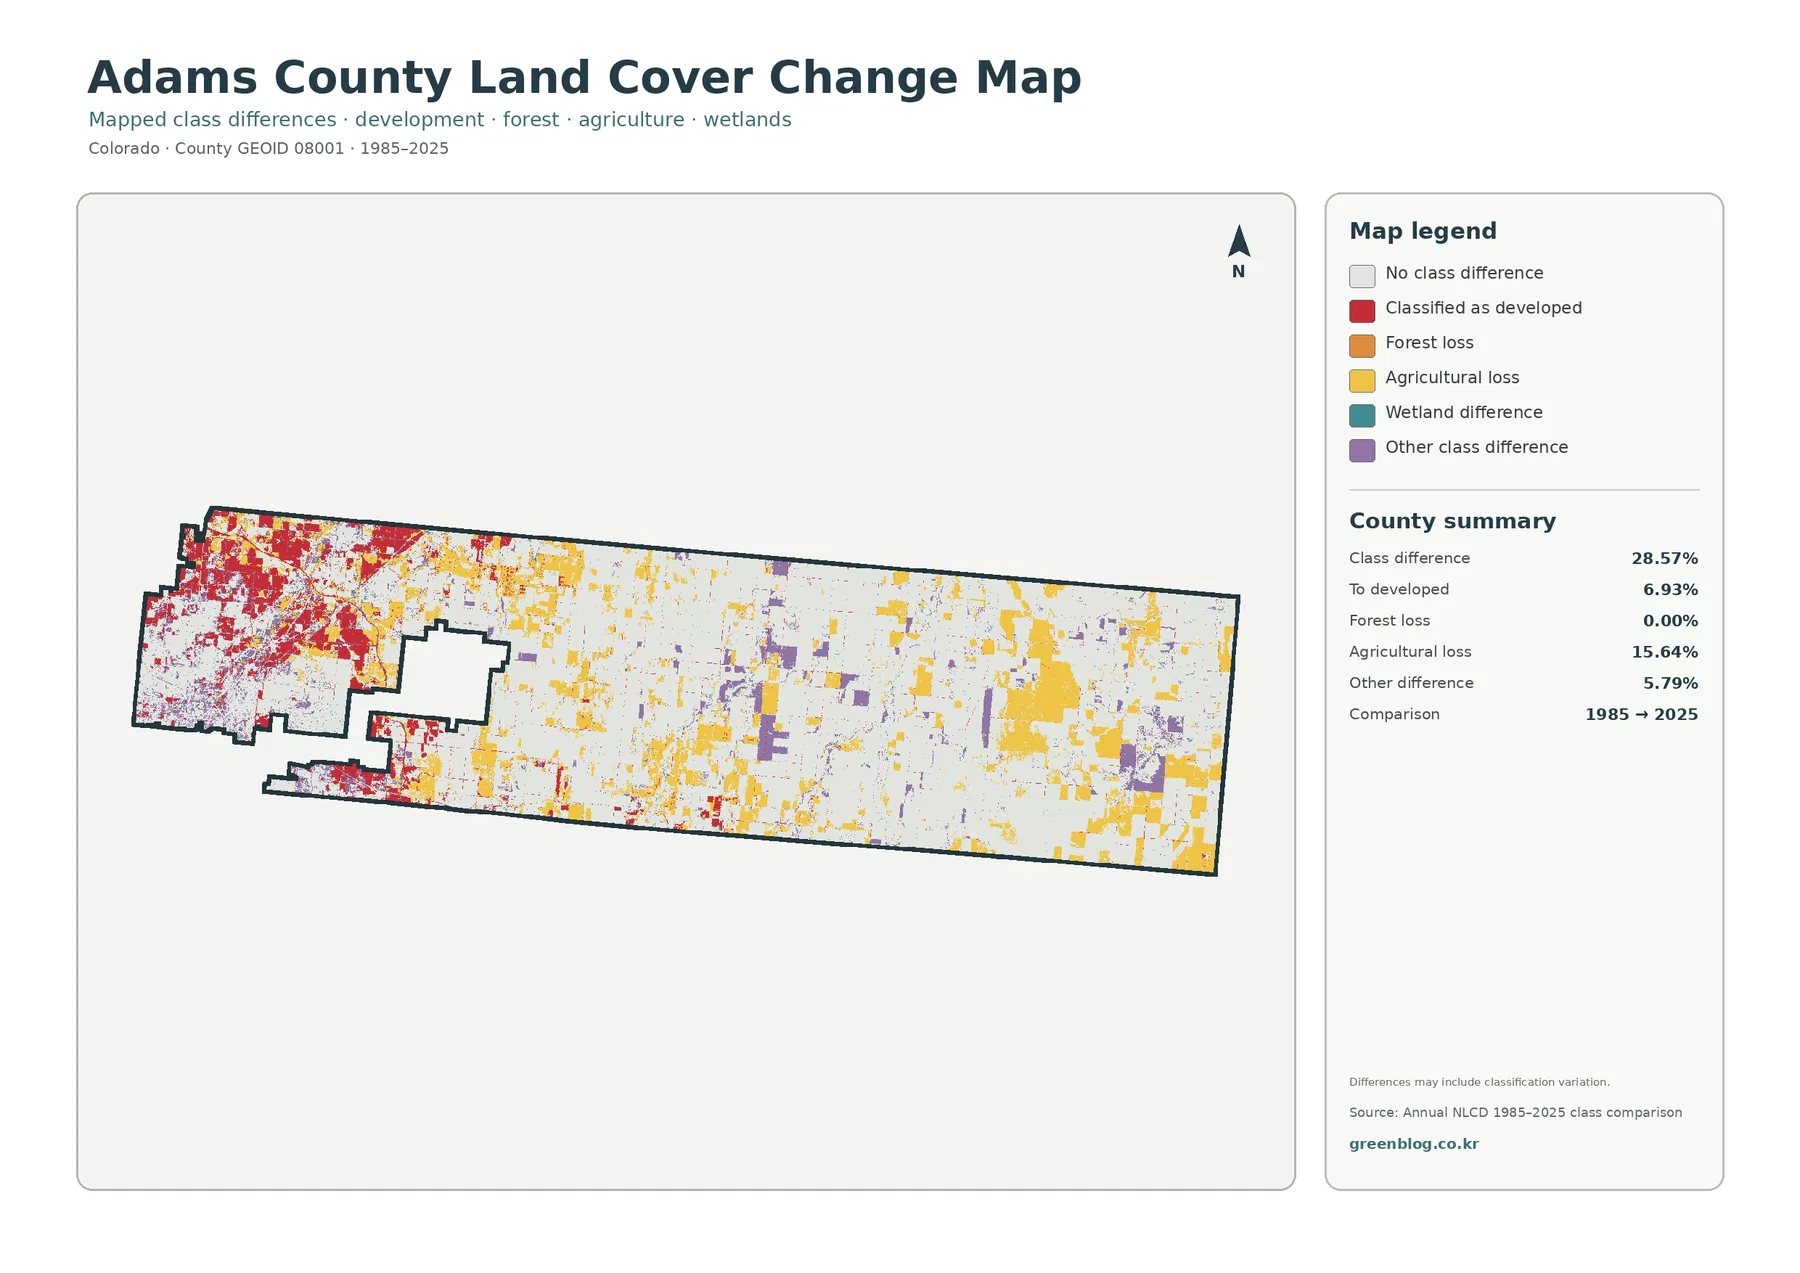
The word “difference” is essential. The map itself warns that classification variation may be included. Different imagery conditions, vegetation state, crop cycles, sensor history, processing methods, and model decisions can shift a cell from one class to another even when the ground did not undergo a permanent land-use conversion. The 28.57% value therefore should not be described as a measured physical conversion rate for Adams County.
The same caution applies to the 15.64% agricultural-loss category. Adams County planning documents do discuss development pressure on farmland, especially toward the more urbanized west, so long-term farmland change is a legitimate local issue. But the map’s 15.64% number is a class-comparison result, not a substitute for agricultural census acreage, parcel history, development approvals, or historical aerial photography. A claim about actual acres lost would require those additional sources.
Used properly, the change layer is still valuable. It can identify areas worth closer investigation, help students compare two dates, and provide a visual starting point for discussing growth and agricultural change. Pairing it with the 2025 map is especially important because one layer shows the current class while the other indicates whether the earlier classification matched it.
Match the map to the question instead of making one layer do everything
For a quick county overview, begin with the complete land-cover map. It gives the clearest picture of the western developed block, the agricultural middle and east, broad grassland, and smaller water and wetland features in one view. If the subject is farming, open land, or the unusual lack of forest cover, the forest-and-farmland map removes some detail and makes those dominant classes easier to compare.
The impervious layer is the better choice when the question concerns hard surfaces or urban concentration. It makes the western metro footprint stand out immediately and shows how quickly paved and roofed surfaces diminish toward the east. For a historical comparison, use the 1985–2025 class-difference map beside the current land-cover layer. That two-map approach reduces the risk of mistaking a historical difference category for a present-day surface class.
These maps are useful for county-scale education, environmental context, presentation graphics, broad planning background, and introductions to urban-rural land patterns. They are not parcel maps, zoning maps, property surveys, flood studies, wetland delineations, or engineering plans. Their strength is showing large patterns across a long county; their limitation is that local boundaries and mixed surfaces are generalized.
Download the four Adams County land-cover JPG maps
The ZIP contains four original JPG files: land cover, forest and farmland, impervious/developed land, and land-cover change. Each file is 2480×1754 pixels and is preserved at the supplied source size. The asset manifest does not mark these images as meeting the package’s A3 high-resolution reference, so print use should be judged from the actual pixel dimensions and the output size you need rather than from an assumed A3 specification.
The WebP images in the article are convenient for on-page viewing, while the JPG files are more practical when you want the supplied originals for a document or presentation. Before printing, check whether the legend and small linear features remain readable at the chosen size. Resolution is only one part of print quality; the final result also depends on scaling, printer settings, and viewing distance.
What a 30-meter raster can show—and what it can miss
Annual NLCD is designed for consistent land-cover mapping across large areas. Its raster structure divides the landscape into grid cells and assigns a class or value to each cell. That makes countywide comparison practical, but it also generalizes narrow and mixed features. A road, ditch, tree row, crop edge, yard, and small wet patch can occur close together while the map displays a much simpler pattern.
This limitation matters in western Adams County, where developed land, river corridors, open space, transportation infrastructure, and small pockets of vegetation are tightly interwoven. It also matters across the agricultural transition zone, where field edges, farm buildings, roads, canals, and grassland can occur within short distances. The map is reliable for broad pattern recognition, but its colored boundaries should not be treated as surveyed ground lines.
Date is another limitation. The current map represents the 2025 classification. Development, crop changes, restoration, flooding, vegetation shifts, or other surface changes that happened after the observation period are not reflected. When current site conditions matter, use the land-cover map as background and check newer imagery or county records.
Frequently Asked Questions
If agriculture covers 48.98%, why does western Adams County look mostly urban?
Agriculture occupies a very large share of the county, but most of it is concentrated across the central and eastern landscape. The western end covers less of the county’s total area yet contains a much denser concentration of developed and impervious surfaces. The countywide percentage and the location map describe two different parts of the same pattern.
Does 0.00% forest mean there are no trees in Adams County?
No. It means the supplied county summary rounds the mapped forest class to 0.00% at this scale. Trees can still occur along rivers, streets, parks, farmsteads, and small patches without forming enough continuous forest cover to register as a meaningful countywide forest percentage.
Can the 28.57% class difference be quoted as a 40-year land-conversion rate?
It should not be used that way. The value measures where the 1985 and 2025 mapped classes differ, and the map warns that classification variation may contribute. Real development and agricultural change can be part of the total, but a physical conversion rate requires additional dated evidence such as aerial imagery, parcel history, development records, or agricultural statistics.
Map File Information
Download the four original Adams County land-cover JPG maps together in one ZIP file.
- Printable Size: 2480×1754 pixels each
- File Type: ZIP containing 4 JPG files
Related Maps
Sources and official references
Percentages and spatial descriptions in this article follow the supplied Adams County 2025 land-cover maps and the 1985–2025 class-difference map. The official links below provide definitions, boundary data, and local planning or open-space context.
- MRLC Annual NLCD Data – Annual NLCD products and access information
- USGS Annual NLCD Land Cover Classification – class definitions and product interpretation
- U.S. Census Bureau TIGER/Line Shapefiles – county boundary and geographic data
- Adams County Parks, Open Space, and Trails – South Platte River Trail and county open-space context
- Advancing Adams Comprehensive Plan – local context for large-scale agriculture and western urban or industrial land-use patterns
- Adams County Parks, Open Space & Trails Master Plan – farmland, rural character, and conservation priorities
Green Map creates custom-edited map images using open geographic data sources such as geoBoundaries, Natural Earth, OpenStreetMap, and government open data.
These maps are edited visual materials, not raw data files, and are provided for education, documents, presentations, and graphic reference.