Sevier County is easiest to understand as a transition from the lower hills around Sevierville to the much higher Great Smoky Mountains along the southern side of the county. The road map shows Sevierville, Pigeon Forge, and Gatlinburg forming a clear north-to-south sequence, while the water layer traces the West Prong of the Little Pigeon River and the Little Pigeon River through valleys cut into increasingly rugged terrain. The elevation map makes the contrast unmistakable: broad green lowlands in the north give way to deeply dissected ridges and high mountain slopes in the south. The maps on this page can be viewed as WebP previews, and the matching high-resolution A3 JPG files are available together in the download box below.
Sevierville is the county seat and the main reference point on the supplied city map. Pigeon Forge is shown about 8 miles away, Gatlinburg about 14 miles away, and Pittman Center about 16 miles away in a different direction. Those labels make more sense when they are read with the terrain rather than as isolated destinations. Sevier County had 98,380 residents in the 2020 census, and the attached Census material lists a July 2025 estimate of 101,342. The county also includes 592.5 square miles of land and 5.2 square miles of water, but its most important visual feature is not the area total. It is the rapid change from settled valleys and rolling northern terrain to the high, closely spaced ridges of the Smokies.
Table of Contents
Start with Sevierville, then follow the roads south
On the general county map, Sevierville sits slightly north of the county’s middle and is marked near the Sevier County Courthouse. From there, the most obvious chain of named places runs south through Pigeon Forge to Gatlinburg. Pittman Center lies farther east, Fairgarden appears northeast of the main city chain, and Seymour provides a useful western reference near the county edge. This arrangement immediately separates the more developed northern and central valleys from the broad mountain area occupying much of the southern half of the county.
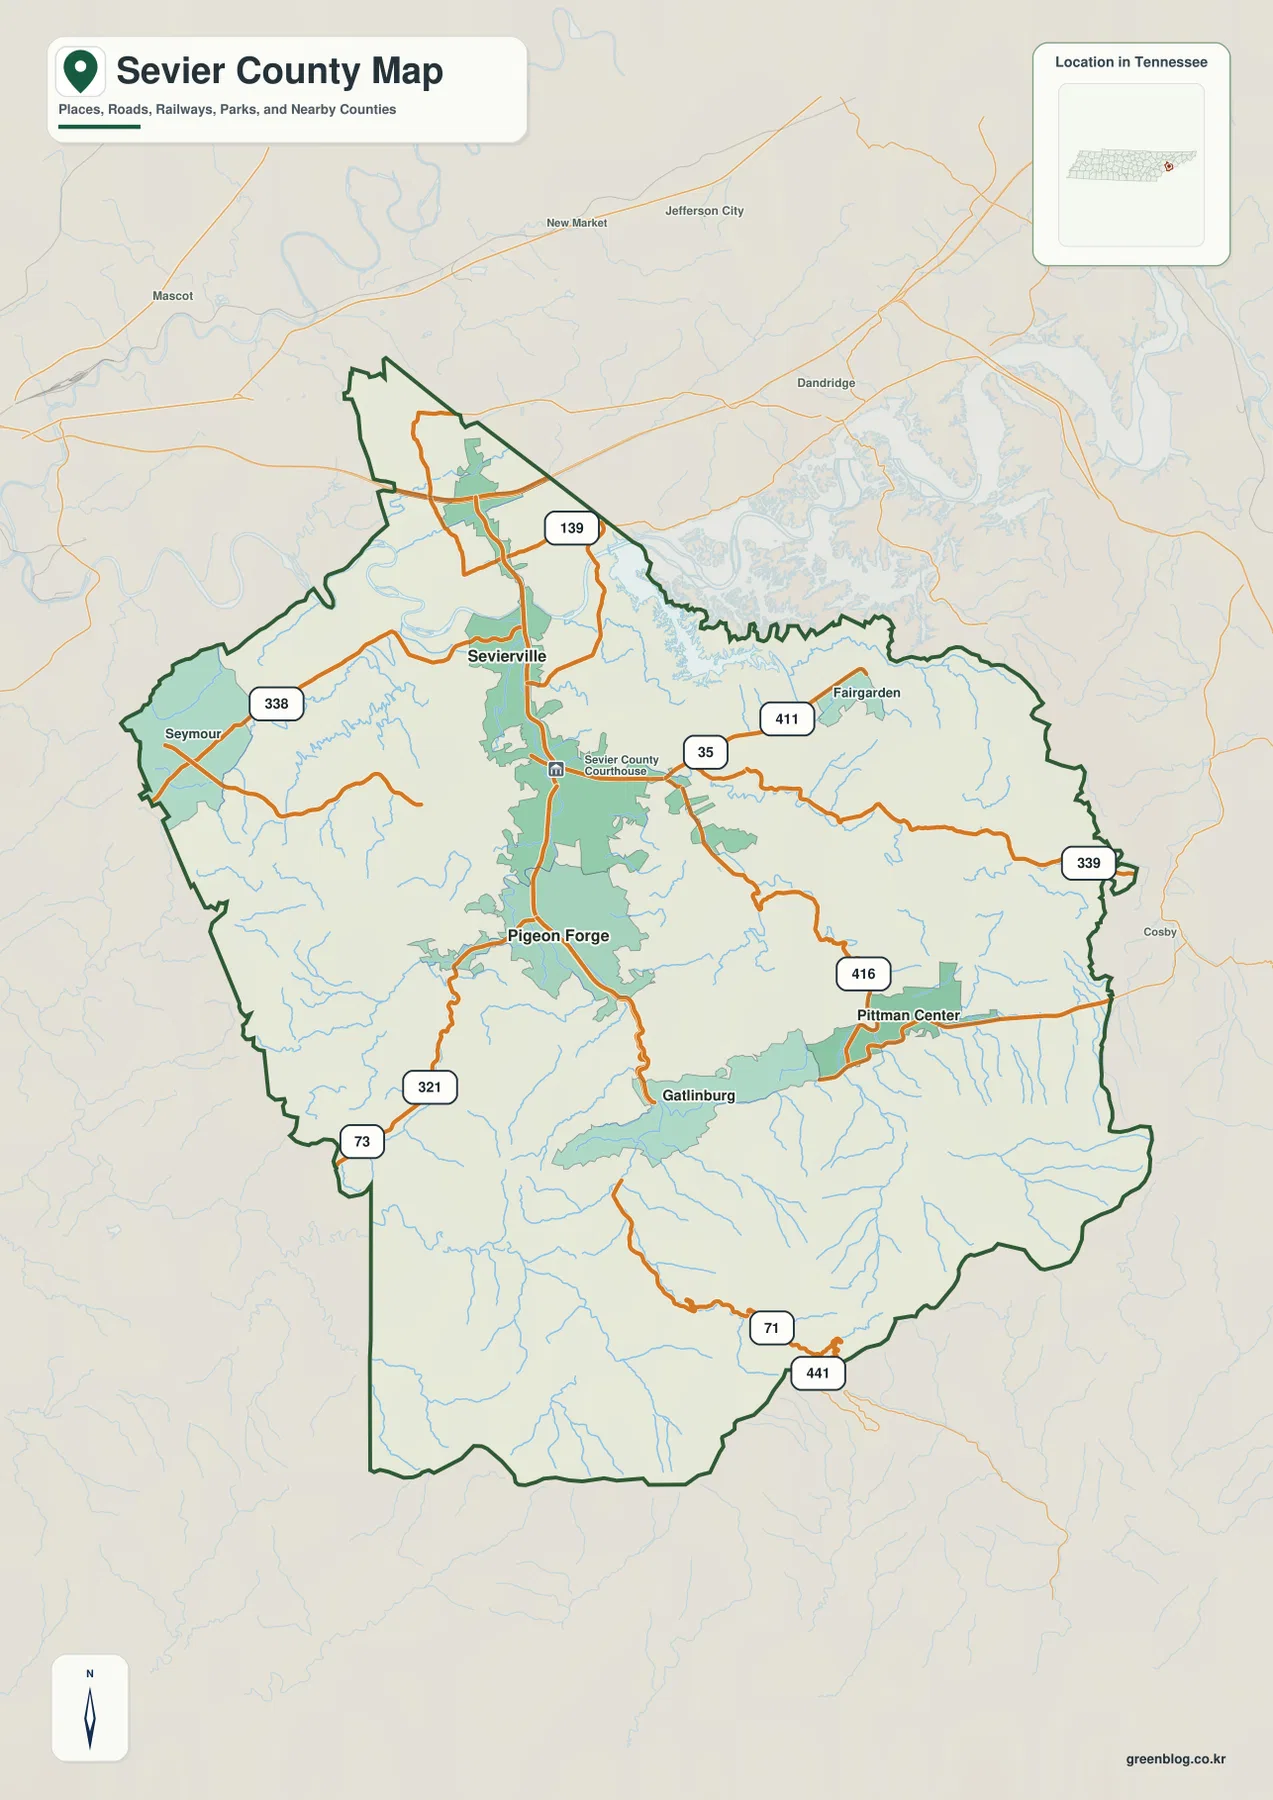
US 441 is the clearest north-south road reference because it connects the Sevierville area with Pigeon Forge and Gatlinburg. US 321 is another important route across the southwestern part of the county and near Gatlinburg, while US 411 and SR 416 help organize the eastern side toward Pittman Center. The map also labels routes 338, 339, 139, 35, 71, and 73. Their shapes are worth noticing: instead of forming an even street grid, the roads bend through valleys, converge near the larger communities, and become more constrained as the terrain rises.
| Item | What the supplied material shows |
|---|---|
| County seat | Sevierville |
| FIPS code | 47155 |
| 2020 population | 98,380 |
| July 2025 population estimate | 101,342 |
| Land and water area | 592.5 sq mi land; 5.2 sq mi water |
| Primary city references | Sevierville, Pigeon Forge, Gatlinburg, Pittman Center |
| Useful route references | US 441, US 321, US 411, SR 416 |
The county outline contains far more than the built-up strip between Sevierville and Gatlinburg. Large areas of mountain terrain, narrow tributary valleys, and protected landscape lie inside the same boundary. That matters when using the map for regional orientation. Two places may look close in a straight line yet be separated by a ridge or reached by a road that follows a winding valley. The general map is useful for comparing county-scale relationships, but it is not intended to replace current turn-by-turn navigation or live road-condition information.
The city map simplifies the Sevierville–Pigeon Forge–Gatlinburg sequence
The city map removes much of the label clutter and gives four communities a clear ranking. Sevierville is the hub, with Pigeon Forge shown about 8 miles away, Gatlinburg about 14 miles away, and Pittman Center about 16 miles away. The directional pattern is just as useful as the numbers. Pigeon Forge and Gatlinburg extend south from Sevierville along the best-known valley corridor, whereas Pittman Center lies east of that line in a different mountain drainage.
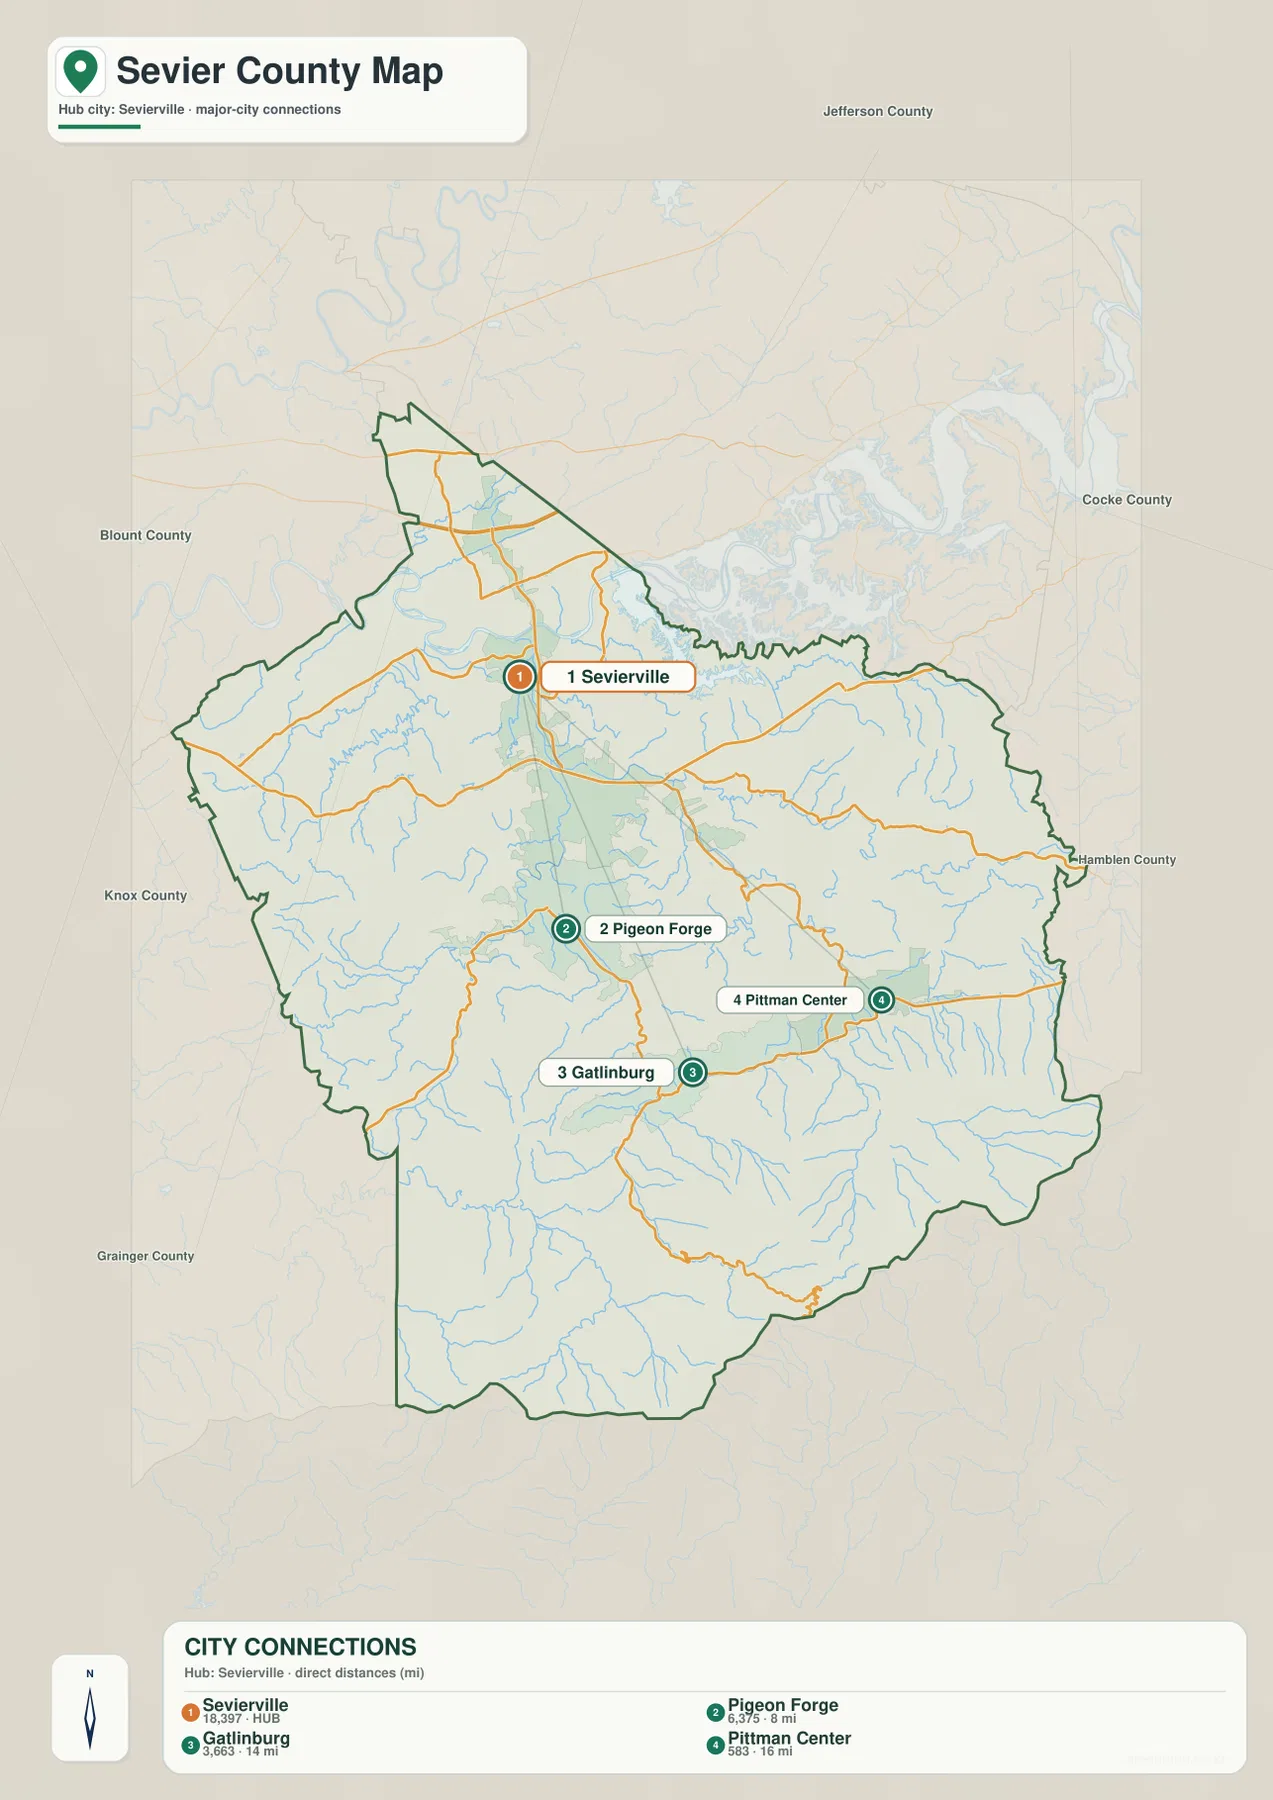
The labels also include population figures: 18,397 for Sevierville, 6,375 for Pigeon Forge, 3,663 for Gatlinburg, and 583 for Pittman Center. These numbers are useful for comparing the highlighted places, but they should not be confused with the population of the whole county or with a complete list of every community. The background still retains roads, streams, and relief, which helps show that the cities occupy accessible valleys rather than being evenly scattered across the county.
This simplified version works well in a presentation, itinerary overview, classroom handout, or regional introduction where the first question is simply “Where are the main cities relative to one another?” Once that relationship is clear, the general map can add Seymour, Fairgarden, more route numbers, and the complete county edge. The elevation map then explains why the southern cities sit close to steep terrain and why east-west travel does not always follow a direct line.
The Little Pigeon River network follows the mountain valleys
The water map gives Sevier County a very different appearance from the road map. The West Prong Little Pigeon River is a major central feature, running out of the southern mountain area toward the developed valley containing Gatlinburg and Pigeon Forge. The Little Pigeon River continues through the central and eastern part of the county, joined by branches and creeks that drain the surrounding ridges. East Fork, Flat Creek, Boyds Creek, and Dunn Creek are among the named tributaries visible on the supplied image.
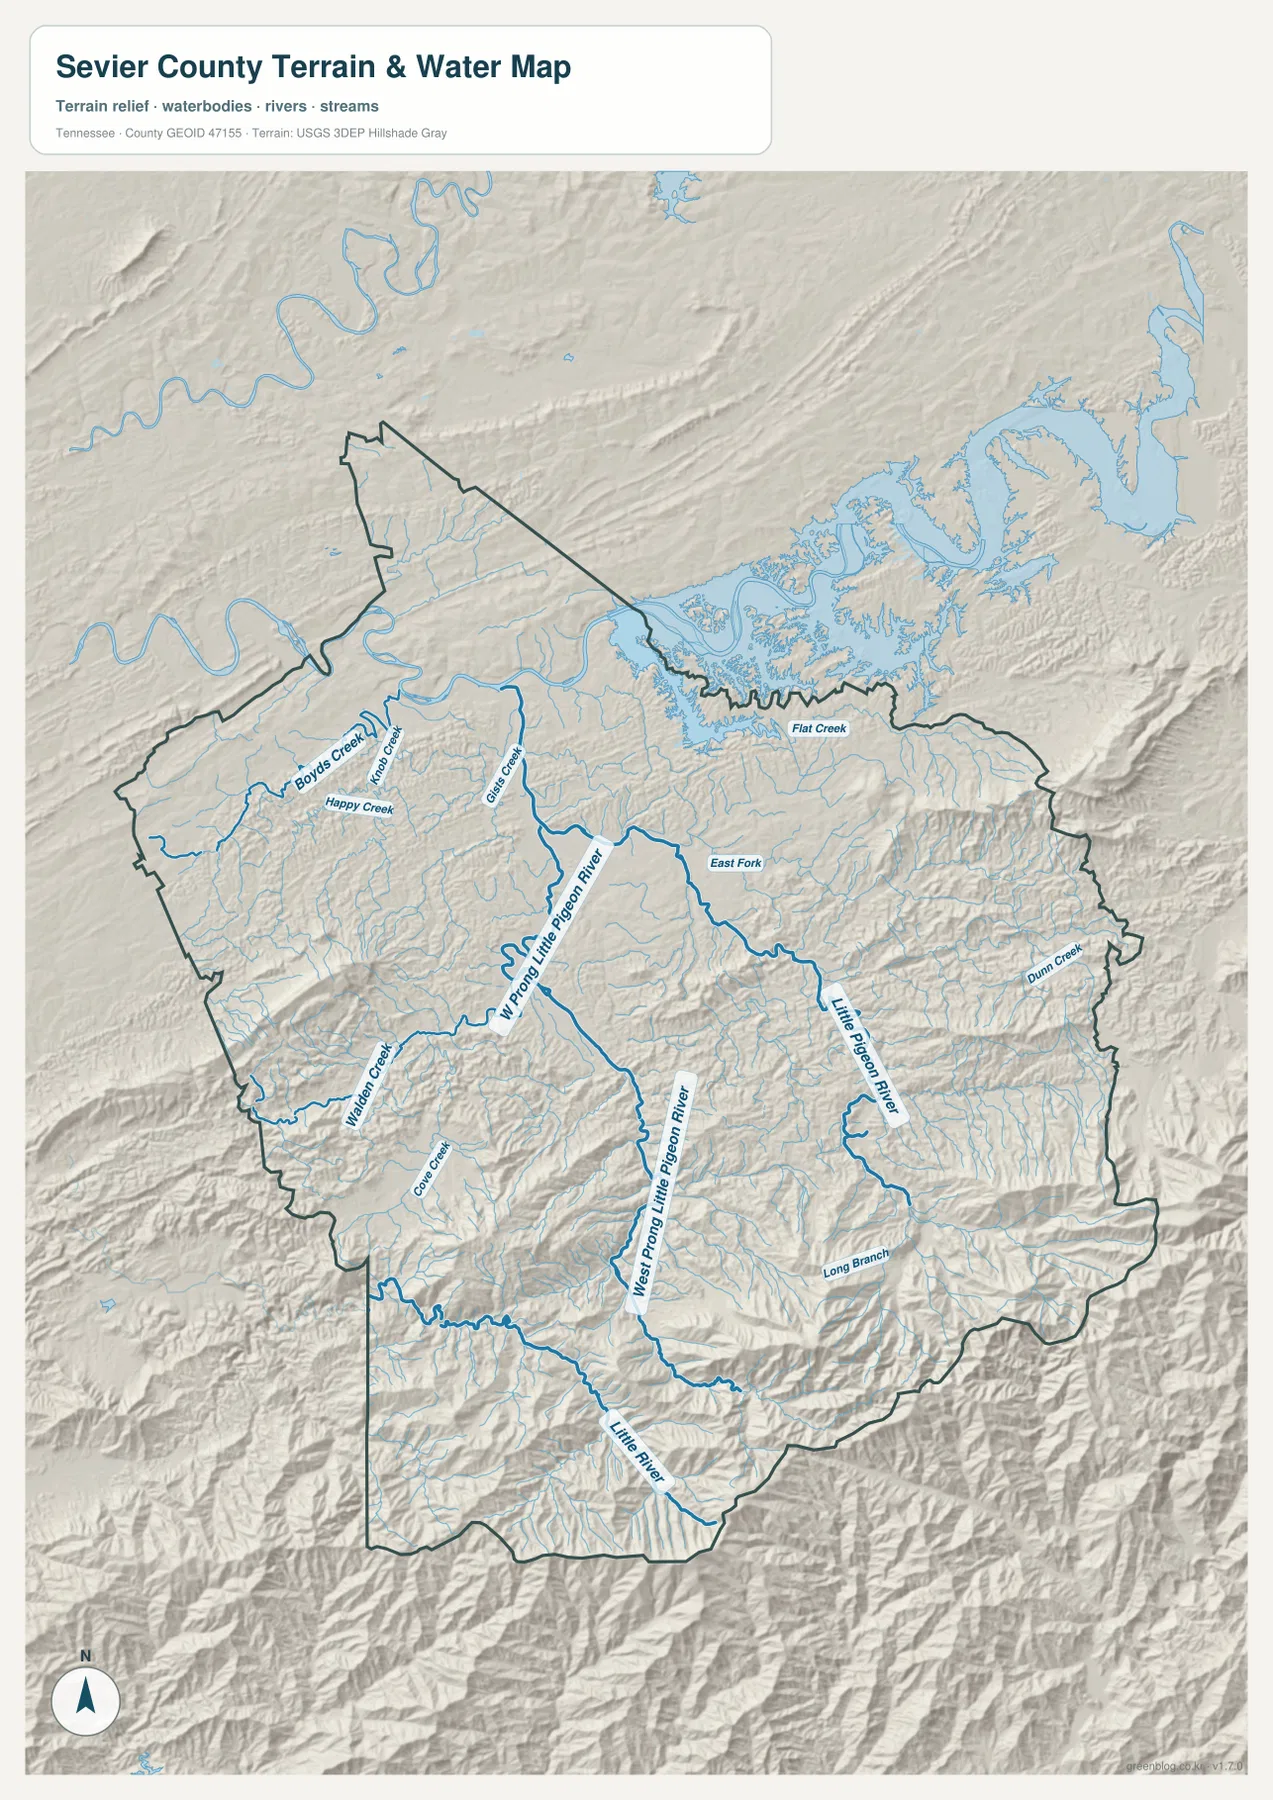
The drainage becomes easier to interpret when the water and elevation maps are compared side by side. In the southern and southeastern mountains, short tributaries descend through narrow valleys and feed larger channels. Farther north, the terrain opens somewhat and the river network passes through broader settled areas. On the western side, Waldens Creek and nearby tributaries help define another set of valleys feeding toward the West Prong system. The result is a branching network that reflects the shape of the mountains rather than a few isolated blue lines.
A large reservoir-like water body is visible beyond the county’s northern edge, but Sevier County itself is not organized around one dominant lake in the supplied map. Its water geography is mainly a story of rivers, creeks, and mountain drainage. That makes this layer particularly useful for explaining valley direction or pairing streams with nearby roads. It does not provide flood zones, live water levels, boating access, or channel depth, so those questions require a more specialized current source.
Elevation rises sharply toward the southern Smokies
The elevation map provides the strongest visual contrast in the set. Most of the northern third is dark green, indicating the lower end of the local elevation range. Moving south, the colors shift through lighter green and yellow before reaching tan and brown across the high mountain belt. The supplied legend reports an actual county range of roughly 221 to 2,020 meters and a mean elevation near 602 meters. Few single statistics describe the county as clearly as that spread between low valley floors and very high ridges.
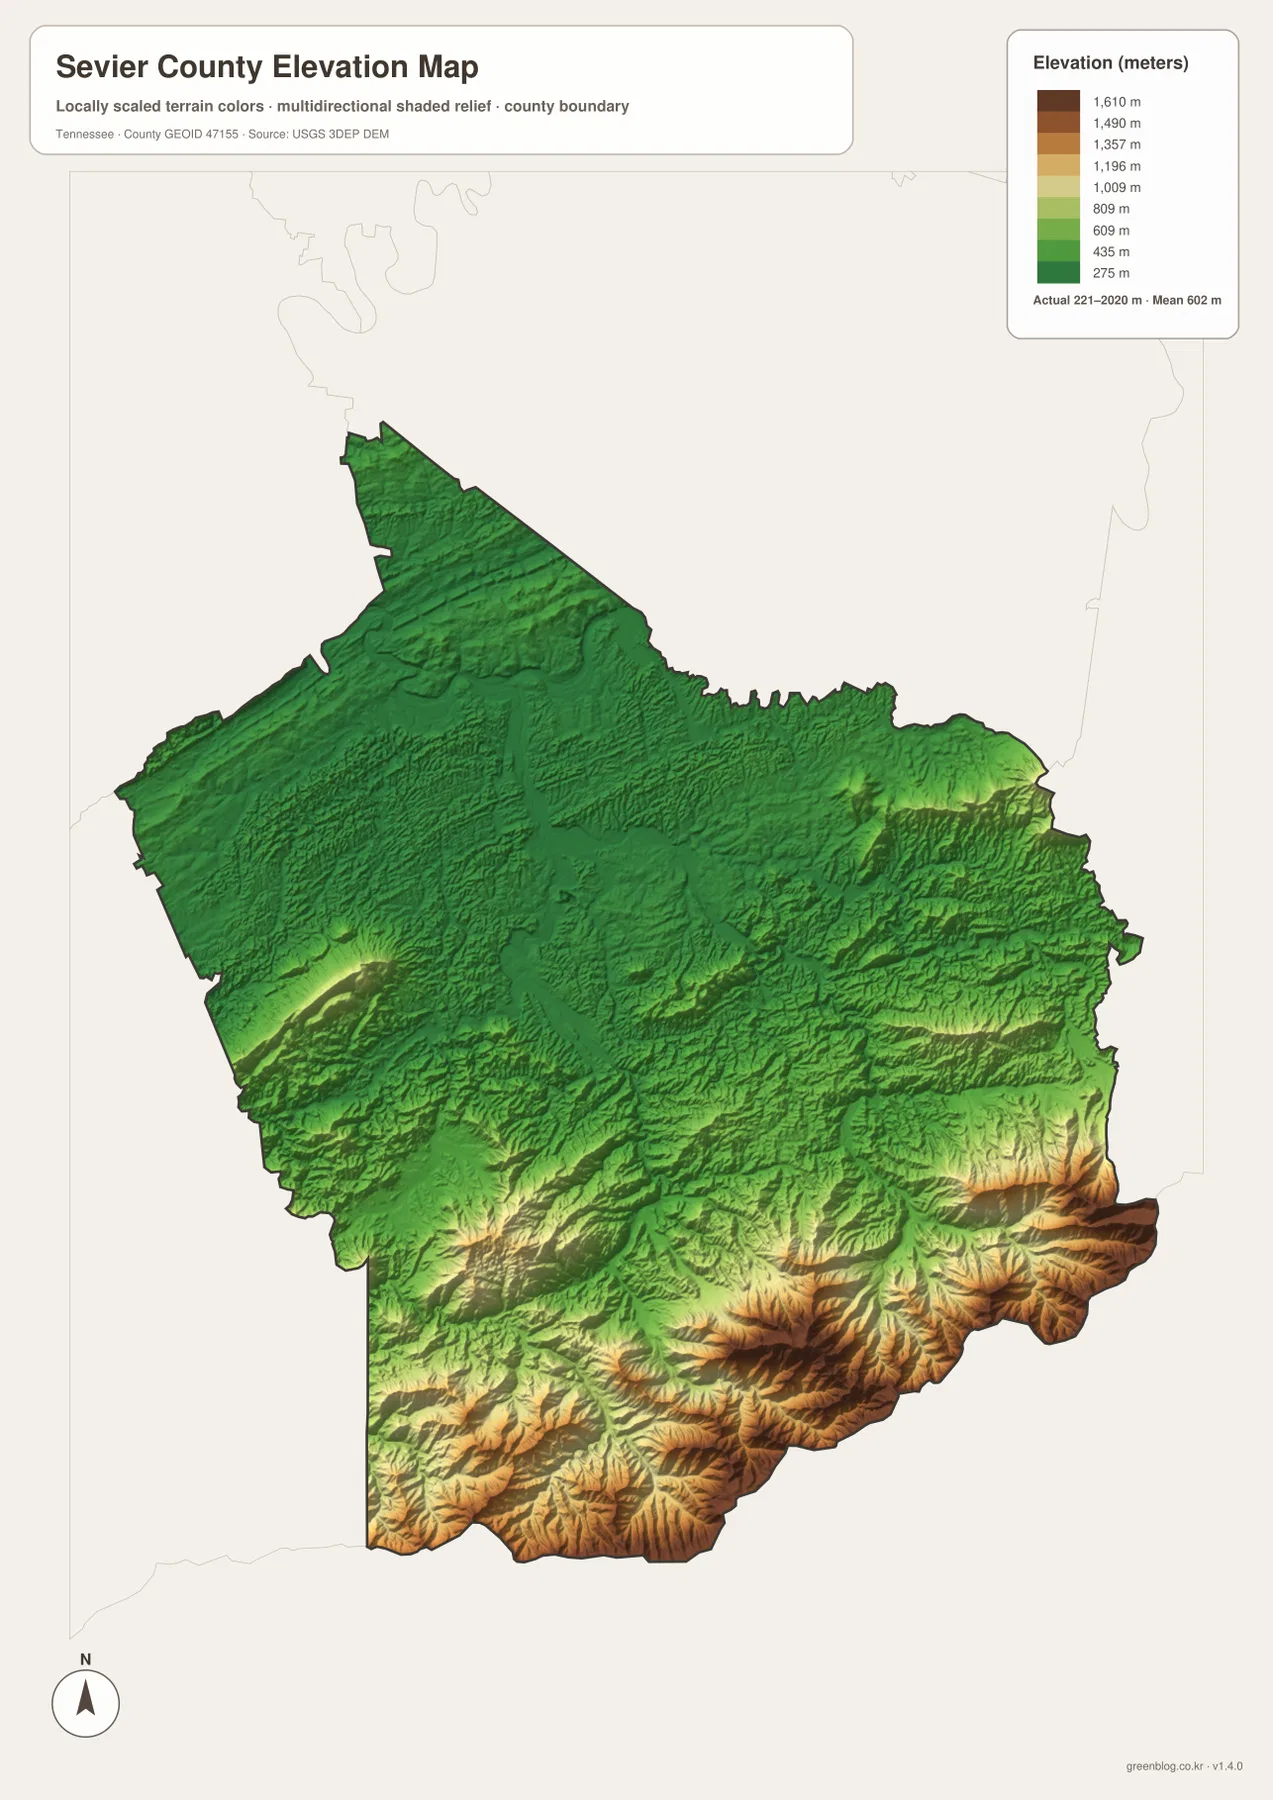
The highest colors are concentrated along the southern and southeastern side, where closely spaced ridges and deep valleys create a much rougher surface than the terrain around Sevierville. Pigeon Forge sits near the transition, while Gatlinburg and Pittman Center lie closer to the mountain front. This helps explain several patterns visible on the other maps: major roads funnel through a limited number of valleys, tributaries run down steep slopes, and the largest continuous developed areas are easier to see in the lower northern and central corridor.
The map is also a reminder that “the Smokies” are not simply a label placed at the bottom of the county. The terrain changes gradually at first and then becomes much more dramatic, with ridges separated by narrow drainage lines. For general geographic study, that makes the elevation layer an excellent companion to the city map. It explains why Gatlinburg can be relatively close to Sevierville in map distance while occupying a very different physical setting.
Elevation colors are intended for county-scale comparison, not parcel surveying or engineering design. A brown ridge on this map identifies higher terrain relative to the rest of Sevier County; it does not provide a precise elevation for a particular building site or trail junction. When exact elevation, trail conditions, or road closures matter, use the relevant current agency or survey source.
Match the map to the information you actually need
Because Sevier County combines a busy city corridor with extensive mountain terrain, the maps are more useful when they are not forced to do the same job. The general map is best for boundaries, named communities, and route numbers. The city map is cleaner when Sevierville and the three highlighted connections are the main point. The water map is the strongest choice for the Little Pigeon River system and tributary valleys, while the elevation map explains the steep north-to-south change in relief.
- County orientation: use the general map for Sevierville, Pigeon Forge, Gatlinburg, Pittman Center, Seymour, roads, and the full boundary.
- City comparison: use the city map to show the direction and approximate mapped distance from Sevierville to Pigeon Forge, Gatlinburg, and Pittman Center.
- River and valley study: use the water map for the West Prong Little Pigeon River, Little Pigeon River, and named tributaries.
- Mountain geography: use the elevation map to compare the lower north with the high, rugged southern Smokies.
- Printing and annotation: use the A3 JPG originals when you need a larger image for labels, notes, or classroom work.
A useful way to combine the files is to establish Sevierville and the county boundary first, simplify the main city sequence second, and then use water and elevation to explain why the transportation and settlement pattern looks the way it does. That approach avoids repeating the same description beneath every image. It also makes the download set practical: each file answers a different geographic question while preserving the same county reference.
Frequently Asked Questions
How are Sevierville, Pigeon Forge, and Gatlinburg arranged on the map?
Sevierville is the county seat and the northern hub on the supplied city map. Pigeon Forge lies to the south at about 8 mapped miles from Sevierville, and Gatlinburg continues farther south at about 14 miles. US 441 follows the same general corridor. The elevation map shows why the setting changes along that short sequence: terrain becomes noticeably higher and more rugged as the route approaches Gatlinburg and the Great Smoky Mountains.
What does the Little Pigeon River map add to the road map?
The water layer shows the valleys that many roads and communities depend on. The West Prong Little Pigeon River and Little Pigeon River collect water from tributaries such as East Fork, Flat Creek, Boyds Creek, and Dunn Creek. Seeing those channels against the shaded terrain helps explain why roads bend through particular corridors instead of crossing the mountains in straight lines.
What files are included in the downloadable ZIP?
The archive contains four high-resolution JPG files: the general county map, the city map centered on Sevierville and its main connections, the terrain-and-water map, and the elevation map. They are prepared for A3 use and are better suited to printing, enlargement, and annotation than the smaller WebP previews embedded in the article.
Map File Information
The ZIP contains the Sevier County general map, city map, water map, and elevation map as high-resolution A3 JPG files. Use the WebP images above for quick viewing and the JPG originals when you need a larger printable or editable copy.
- Included Files: county map, city map, water map, and elevation map
- File Type: ZIP containing 4 JPG files
Related Maps
Sources and References
- Tennessee State Library and Archives Sevier County fact sheet
- Tennessee Department of Transportation Sevier County map
- U.S. Census Bureau QuickFacts for Sevier County
- U.S. Census Bureau TIGER/Line boundary data
- USGS National Hydrography
- USGS 3D Elevation Program
Green Map creates custom-edited map images using open geographic data sources such as geoBoundaries, Natural Earth, OpenStreetMap, and government open data. These maps are edited visual materials, not raw data files, and are provided for education, documents, presentations, and graphic reference.