You can download the Tipton County map set on this page as a ZIP containing four high-resolution A3 JPG files. The maps show a county with two very different geographic faces: Covington, Atoka, Munford, and Brighton occupy the road-connected interior, while the western edge opens into very low Mississippi River terrain with broad bends and old channels. Looking at the settlements, streams, and elevation together gives a much clearer picture than treating Tipton County as simply the northern fringe of the Memphis area.
US 51 is the easiest route for orienting the main population centers. Covington sits in the north-central part of the county, Brighton lies farther south, and Atoka and Munford form a close pair near the southern edge. The water map adds the Hatchie River and a network of creeks, while the elevation map shows an actual mapped range of about 60 to 139 meters, with the lowest ground concentrated toward the Mississippi side and higher dissected terrain across the center and south.
Table of Contents
Covington and the US 51 corridor toward Brighton, Atoka, and Munford
Covington is the county seat and the clearest northern reference point on the county map. Several routes spread out from the city, but US 51 is especially useful because it continues south through the central part of Tipton County. Following that line brings Brighton into view first, then Atoka and Munford near the southern boundary. The arrangement creates a strong north-south settlement pattern rather than a single cluster centered entirely on Covington.
The southeastern corner has a different pattern. Mason sits near the 59, 70, and 79 route labels, while 54 and 179 extend eastward from the Covington side. West of the US 51 corridor, 178 connects toward Gilt Edge and Burlison, and Randolph appears closer to the irregular western boundary. These places help show the county’s full width and prevent the busier Covington–Atoka corridor from becoming the only part of the map a reader notices.
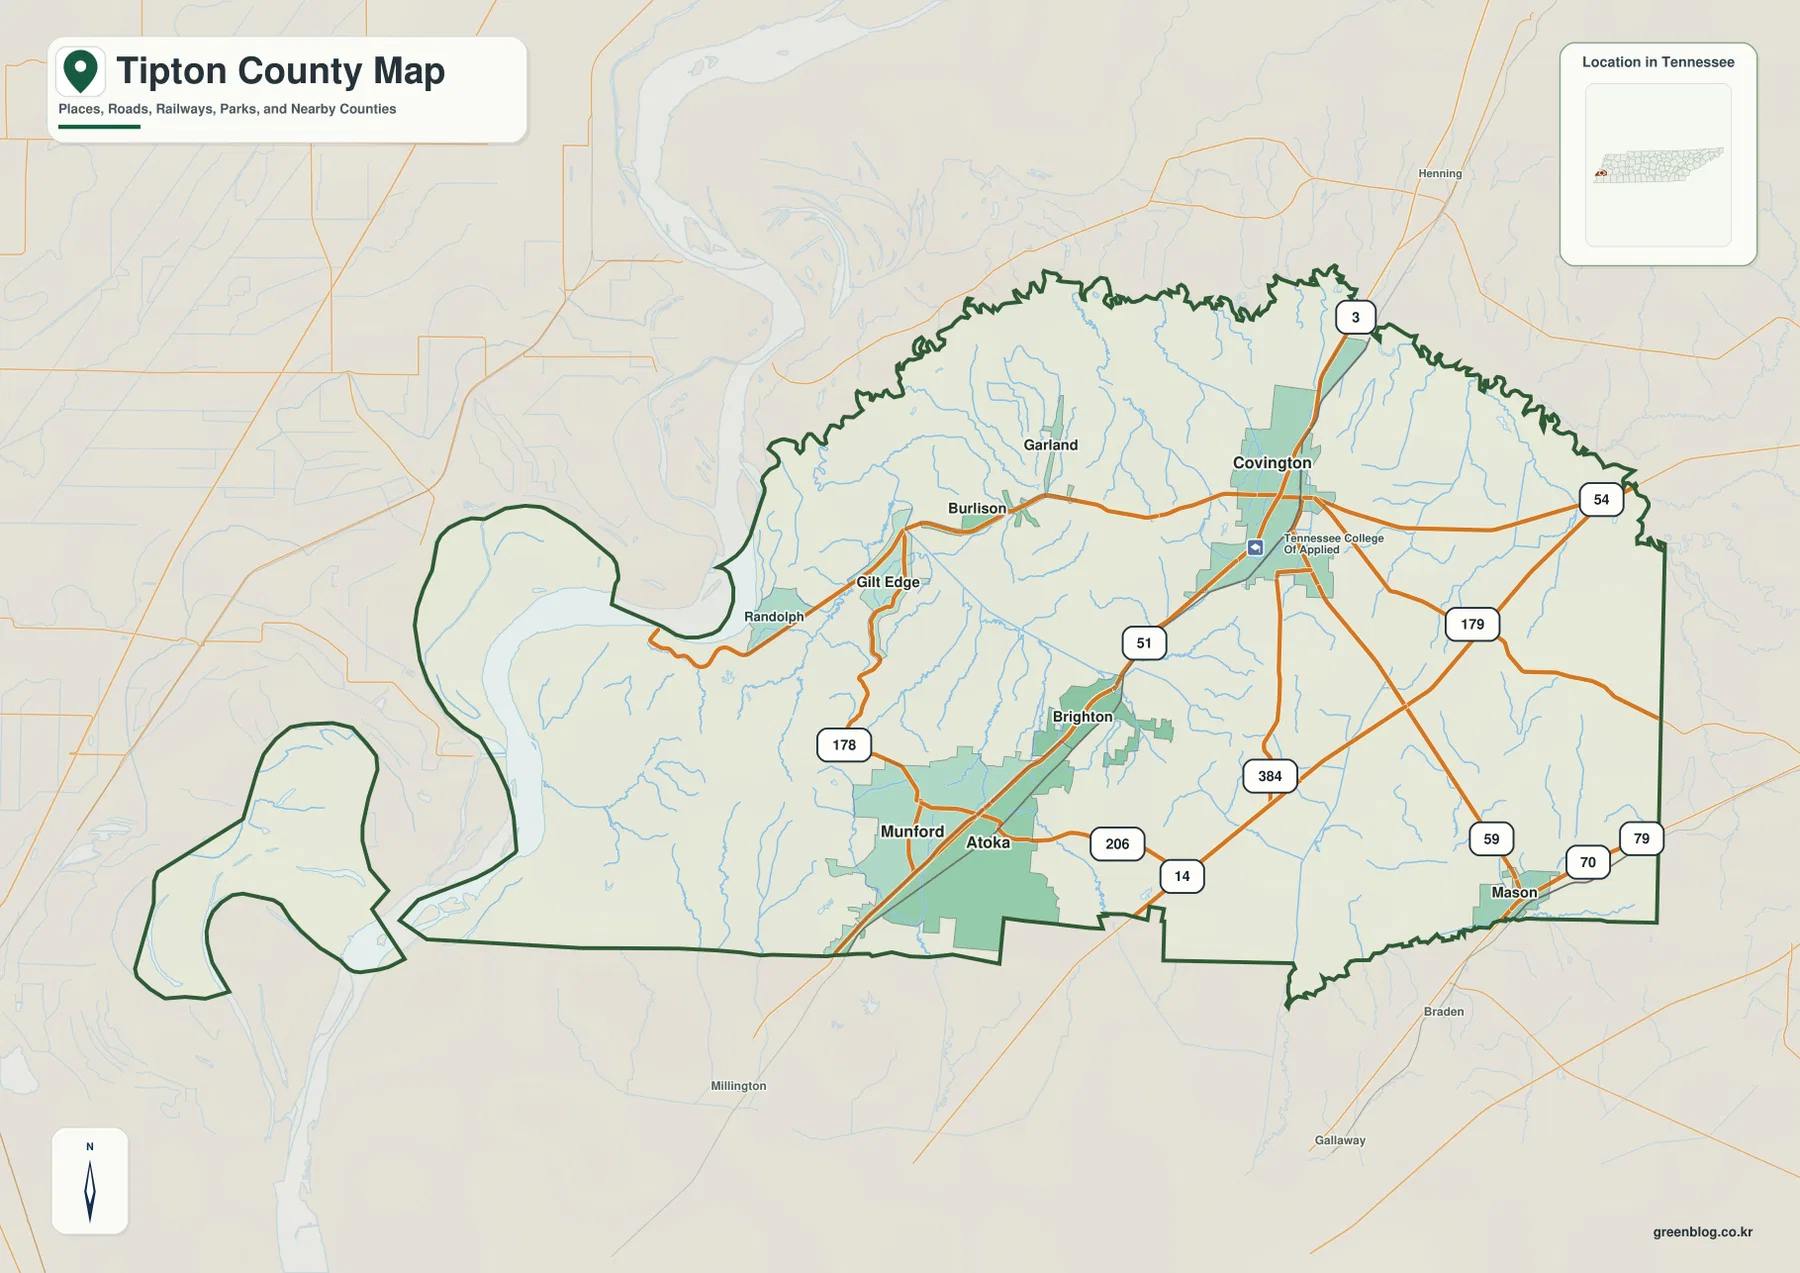
The county’s outline is itself an important geographic clue. The eastern and southern edges are comparatively straightforward, but the west side contains broad curves and separated-looking lobes associated with the Mississippi River landscape. Lauderdale County lies to the north, Haywood and Fayette counties are to the east, and Shelby County is to the south. Across the Mississippi side are Arkansas counties, so the western edge is both a county boundary and a state boundary shaped by a major river system.
Six mapped communities show how the population centers are distributed
The city map highlights six places: Atoka, Covington, Munford, Brighton, Mason, and Gilt Edge. The values printed on the graphic are 10,385 for Atoka, 8,587 for Covington, 6,588 for Munford, 2,889 for Brighton, 1,039 for Mason, and 516 for Gilt Edge. Those numbers belong to the city comparison shown on the supplied map and should not be confused with the population of the entire county.
Their positions are just as useful as the rankings. Atoka and Munford are close together in the south, with Brighton just north of them. Covington stands farther north and serves a different administrative role as county seat. Mason is separated toward the southeast, while Gilt Edge lies well to the west of the main US 51 group. Taken together, the six labels reveal a county with several distinct settlement pockets instead of one continuous urban area.
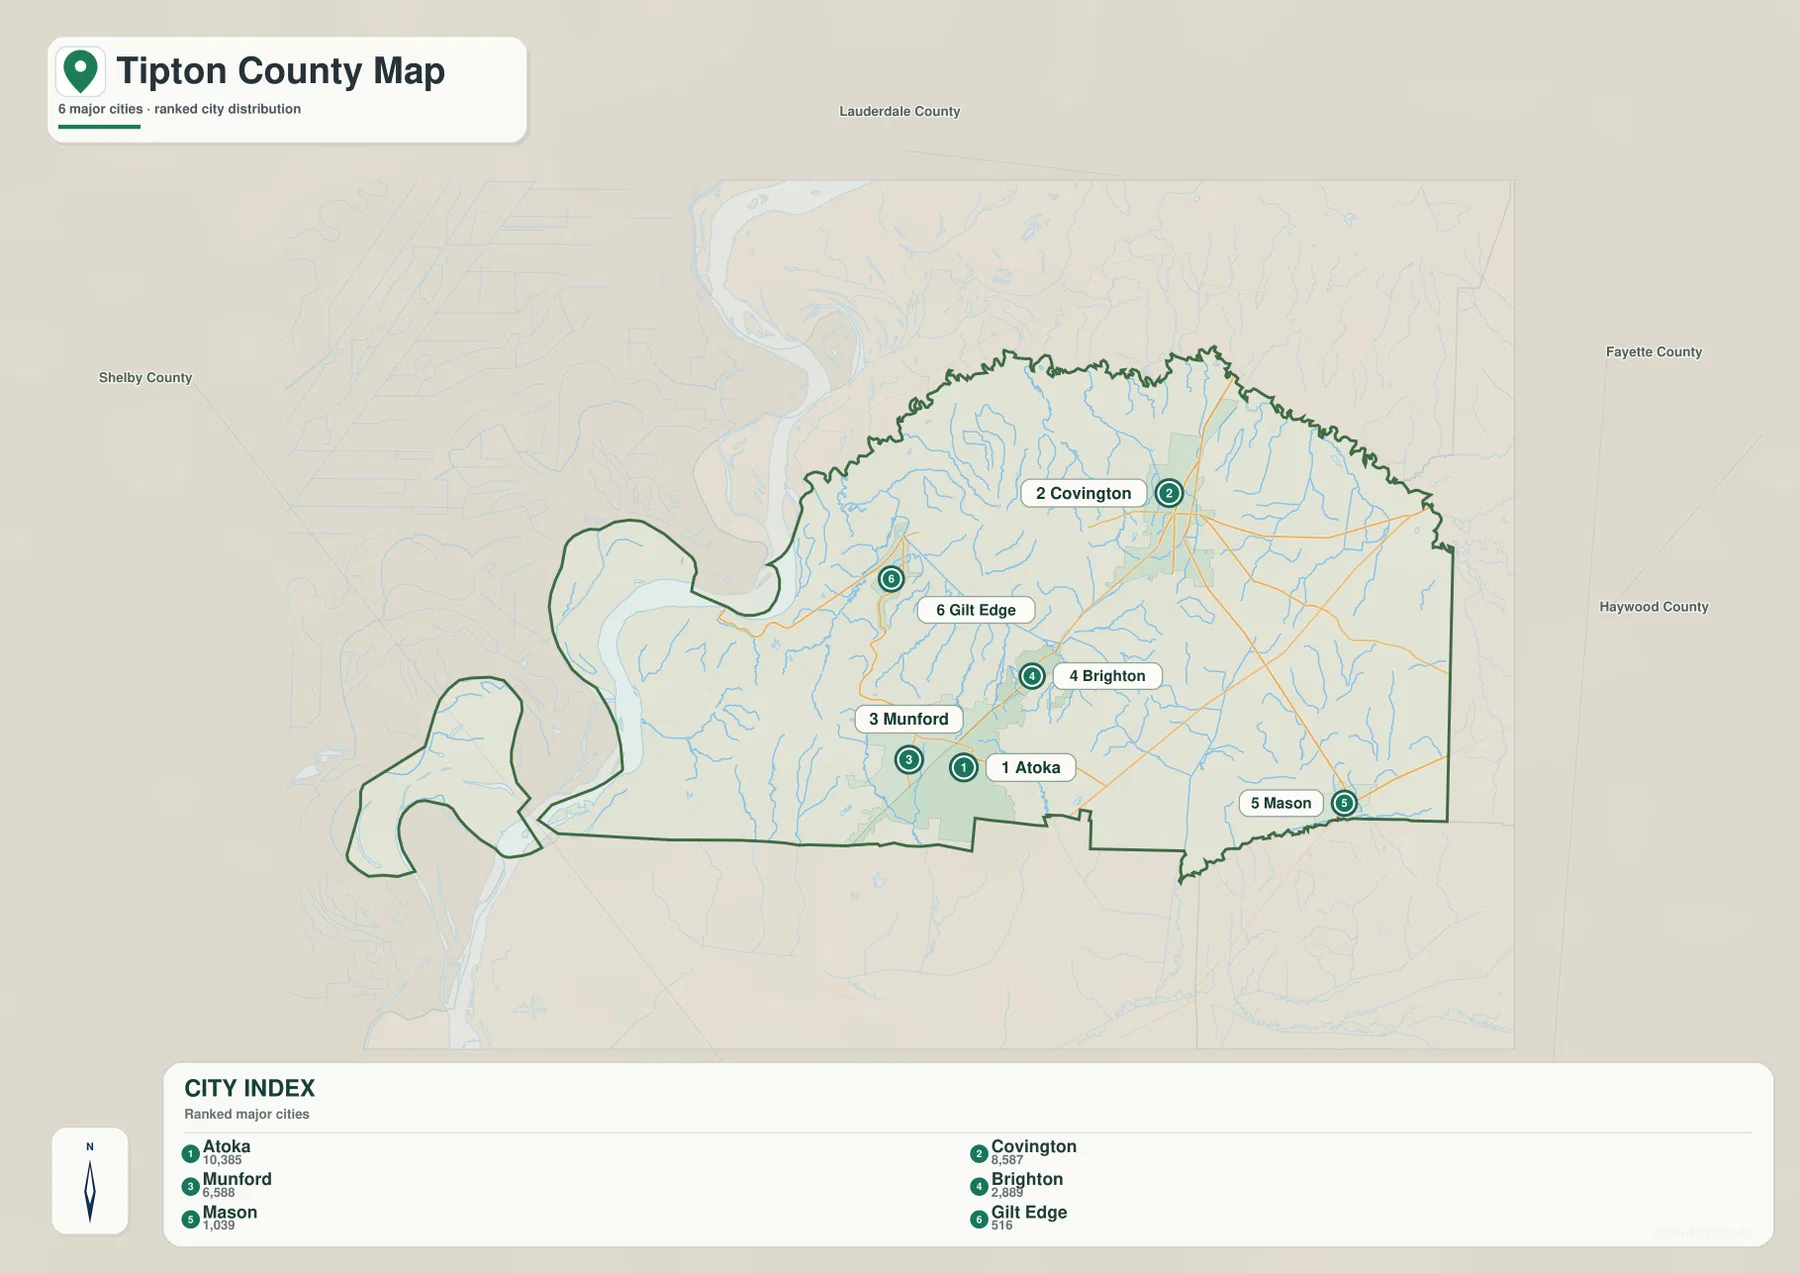
Countywide figures give the larger scale. The existing reference material lists 60,970 residents in the 2020 census and a July 2025 estimate of 62,287. That total includes people living outside the six highlighted municipal labels. The western lowlands, northern rural areas, and smaller communities therefore remain important parts of the county even though the city graphic intentionally focuses on the most prominent named centers.
Hatchie River, creeks, and the drainage network across northern Tipton County
The water map gives the Hatchie River the strongest label in the northern part of the county. Around it, Hatridge Creek, Martins Creek, Town Creek, Flat Creek, and Richland Creek form a branching network that descends through the gently rolling interior. The pattern is very different from the broad Mississippi-side water landscape, where large bends, old channels, and low floodplain surfaces dominate the western edge.
Farther south and west, the map identifies Hurricane Creek and Indian Creek Canal, with Grayson Creek nearby. Big Creek runs through the southern interior, and smaller water bodies such as Leaf Lake, Glenview Lake, Walker Pond, and Meade Lake add local reference points. These names make the terrain easier to interpret because the creeks generally occupy the lower corridors between the narrow ridges visible in the shaded relief.
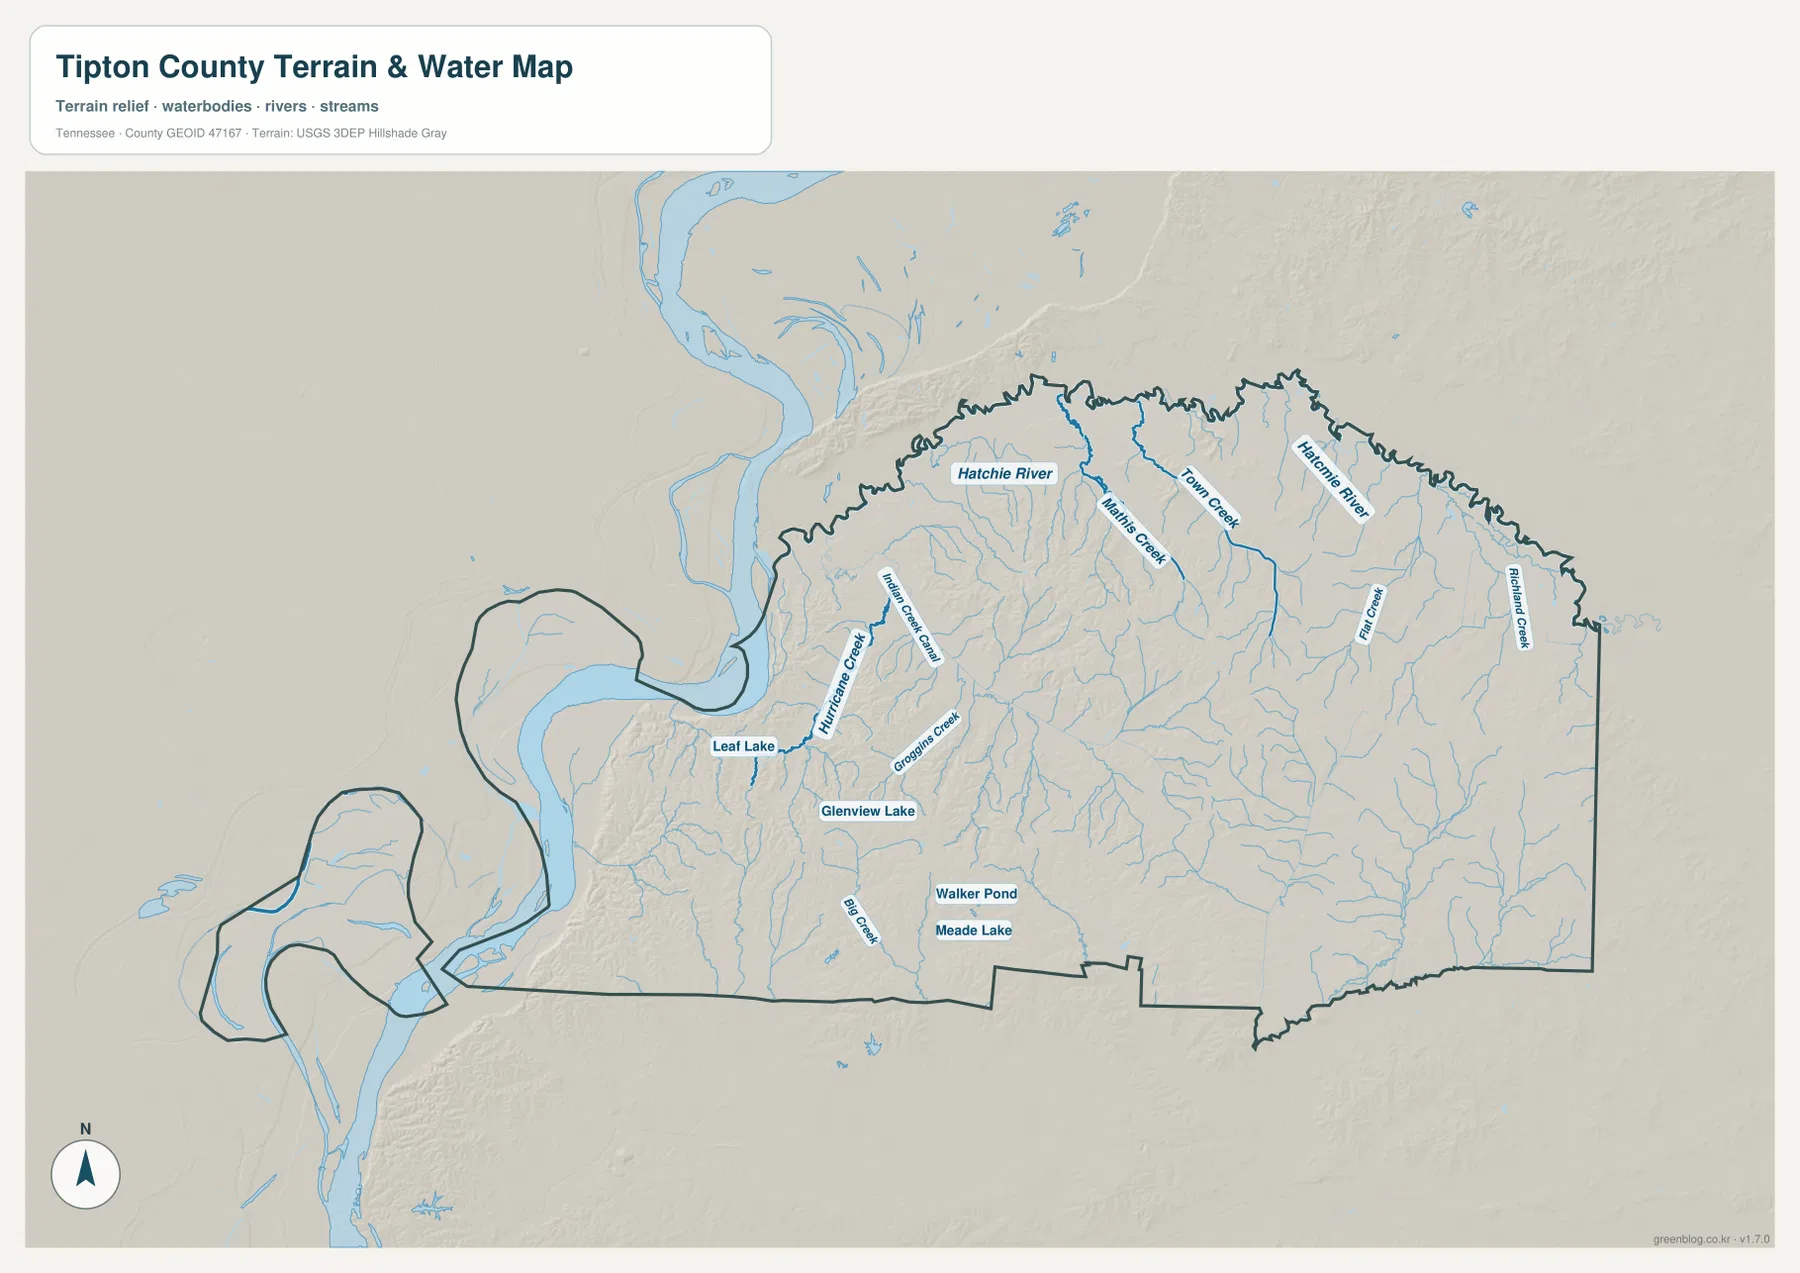
This is a geographic reference map, not a live flood or navigation product. It does not provide current river stage, levee conditions, flood boundaries, channel depth, boat routes, or property lines. Conditions along the Mississippi and Hatchie rivers can change far more quickly than a static county image, so travel, boating, flood preparation, and emergency decisions require current information from the responsible agencies.
From Mississippi lowlands near 60 meters to interior hills above 100 meters
The elevation map shows an actual county range of roughly 60 to 139 meters and a mean near 95 meters. The western side is the easiest part to recognize because broad dark-green areas follow the Mississippi River lowlands. Relief there is comparatively subdued. Moving east into the county, however, the surface becomes much more textured and narrow yellow, tan, and brown ridges appear in close succession.
Some of the most prominent higher ground occupies the central and south-central interior, where many ridges rise above 100 meters and locally approach the upper end of the mapped range. The northern interior also contains rolling higher ground, though it is not as continuous as the darkest brown zones farther south. The eastern side generally drops away from those interior highs and is crossed by several tributary valleys.
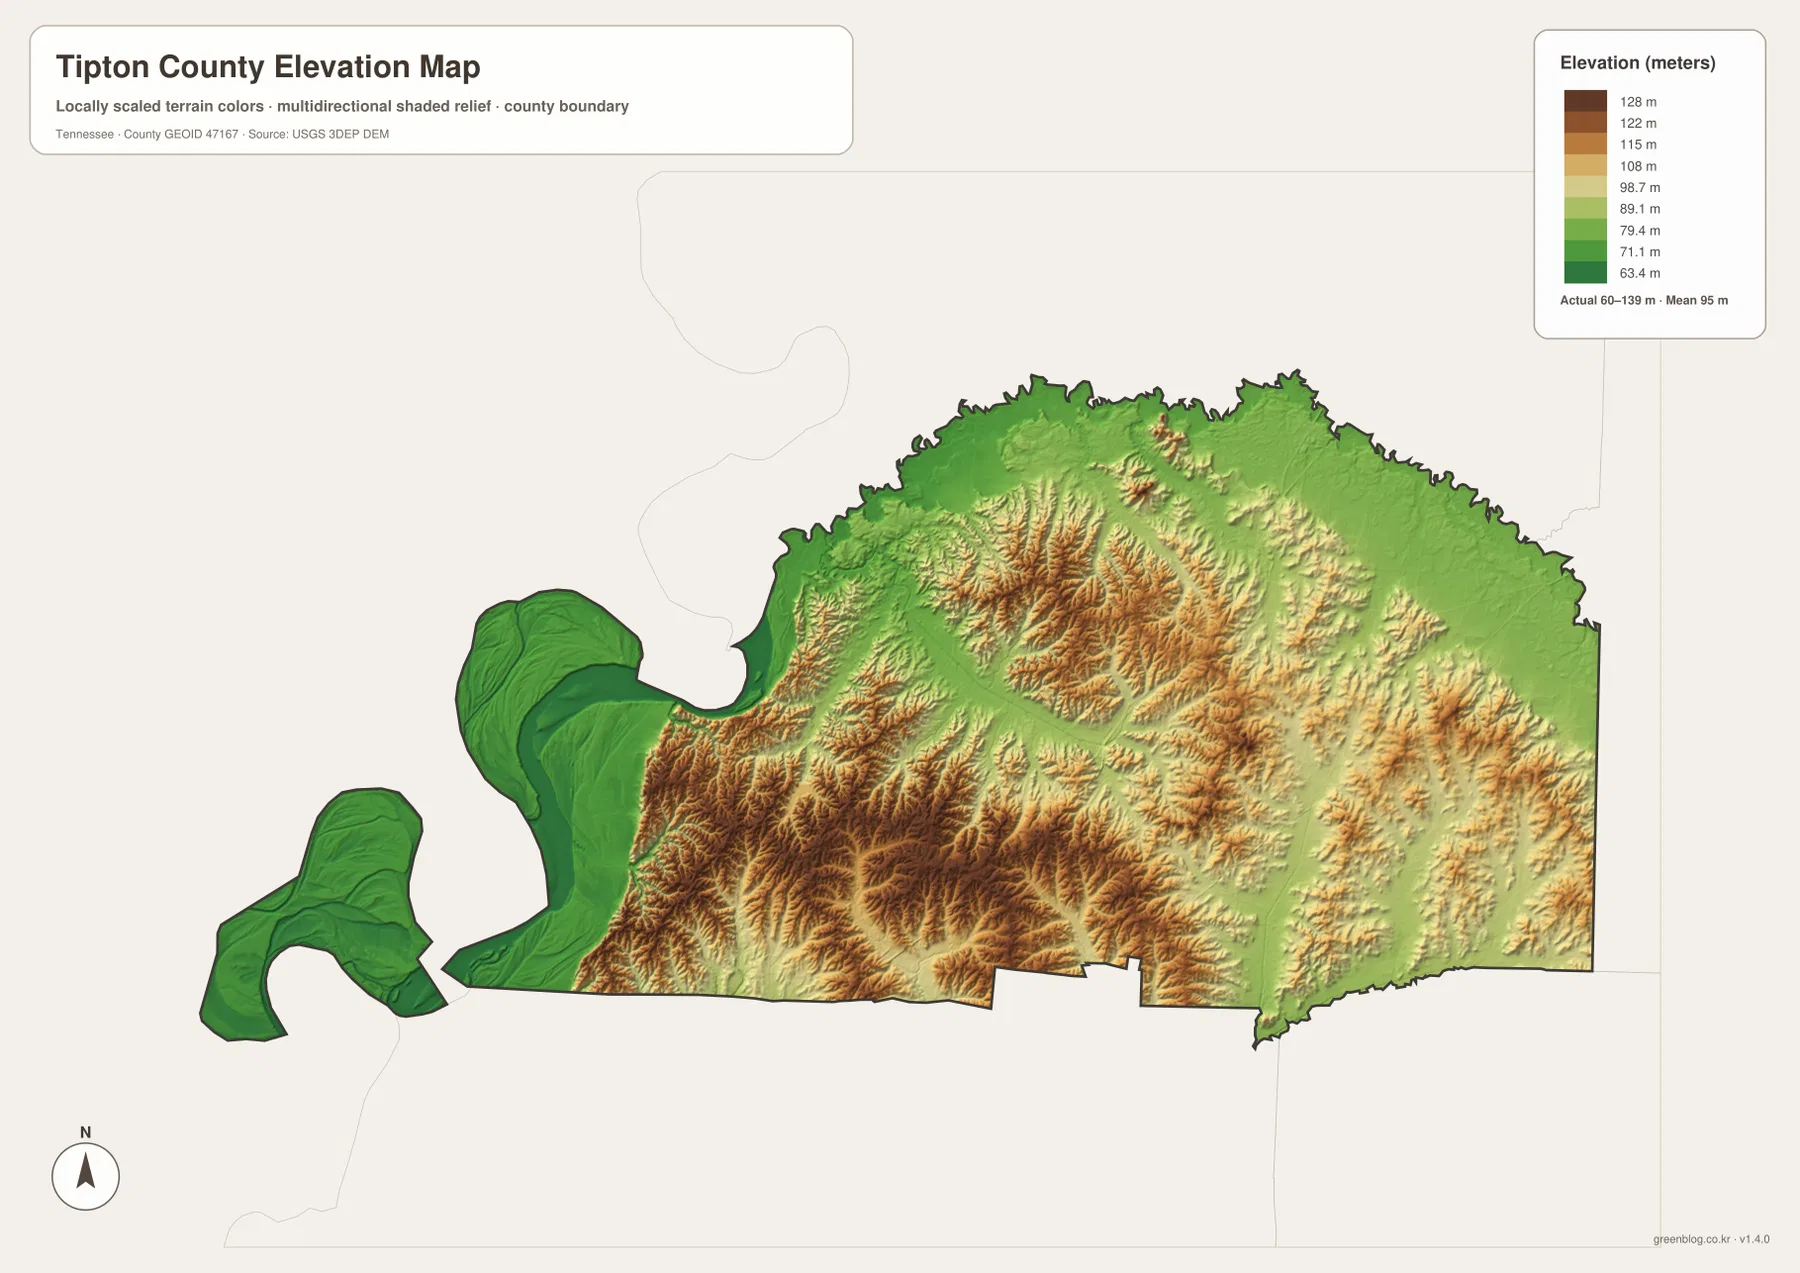
This county-scale surface is useful for comparing broad terrain, but it is not survey-grade elevation. It should not be used to determine a parcel’s exact height, a building pad, road grade, drainage design, or legal flood elevation. Those tasks require the original elevation data at a finer scale and, when appropriate, field surveying.
Why the road pattern changes between the river side and the interior
US 51 provides the clearest north-south framework through the settled interior, linking the Covington area with Brighton, Atoka, and Munford. East-west movement is distributed among routes such as 54, 179, 178, 70, and 79. The county map alone makes these roads look like a simple network, but the water and elevation maps explain why the geometry differs from place to place.
Near the Mississippi side, the ground is low yet crossed by major water features and old channels, so low elevation does not automatically mean simple access. In the central and southern interior, the waterways are smaller, but the terrain contains many short ridges and valleys. A road may therefore curve to stay on favorable ground, cross a creek at a practical location, or avoid an area where the relief changes more sharply.
The supplied reference data lists about 455.6 square miles of land and 12.6 square miles of water for Tipton County. Dividing the 2020 census population of 60,970 by the land area gives a countywide density of about 134 people per square mile. That average is useful only as broad context; it does not mean Atoka, Munford, Covington, the rural west, and the northern creek valleys all contain the same concentration of residents.
Choosing the right Tipton County map for the task
Start with the county map when you need communities, major roads, and the boundary in one view. It is particularly useful for tracing US 51 from Covington toward the southern population centers or for locating Mason and Gilt Edge on opposite sides of the county. The city map is better when the goal is to compare the six highlighted settlements without the distraction of a full road-and-terrain background.
Use the water map for the Hatchie River, named creeks, small lakes, and the broad Mississippi-side drainage setting. The elevation map adds the contrast between the low west and the higher central-southern interior. For a printed study sheet, one copy can emphasize settlements and roads while a second copy can be marked with rivers, creeks, lowlands, and ridge areas.
Tipton County was established in 1823, and Covington is the county seat in the supplied reference material. That administrative role is worth distinguishing from current settlement distribution: Atoka has the largest value shown on the supplied city graphic, while Covington remains the government reference point. The difference between those roles is one of the most useful county-specific details to keep in mind when reading the map.
Frequently Asked Questions
How are Covington, Atoka, and Munford positioned within Tipton County?
Covington is the county seat in the north-central part of the county. Atoka and Munford are close together near the southern edge, with Brighton between them and Covington along the broader US 51 corridor. The arrangement makes US 51 a convenient map reference, although actual travel time still depends on current roads and intersections.
Why is the western side so low on the elevation map?
The west side is part of the low Mississippi River landscape, where broad green areas on the map are commonly around the lower end of the county’s 60–139 meter range. Interior ridges rise above 100 meters and create a strong color contrast. The map is designed for county-scale terrain comparison and should not be treated as a parcel survey.
Which waterways are easiest to identify on the Tipton County water map?
The Hatchie River is the most prominent named river in the north. Hatridge Creek, Martins Creek, Town Creek, Flat Creek, Richland Creek, Hurricane Creek, Indian Creek Canal, and Big Creek are also labeled, along with several small lakes and ponds. For current flood stage or boating information, use current official river and emergency sources rather than this static reference map.
Map File Information
The ZIP contains the high-resolution JPG originals for the Tipton County map, city map, water map, and elevation map used on this page. The four A3-format images are better suited to printing, enlarged viewing, and annotation than the WebP previews in the article.
- Included Files: County map, city map, water map, and elevation map
- File Type: ZIP containing 4 JPG images
Related Maps
- Alamo to Gadsden: A Crockett County Tennessee Map
- Altamont, Monteagle, and Plateau Valleys — Grundy County Tennessee Map
- Around Chattanooga: Hamilton County Tennessee Map
Sources and References
- Tennessee State Library and Archives Tipton County fact sheet
- Tennessee Department of Transportation Tipton County map
- U.S. Census Bureau Tipton County QuickFacts
- USGS National Hydrography
- USGS 3D Elevation Program
Green Map creates custom-edited map images using open geographic data sources such as geoBoundaries, Natural Earth, OpenStreetMap, and government open data. These maps are edited visual materials, not raw data files, and are provided for education, documents, presentations, and graphic reference.