Yuba County crosses two very different California landscapes. The western side lies on the Sacramento Valley floor, where cropland and developed areas are easy to pick out, while the eastern half rises into foothills and mountainous country covered mainly by forest, grassland, and shrubland. The 2025 summary identifies forest as the largest class at 35.19%, but agriculture still accounts for 25.74%, making the county a strong example of how land cover can change sharply within one county boundary.
This page compares four map views: current land cover, forest and farmland, fractional impervious surface, and mapped class differences from 1985 to 2025. The four original JPG maps are available together in one download farther down the page. These are surface-cover maps, not zoning or ownership maps; they classify what is covering the ground rather than what a parcel is legally permitted to be used for.
Table of Contents
From Sacramento Valley farms to a forested eastern upland
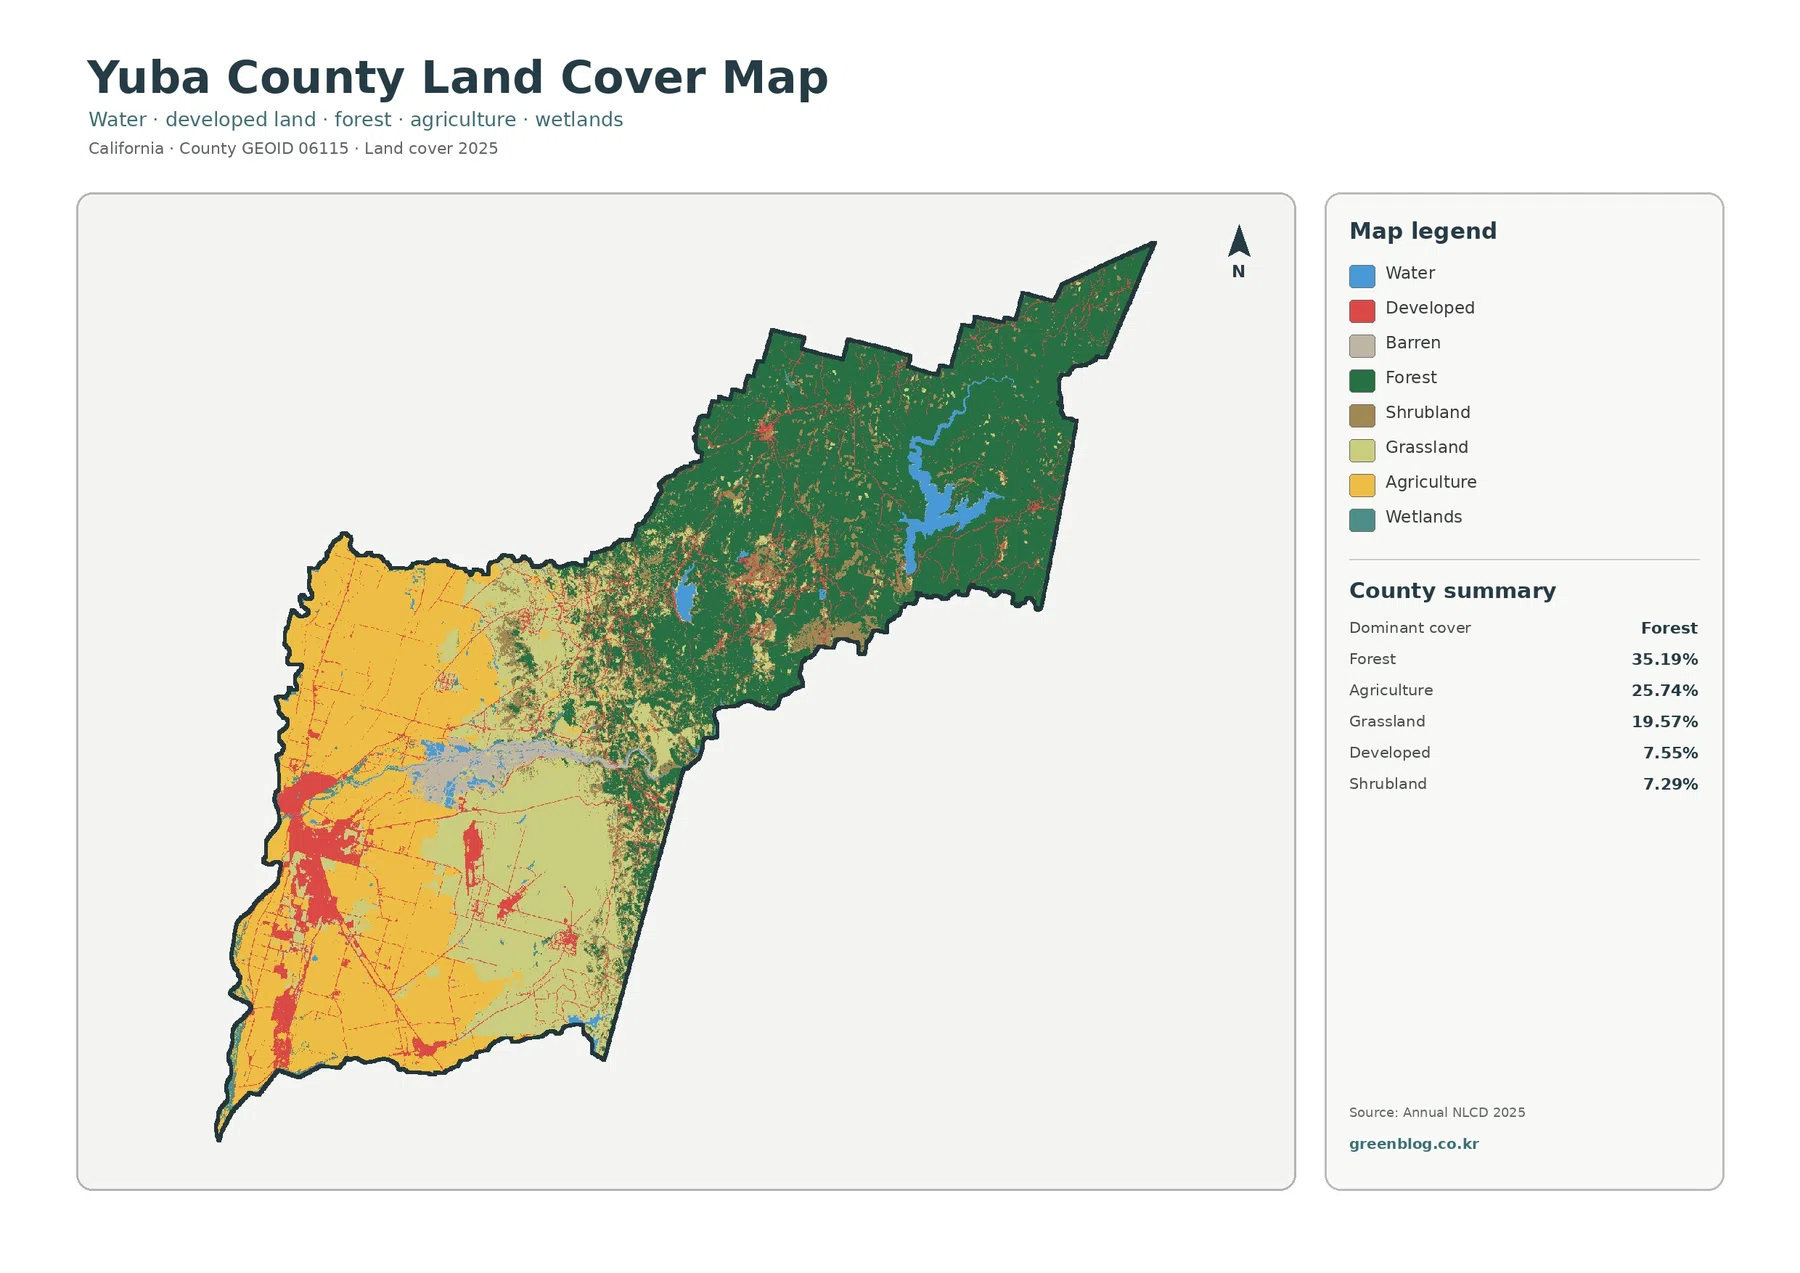
The countywide numbers establish the broad balance. Forest covers 35.19%, agriculture 25.74%, grassland 19.57%, developed land 7.55%, and shrubland 7.29%. The forest-and-farmland view also lists water at 2.14% and wetlands at 0.89%. Barren land appears in the legend, but no exact county percentage is supplied in the summary, so it is better not to infer a value from the remaining total.
Those percentages become more meaningful once their locations are considered. Agricultural colors dominate the western plain and reach across much of the northwestern and southwestern lowland. Developed land forms concentrated patches near Marysville and the communities south of it. Moving east, the map becomes more mixed: grassland and shrubland appear across the transition into the foothills, and forest then takes over across a large share of the eastern and northeastern county.
Yuba County’s own hazard-planning material describes a similar physical division. It notes that roughly half of the planning area occupies Sierra Nevada mountainous uplands and foothills, while the western half lies in the Sacramento Valley, where irrigated field crops and orchards are prominent outside urban and suburban areas. That document is not the source of the NLCD percentages, but it provides useful geographic context for the strong east-west contrast visible on the map.
| 2025 class | County share |
|---|---|
| Forest | 35.19% |
| Agriculture | 25.74% |
| Grassland | 19.57% |
| Developed | 7.55% |
| Shrubland | 7.29% |
| Water | 2.14% |
| Wetlands | 0.89% |
The map therefore works best as a picture of several connected landscapes rather than a single dominant setting. Forest has the largest individual percentage, yet the western agricultural plain is visually extensive and contains most of the larger developed patches. Grassland and shrubland matter because they occupy much of the middle ground between these two ends of the county. That transition is one of the features that would be lost if the map were summarized only with a list of percentages.
Built surfaces stay concentrated in the western population centers
Fractional impervious surface measures how much of the ground is covered by materials such as pavement and rooftops that do not readily absorb water. Yuba County’s mean impervious value is 2.01%, while areas at or above 50% impervious account for 1.41% of the county. The developed land-cover class is larger, at 7.55%, because a developed pixel can include lawns, soil, trees, and other surfaces that are not themselves impervious.
The strongest impervious concentrations sit along the county’s western side. Marysville forms the clearest cluster near the Feather and Yuba rivers, with additional developed surface extending through Linda and Olivehurst and farther south toward Plumas Lake. Smaller high-value patches and narrow lines mark roads or isolated facilities, while the eastern forested country remains overwhelmingly pale on this map.
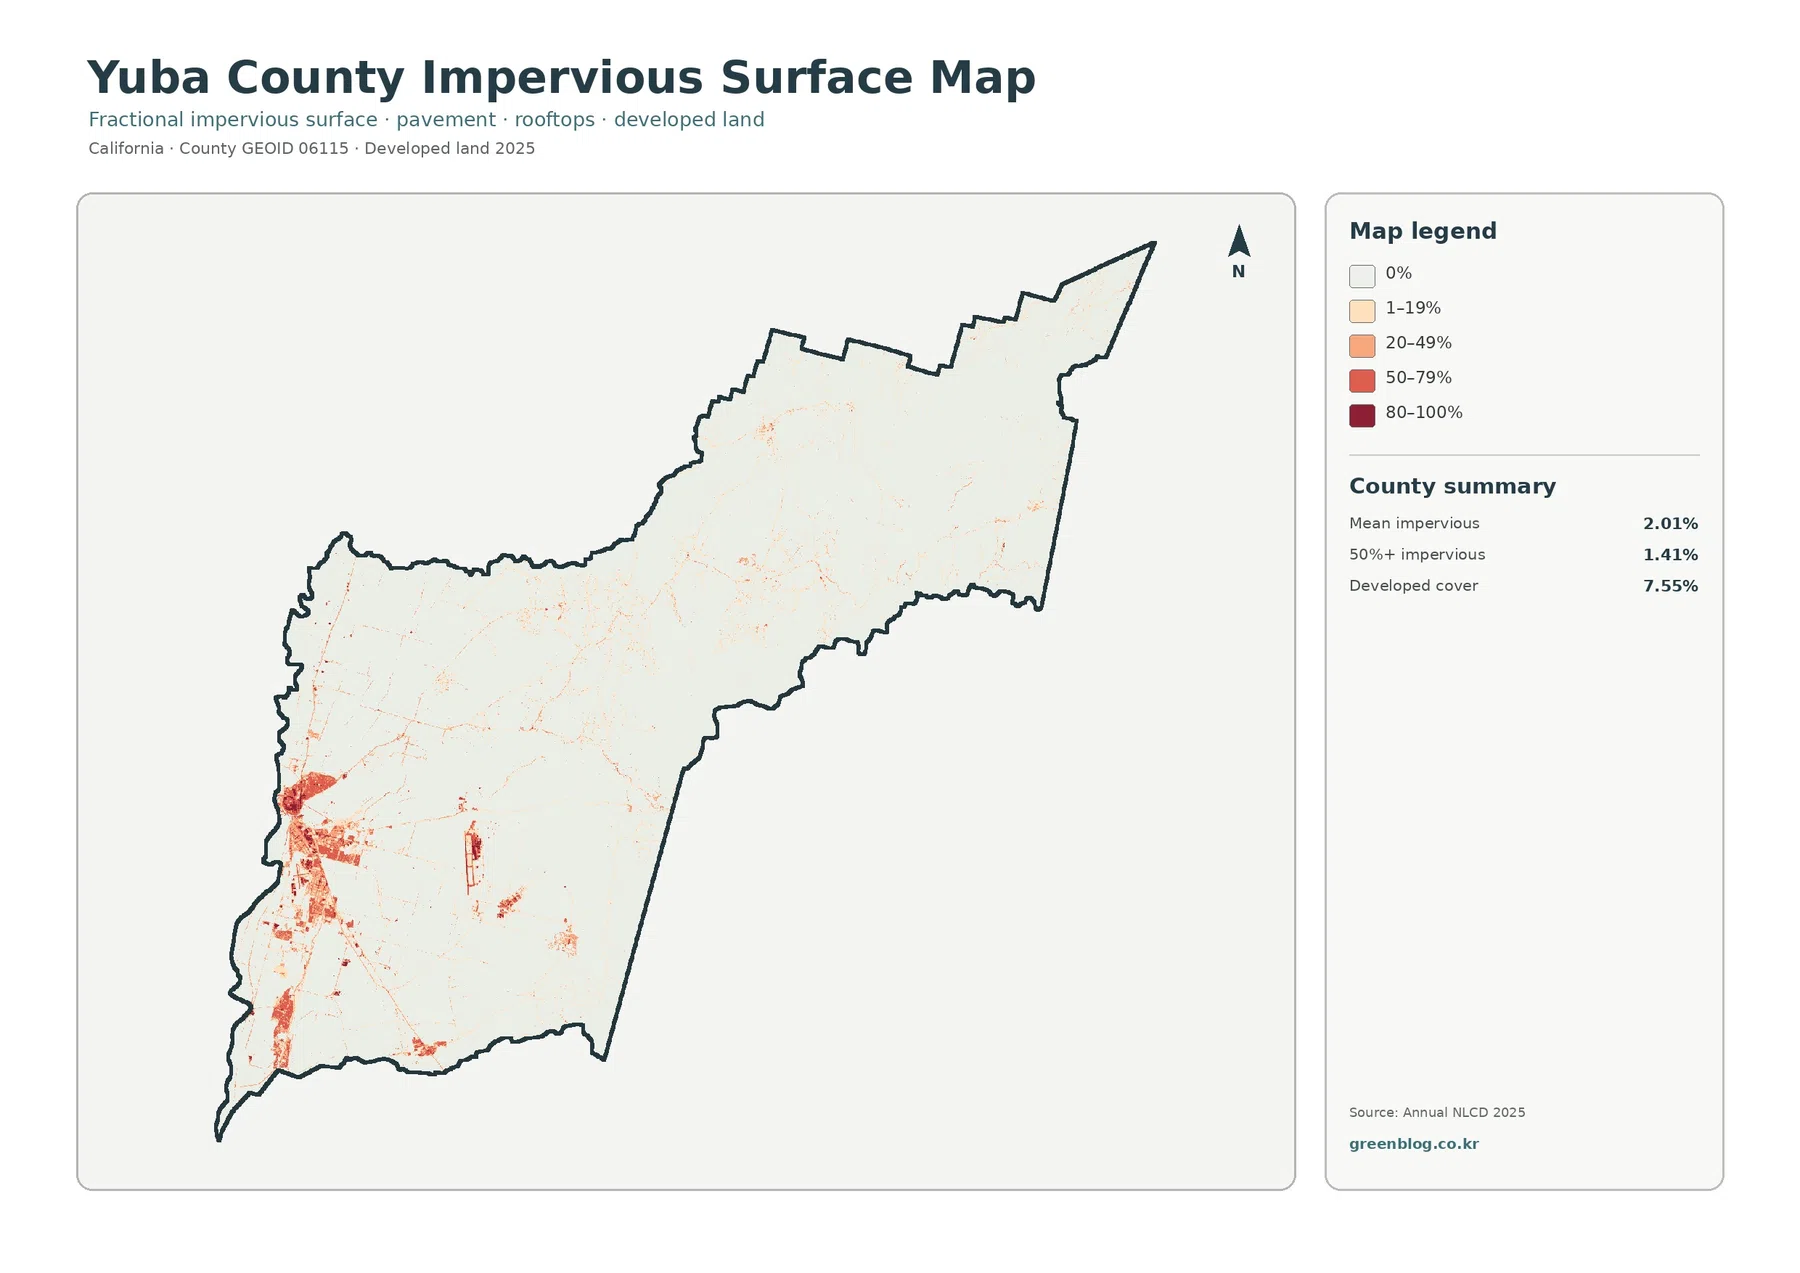
The county’s official overview places Marysville at the center of the local community network and names Linda, Olivehurst, Arboga, Plumas Lake, and Wheatland among nearby communities. It also notes that Beale Air Force Base is located just outside Wheatland. These named places help orient the otherwise unlabeled surface map: the dense western and southwestern patches represent a very different land-cover setting from the forested east.
This layer is useful for comparing built intensity at county scale, but it should not be treated as a drainage or flood-risk map. Impervious cover is only one factor in runoff. Elevation, levees, channels, soils, drainage infrastructure, and storm conditions also matter. A high percentage indicates a hard-surface concentration, not a conclusion about what will flood or how a particular parcel drains.
The forest-and-farmland view clarifies the county’s working landscape
When the classes are regrouped for the forest-and-farmland map, the western valley floor becomes especially easy to interpret. Cropland occupies broad blocks across the lowlands, while forest is concentrated to the east. Pasture or hay and shrub/grass classes fill much of the ground between those two settings. The simplified colors make the county’s transition from intensive agriculture to open foothill vegetation and then forest easier to explain than the full land-cover legend does.
Agriculture is not just a visible map class here. Yuba County’s official county overview calls agriculture a cornerstone of the local economy and specifically points to District 10 in the northern part of the county as an area where farms and agricultural businesses are important. The county Agricultural Commissioner also publishes crop reports for current agricultural information. Those sources add local context without turning the 25.74% NLCD agriculture value into a legal farmland boundary.
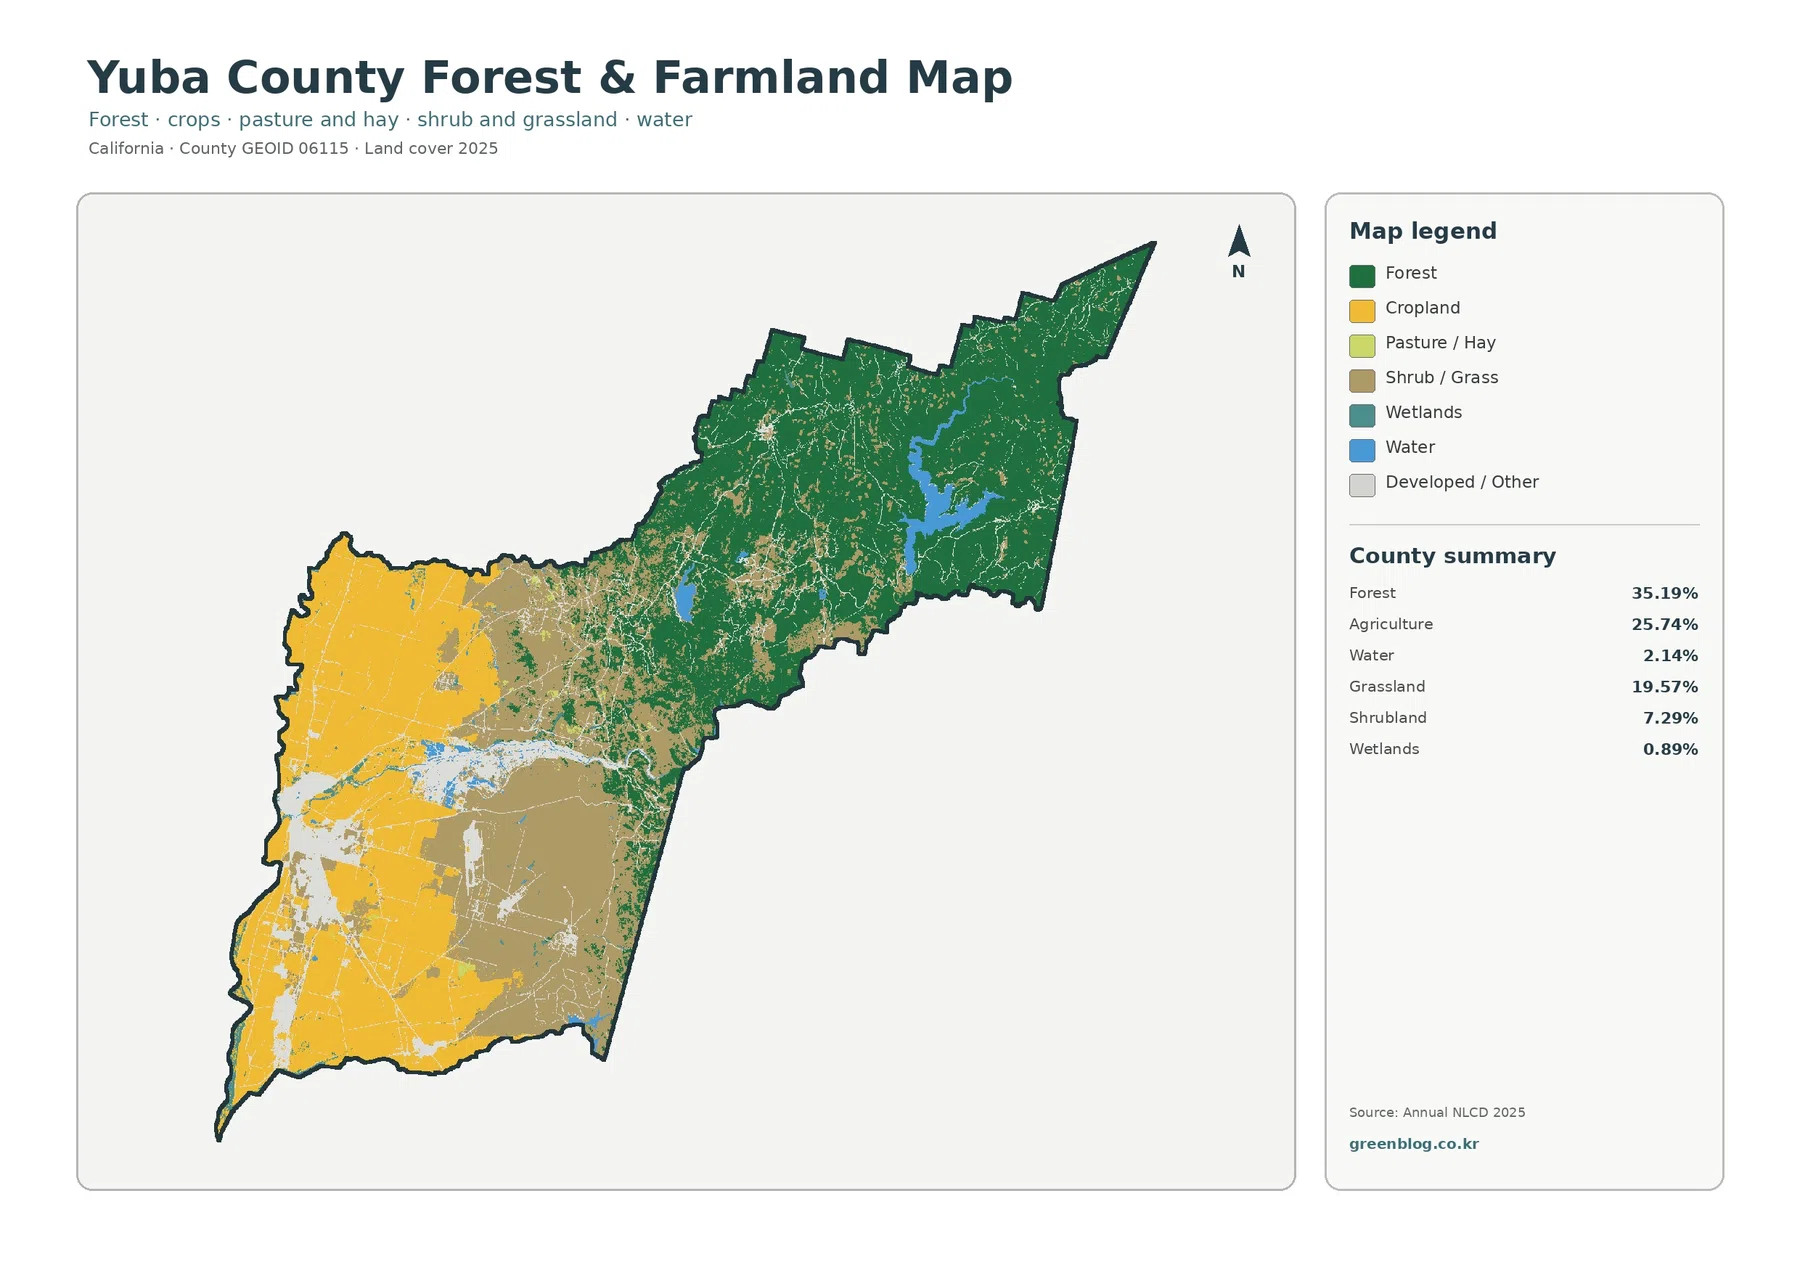
The middle of the county deserves attention because it is not simply a line dividing farms from forest. It contains a mixture of grassland, shrubland, smaller agricultural patches, and forest edges. This is where a statewide or national map viewed at small scale can look more complicated than a simple two-color summary. For a class presentation, the full land-cover map can show that complexity first, followed by the forest-and-farmland version to emphasize the two broad end members.
Forest’s 35.19% share should likewise be interpreted as a mapped surface class, not a count of every tree. Narrow riparian tree strips, mixed vegetation, and small wooded patches may be generalized into a neighboring class when the map is viewed as 30-meter raster cells. The value tells us that broad forest cover is a major part of eastern Yuba County; it does not substitute for a forest inventory or parcel-level vegetation survey.
Rivers add another layer to the farm-and-city pattern
Water accounts for 2.14% of the county summary and wetlands for 0.89%. These are small percentages compared with forest or agriculture, yet their locations make them important on the map. Yuba County planning documents identify the Feather River along much of the western boundary, the Bear River along the southern boundary, and the Yuba River as a major part of the county’s drainage and boundary geography. Around Marysville, the Yuba and Feather rivers also provide a clear geographic reference for the western developed area.
Water appears in more than one setting. In the west it lies beside agricultural and developed land, while in the eastern uplands it is surrounded mainly by forest and open natural cover. Wetland colors are more limited and should be interpreted at the map’s scale. A mapped wetland class is not a regulatory wetland determination, and a small countywide percentage does not mean that individual river corridors or low-lying sites lack ecological importance.
For watershed or environmental education, this combination is useful because the same county contains urban river edges, agricultural lowlands, foothill vegetation, and forested headwater country. The land-cover map can show where those settings meet. Detailed water management, levee analysis, habitat boundaries, or permit decisions require specialized sources beyond this generalized land-cover product.
What the 1985–2025 class-difference map can and cannot prove
The long-term comparison marks places where the 1985 and 2025 classifications differ. The county summary reports class differences across 16.03% of the mapped area. Of that total, 2.65% is listed as classified to developed, 2.73% as forest loss, 0.78% as agricultural loss, and 9.56% as other class difference. A wetland-difference category appears in the legend, but the summary does not provide an exact percentage for it, so no separate value is assumed here.
Developed differences are most conspicuous around the western population centers, where the current map also contains the densest developed and impervious surfaces. Across the valley, smaller patches of agricultural loss and other differences are scattered among large areas with no class difference. In the foothills and forested east, forest-loss and other-difference colors become more visible, producing a much more varied pattern than a simple urban-expansion map would show.
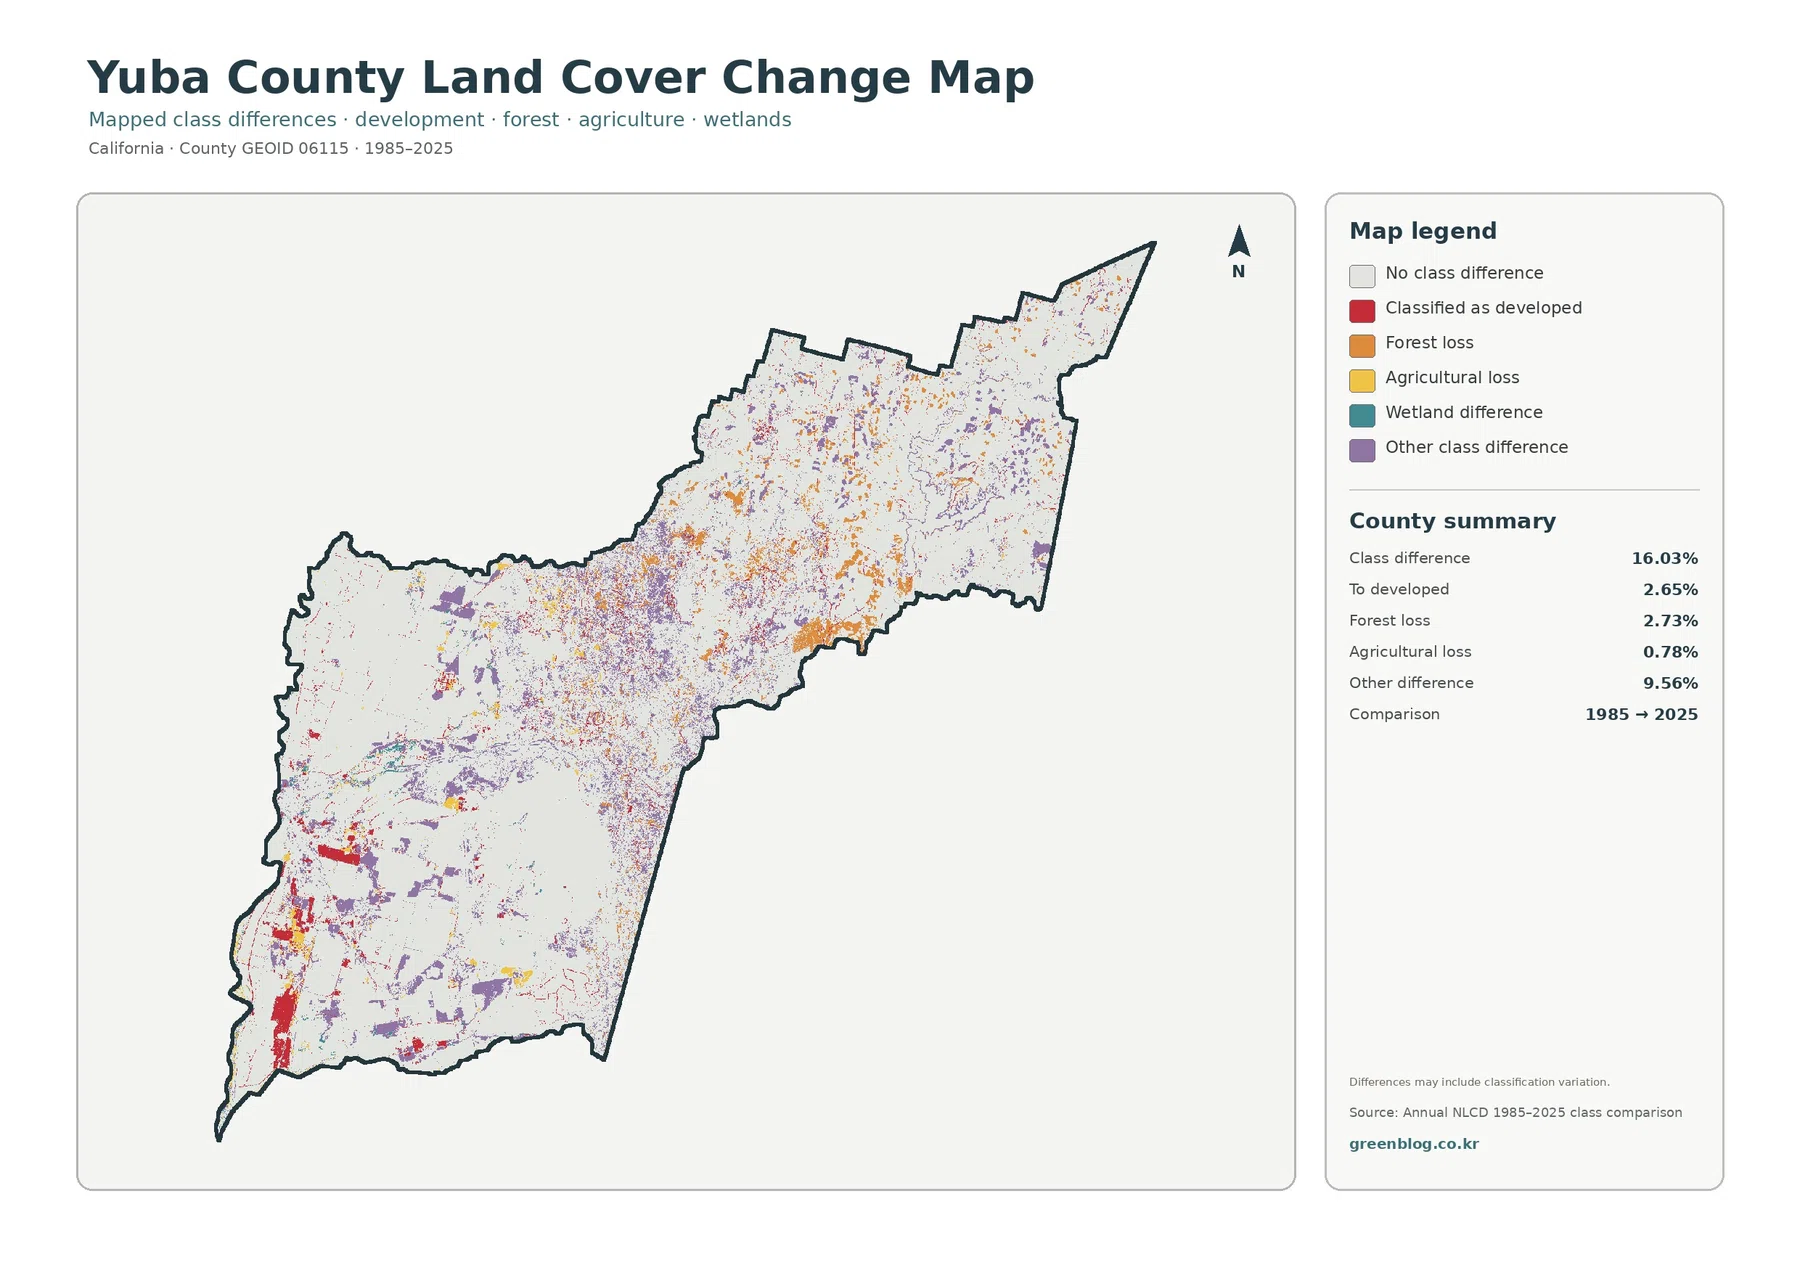
The word “difference” matters. The map itself warns that classification variation may be included. A different class can reflect real land-cover change, but it can also be affected by imagery conditions, vegetation state, seasonal timing, model behavior, or uncertainty at class boundaries. For that reason, the 16.03% value should not be quoted as a measured countywide land conversion rate.
The relatively large 9.56% “other difference” share is another reason to avoid an overly simple interpretation. It combines changes that are not placed into the few highlighted categories in the summary. Treating all of that area as development, deforestation, or agricultural decline would go beyond what the supplied map says. A site-specific claim should be checked against historic aerial imagery, planning records, fire history, timber records, restoration information, or other dated evidence.
Used carefully, the comparison is still valuable. It can identify places worth investigating, help students compare two time points, or provide a visual starting point for a local change study. Pairing it with the 2025 land-cover map is especially useful because one layer shows the current class while the other shows whether the earlier classification matched it.
Choosing the most useful map for a project
For a quick county overview, start with the complete land-cover map. It gives the clearest picture of the west-to-east transition and preserves water, wetlands, developed land, agriculture, grassland, shrubland, and forest in one view. If the main question is how the working valley relates to the wooded uplands, the forest-and-farmland map removes some of the visual complexity and makes that contrast easier to present.
The impervious layer is better when the subject is settlement or hard-surface concentration. It makes the Marysville–Linda–Olivehurst area stand out immediately while showing how little impervious cover occurs through most of the eastern county. For a historical comparison, use the 1985–2025 map beside a current map rather than by itself. That pairing reduces the chance that a class-difference color will be mistaken for a present-day land-cover class.
These maps can also support classroom work, county-scale environmental context, presentation graphics, watershed introductions, and broad planning background. They are not substitutes for zoning maps, parcel records, surveyed boundaries, flood studies, habitat delineations, or engineering data. Matching the map to the question is more useful than trying to make one layer answer every land-related question.
Yuba County JPG map files
The download contains four original JPG files: land cover, forest and farmland, impervious/developed land, and land-cover change. Each image is 2480×1754 pixels and is kept at the supplied source size. The asset manifest does not mark these files as meeting the package’s A3 high-resolution reference, so the safest approach is to judge print use from the actual pixel dimensions rather than assuming an A3 specification.
Scale, raster cells, and interpretation limits
Annual NLCD Collection 1.2 extends the annual product record through 2025 and is processed at 30-meter spatial resolution. Raster data divide the landscape into grid cells, with each cell carrying a mapped class or value. That design is well suited to countywide patterns, but it generalizes narrow features and mixed ground cover. A road, field edge, tree strip, and yard can all fall within the same local area while the displayed classification remains much simpler.
This matters most near boundaries between classes. Around western towns, agriculture can meet developed land within a short distance. Along rivers, water, wetlands, trees, and fields may occur in narrow bands. In the foothills, grass, shrubs, and forest can mix across slopes. The map can show the dominant county-scale pattern without tracing every real-world edge exactly.
The date is another limitation. A 2025 classification cannot include development, vegetation change, wildfire effects, agricultural shifts, restoration, or flooding that happened afterward. When current conditions are important, use this map as background and check newer imagery or county records. When legal boundaries matter, use the appropriate parcel, zoning, survey, or regulatory dataset instead.
Frequently Asked Questions
Why does forest rank first even though the western valley looks heavily farmed?
Forest covers 35.19% of the county and occupies a very large area across the eastern uplands. Agriculture covers 25.74% and is concentrated mainly on the western valley floor. The two classes therefore dominate different parts of Yuba County rather than competing for the same space everywhere.
What is the difference between 7.55% developed land and 2.01% mean impervious surface?
Developed land is a land-cover category that can include both hard and permeable surfaces. Mean impervious surface specifically measures the share represented by pavement, rooftops, and similar hard materials. Lawns, trees, bare soil, and other permeable cover within developed areas help explain why the two percentages are different.
Does the 16.03% class difference mean that 16.03% of Yuba County was physically converted?
No. It means the 1985 and 2025 mapped classes differ across 16.03% of the comparison area. Real change may be part of that total, but classification variation can also contribute. A claim about a specific physical conversion should be checked with additional dated evidence.
Map File Information
Download the four original Yuba County land-cover JPG maps together in one ZIP file.
- Printable Size: 2480×1754 pixels each
- File Type: ZIP containing 4 JPG files
Related Maps
- Alameda County California Land Cover Map
- Alpine County California Land Cover Map
- Amador County California Land Cover Map
Sources and further reading
Percentages and spatial descriptions in this article follow the supplied Yuba County 2025 land-cover maps and the 1985–2025 class-difference map. The sources below provide official context for Annual NLCD and for Yuba County’s geography and agriculture.
- MRLC Annual NLCD – Annual NLCD products and the 1985–2025 data record
- USGS Annual NLCD Collection 1.2 Land Cover – product resolution, raster format, and classification information
- Yuba County – About Our County – Marysville, nearby communities, District 10 agriculture, and county overview
- Yuba County Crop Reports – official county crop-report access
- Yuba County Local Hazard Mitigation Plan – Risk Assessment – Sacramento Valley, Sierra Nevada foothills, rivers, and land-use context
Green Map creates custom-edited map images using open geographic data sources such as geoBoundaries, Natural Earth, OpenStreetMap, and government open data.
These maps are edited visual materials, not raw data files, and are provided for education, documents, presentations, and graphic reference.