Lincoln County’s 2025 land-cover pattern is easiest to understand as a contrast rather than a single dominant landscape. Agriculture accounts for 49.24% of the county and spreads broadly across the east and northeast, while forest at 20.85% and wetlands at 19.12% are much more prominent across the west and southwest. The four maps on this page let you compare that split, isolate forest and farmland, locate impervious surfaces, and see where the 1985 and 2025 classifications differ.
The WebP images in the article are quick previews. A single download farther down the page contains all four original JPG maps: general land cover, forest and farmland, impervious/developed land, and the 1985–2025 change comparison. Using the maps together is especially helpful in Lincoln County because broad agricultural areas, wooded land, wetlands, river-edge features, and small developed centers do not follow the same pattern across the county.
Table of Contents
Bayou Bartholomew helps explain why the county looks different from east to west
Lincoln County is in southeastern Arkansas, with the Arkansas River along its northeastern side. A trusted Arkansas reference describes Bayou Bartholomew as crossing the county from northwest to southeast and separating the Mississippi Alluvial Plain on the east from the Coastal Plain on the west. The land-cover maps do not prove that this physical division caused every mapped pattern, but the broad east-west contrast is clear: agriculture occupies much more continuous ground to the east, while forest and wetlands break up the landscape more strongly to the west.
This distinction matters because a countywide percentage can hide where each class actually occurs. Agriculture is the largest category overall, yet it does not cover Lincoln County evenly. The northeastern extension and much of the eastern half are strongly agricultural, with wetlands and water threading through the fields. West of the county’s central drainage features, forest becomes more extensive and farm fields tend to appear as smaller openings among woods and wet areas.
Wetlands are also too important to treat as a minor background class. At 19.12%, they nearly equal the county’s forest share. Teal areas follow winding drainage features, collect around the northern and northeastern river edge, and appear repeatedly among the forests and farms of the western half. The map therefore presents Lincoln County as a place where agriculture and water-related cover are closely interspersed even though farmland remains the largest single category.
Start with the forest-and-farmland map to see the county’s strongest visual split
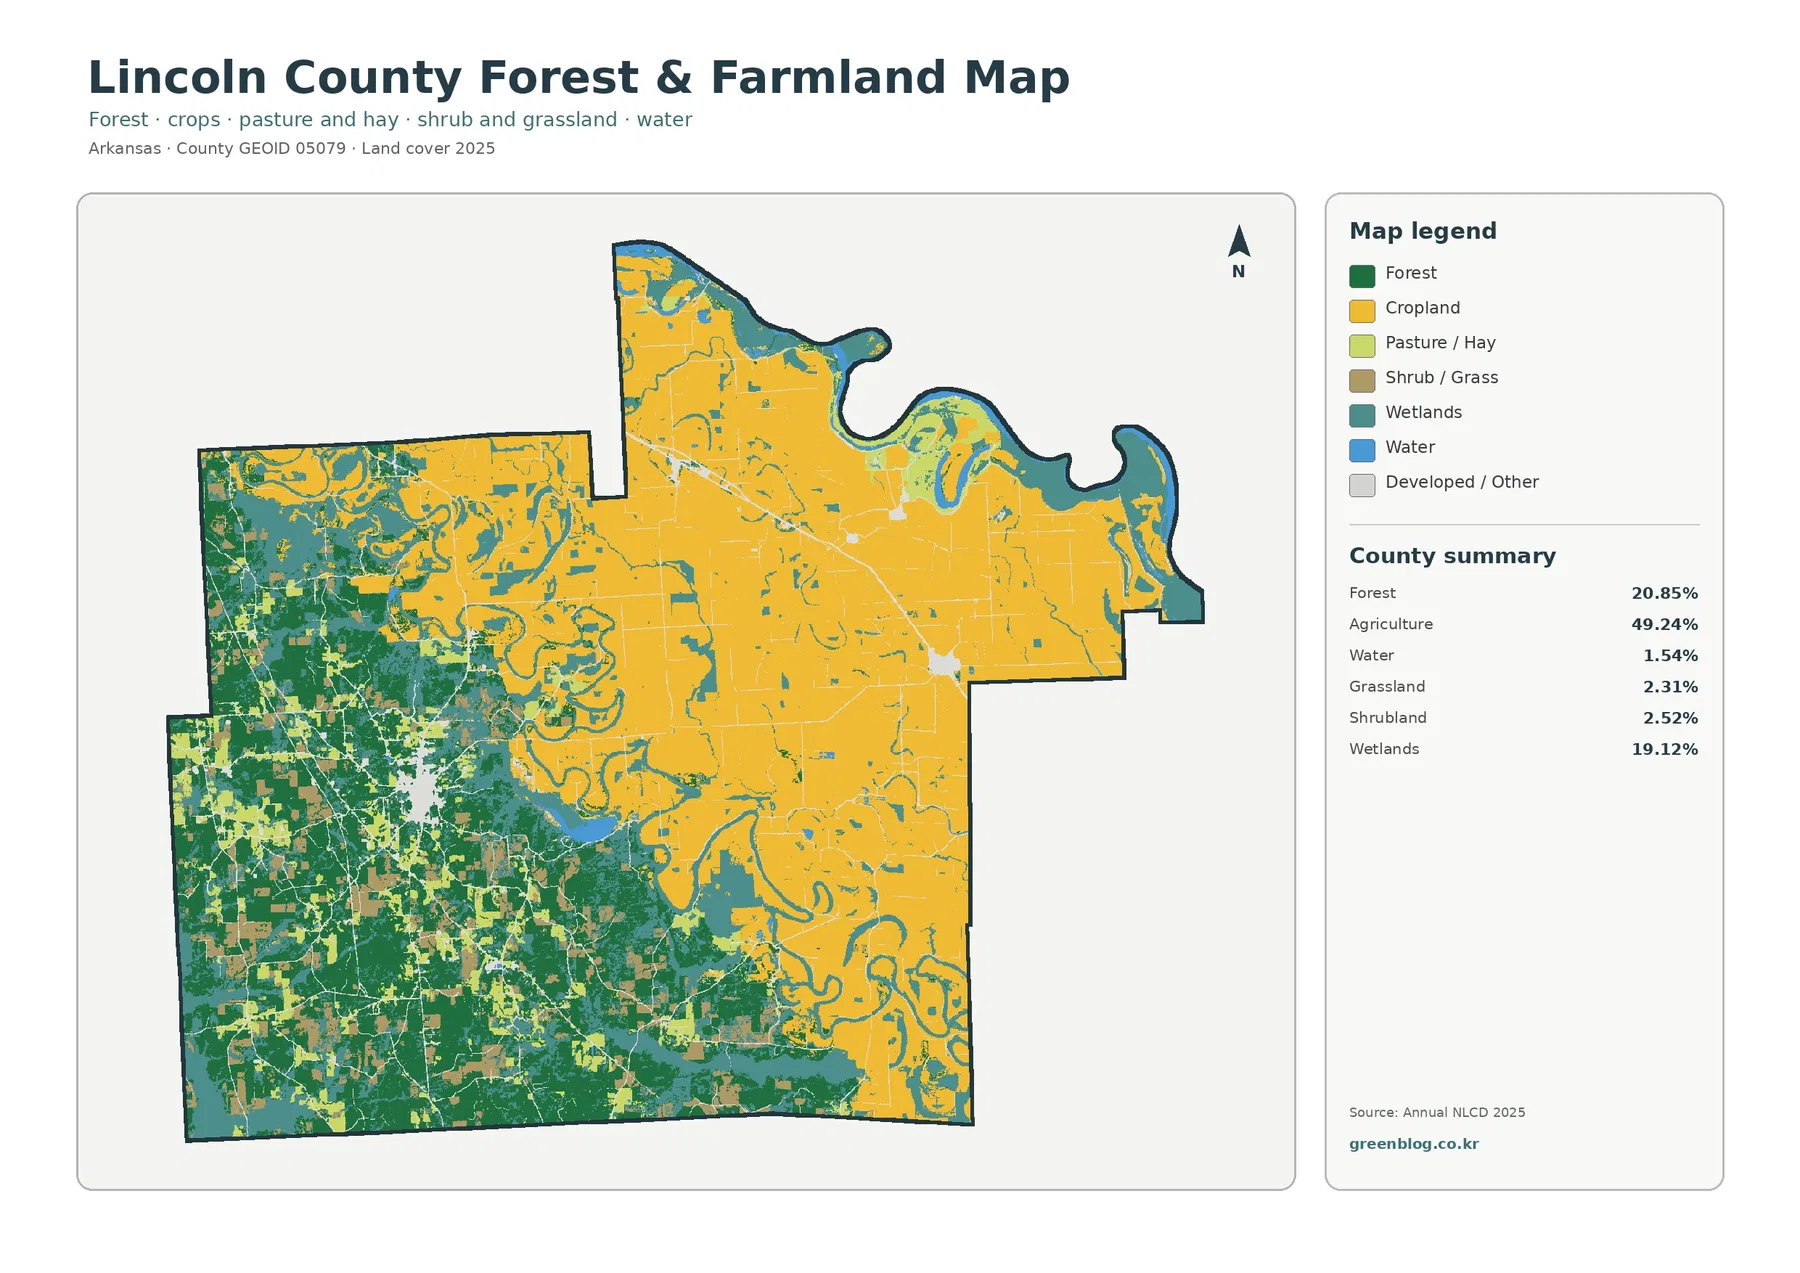
The forest-and-farmland view removes much of the visual competition from developed classes and makes the county’s two major landscape groups easier to follow. Agriculture remains 49.24%, forest is 20.85%, and wetlands are 19.12%. The same summary also lists water at 1.54%, grassland at 2.31%, and shrubland at 2.52%. Together, these categories show that almost half of the county is agricultural while a substantial share remains wooded or wet.
Yellow agricultural areas dominate the east and the northern projection. They are interrupted by narrow wetland features and waterways, but the fields remain visually broad and connected. In the west and southwest, the pattern reverses. Dark green forest occupies much larger areas, and agricultural fields appear as smaller blocks inside or beside wooded land. Wetlands wind through both groups rather than staying confined to one edge of the county.
The location of Bayou Bartholomew is useful context for reading this transition. The bayou runs across Lincoln County from northwest to southeast, and the land-cover colors become more mixed through that part of the map. This does not mean every boundary between forest and farmland follows the bayou exactly. It does mean the county’s known physical division offers a sensible geographic reference when comparing the broader eastern agricultural area with the more wooded western side.
These colors should not be interpreted as property use or ownership. A pixel classified as agriculture does not identify the crop, farm operator, or zoning designation. Forest does not mean public forest, protected land, or a particular tree type. The map is a surface-cover classification. Lincoln County’s Cooperative Extension office provides local agriculture and natural-resource information, but that source should be used as background rather than as evidence for the identity of any individual mapped field or forest patch.
The general 2025 map adds developed land, shrub cover, and the full wetland pattern
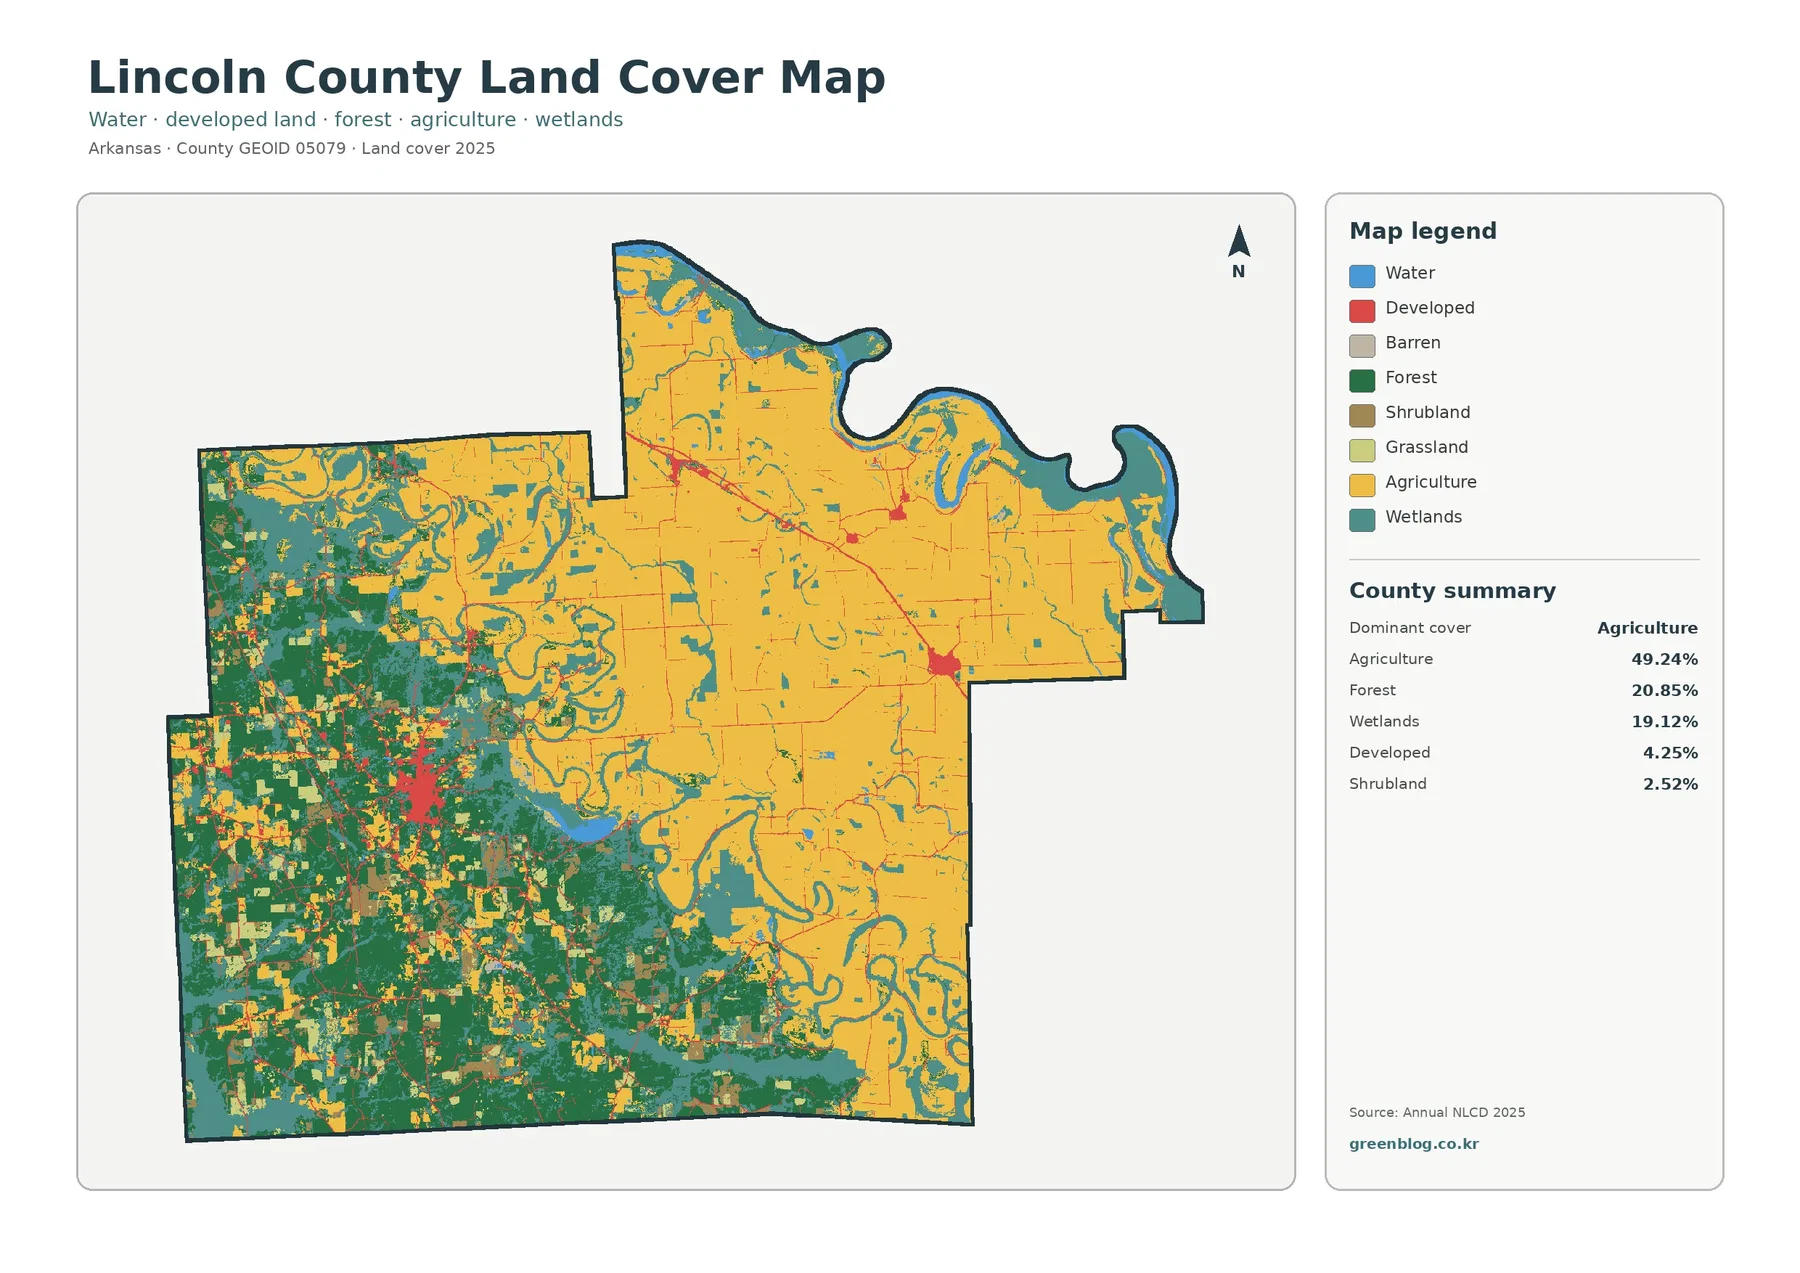
The general map restores the complete set of displayed land-cover groups. Its county summary identifies agriculture at 49.24%, forest at 20.85%, wetlands at 19.12%, developed land at 4.25%, and shrubland at 2.52%. Water, barren land, and grassland are also represented in the legend, although not every class receives a separate percentage in this particular summary panel. It is better to use the reported values as given than to invent missing percentages from visual estimates.
Developed land is limited in area but easy to notice because red features contrast strongly with the surrounding farm and forest colors. The largest cluster appears around the Star City area in the western-central part of the county. Thinner developed traces extend along travel routes, and smaller settlement areas appear elsewhere. Star City is the county seat, and the University of Arkansas System Extension maintains its Lincoln County office there, providing a useful verified local reference without requiring the map itself to label every town.
The northeastern side is shaped by the Arkansas River boundary and a complex set of nearby wet areas. Even within the large agricultural zone, teal wetland features and blue water interrupt the fields. Moving southwest, green forest becomes much more common, but agriculture never disappears. The result is a gradual change in the balance of classes rather than a single sharp dividing line drawn across the county.
Shrubland accounts for 2.52%, a much smaller share than agriculture, forest, or wetlands. It appears in scattered patches rather than defining a large region. Grassland is more clearly summarized on the forest-and-farmland version at 2.31%. Those small classes can matter locally, but the main countywide story remains the relationship among farmland, forest, wetlands, water, and the limited developed footprint.
A 0.84% mean impervious value separates paved surfaces from the broader developed class
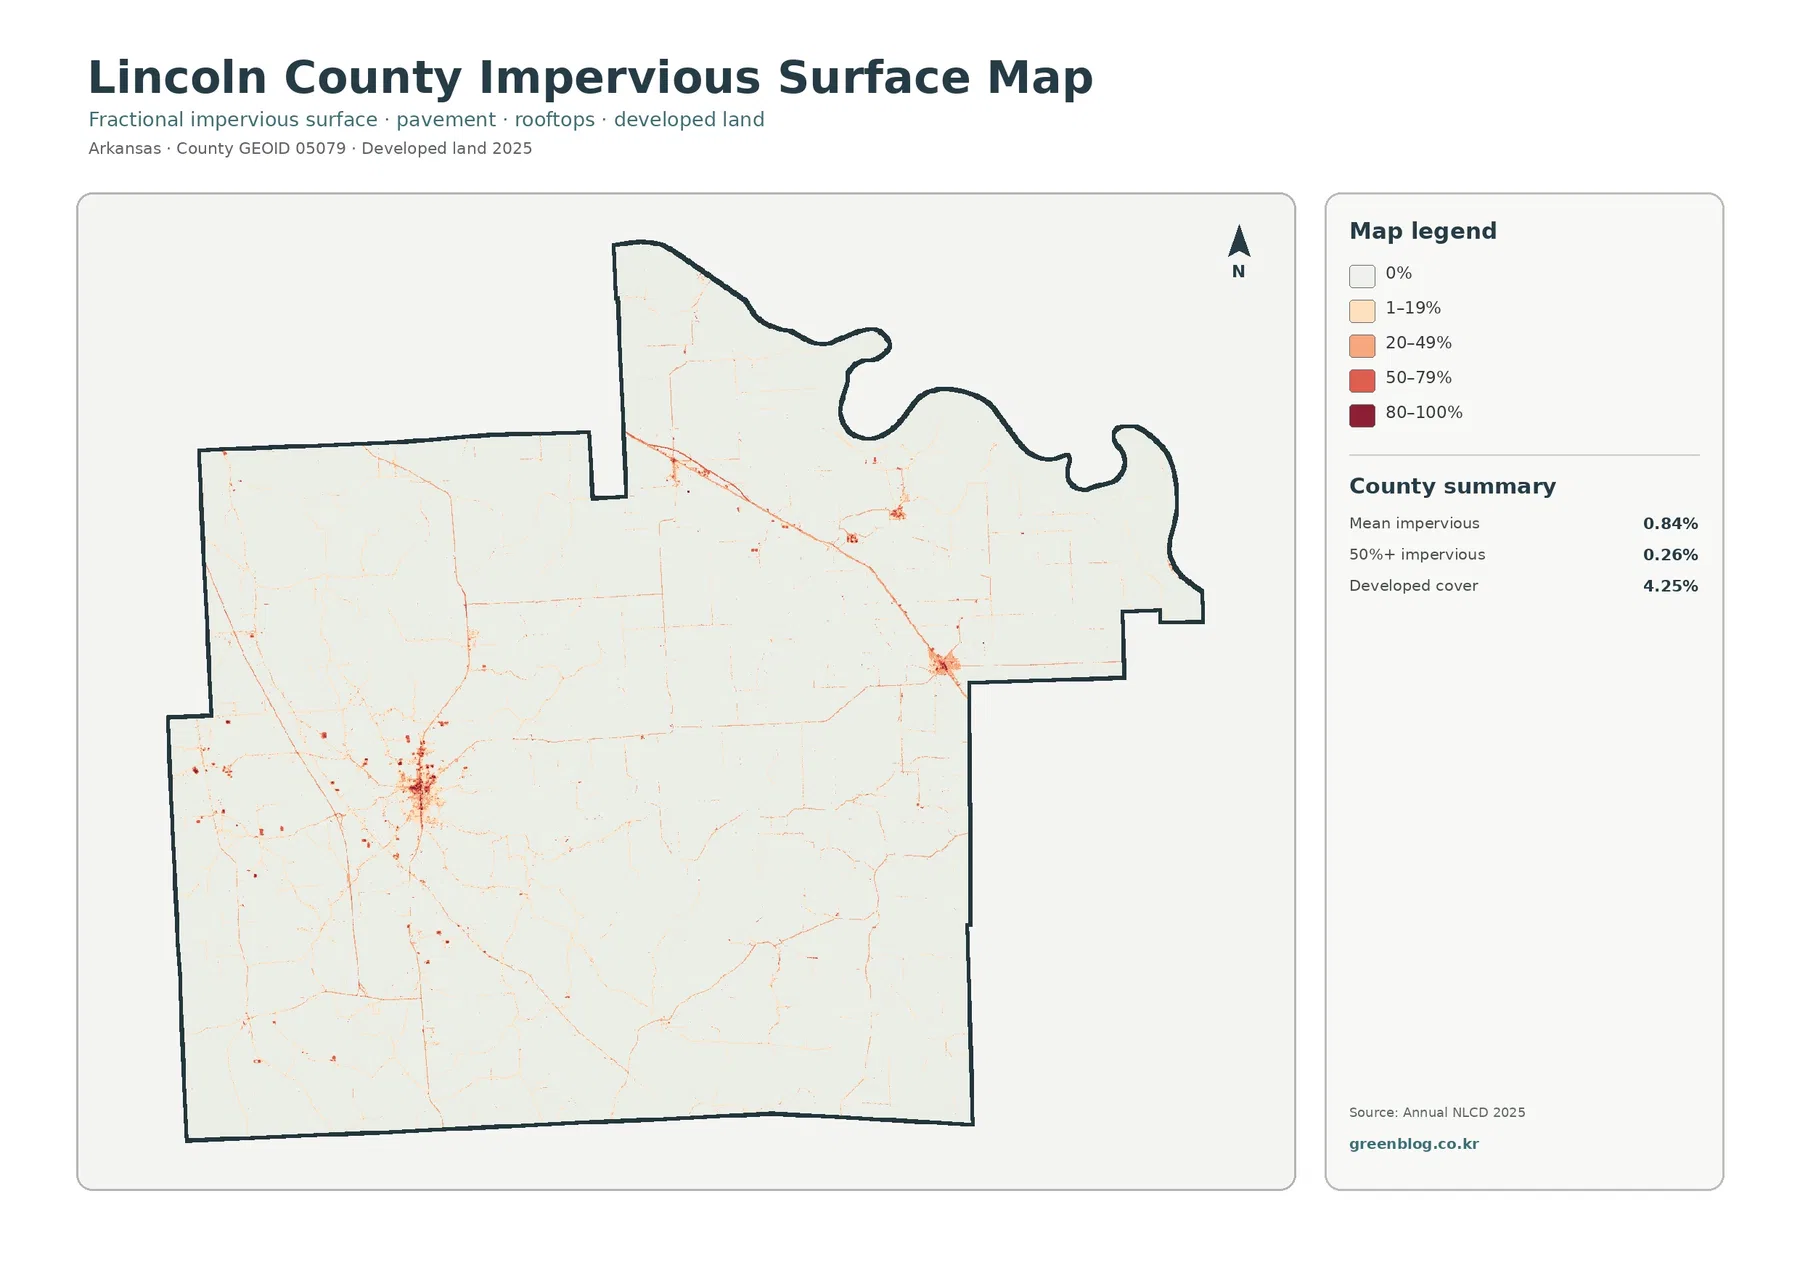
Developed land covers 4.25% of Lincoln County, but the mean impervious value is only 0.84%, with 0.26% of the county mapped at 50% or greater imperviousness. Those numbers describe different things. A developed land-cover class can include lawns, trees, bare soil, drainage strips, and other surfaces that still absorb water. The impervious map focuses more specifically on rooftops, pavement, parking areas, and similar surfaces.
The strongest impervious cluster is in the Star City area, where darker orange and red cells are surrounded by a larger field of low values. From there, narrow traces follow roads through rural parts of the county. A smaller developed concentration appears farther east, but most agricultural and forested areas remain very pale on this map. That visual pattern fits the low countywide mean better than the 4.25% developed-cover figure would by itself.
A low county average should not be used to describe every neighborhood. A small town center can contain much more pavement and roof area than surrounding farmland while still contributing little to the countywide mean. Conversely, a red line along a road does not mean the adjacent fields are heavily developed. The fractional display is useful because it separates concentrated hard surfaces from the much larger rural setting.
This is not a flood-risk map. Impervious surfaces can affect runoff, but actual flooding depends on rainfall, elevation, soil, drainage infrastructure, river levels, and other conditions. The Arkansas River and the county’s extensive wetlands make water an important part of the landscape, yet the impervious layer alone cannot tell a reader where flooding will occur or whether a specific property is safe.
The 1985–2025 comparison concentrates many class differences in the wooded west
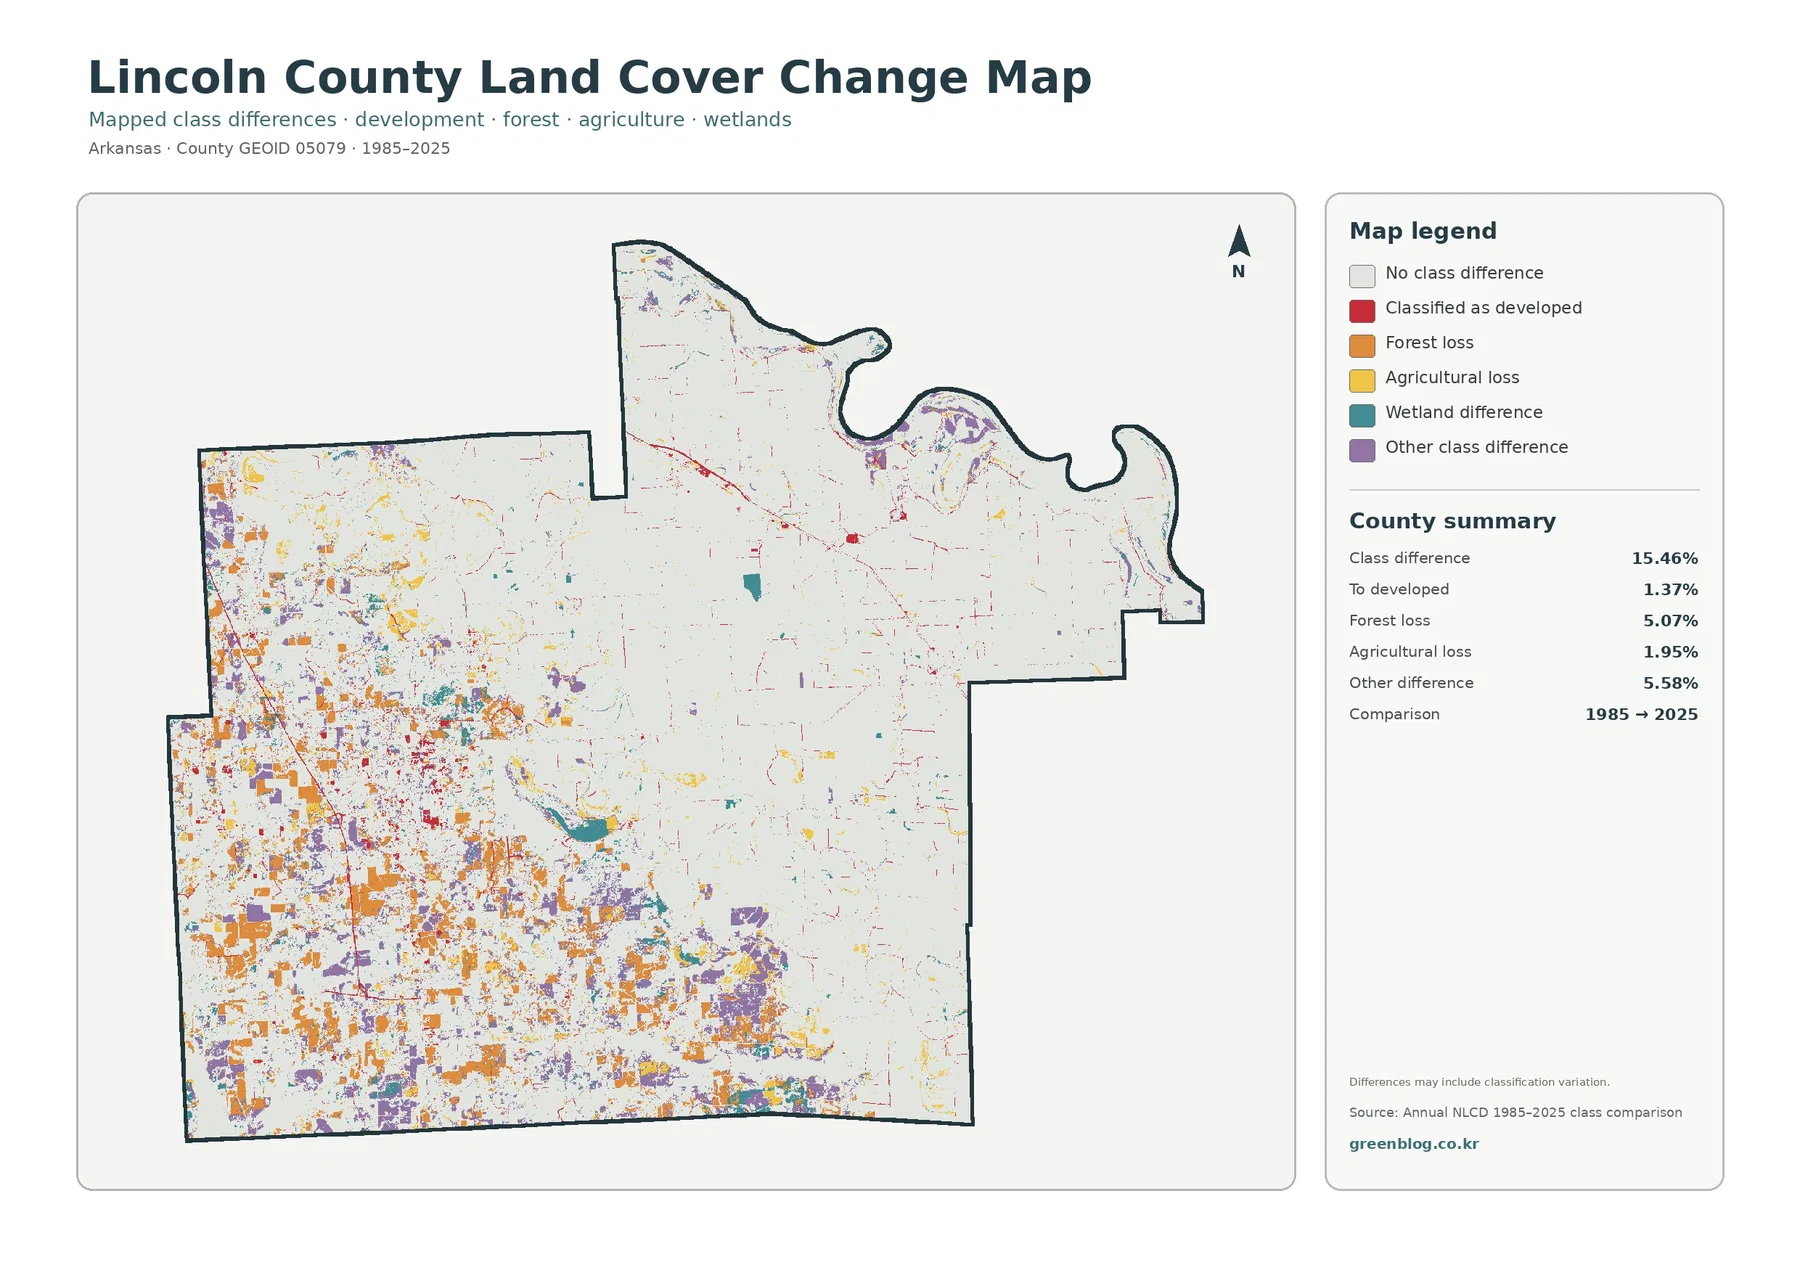
The change map reports a total class difference of 15.46%. That figure means 15.46% of the county is assigned a different mapped class in the 1985 and 2025 comparison. It should not be described as a 15.46% development rate or as proof that the same amount of land was permanently transformed. The summary separately reports 1.37% classified to developed, 5.07% forest loss, 1.95% agricultural loss, and 5.58% other class difference.
Orange forest-loss patches and purple other-difference areas are especially noticeable across the west and southwest, where the current map still contains substantial forest. Red developed-change marks appear around settlement areas and along road corridors, while scattered agricultural-loss marks occur in several parts of the county. The broad eastern agricultural area has many places with no mapped class difference, although it is not completely unchanged.
Wetland difference is shown as its own legend category, but the supplied county summary does not provide a separate exact percentage for it. Subtracting the listed values from 15.46% and labeling the remainder as wetland change would create a statistic that the package does not actually report. The safer approach is to describe where the wetland-difference color appears and keep the exact percentages limited to the values printed on the map.
The map itself warns that differences may include classification variation. Annual land-cover products are based on raster cells, and a cell can contain more than one real-world surface. Image conditions, class definitions, mixed cells, and mapping methods can affect the comparison in addition to genuine landscape change. A reader investigating one field, forest tract, or wetland should compare intermediate imagery and local records before assigning a cause to a colored change patch.
Useful map pairs for agriculture, water, development, and long-term comparison
For an agriculture-focused question, the general map and the forest-and-farmland map make the best pair. The general view shows developed land and the full class palette, while the simplified map makes it easier to follow the broad eastern cropland and the smaller western agricultural openings. Wetlands remain visible in both, which is important in Lincoln County because they occupy 19.12% of the mapped area and often sit directly beside farm or forest cover.
For a settlement or transportation question, compare the general map with the impervious-surface map. A red developed area on the first map may contain a mix of buildings, roads, vegetation, and open ground. The second map reveals which parts have higher fractions of pavement and rooftops. Around Star City, that comparison makes the difference between a broad developed classification and concentrated hard surfaces much easier to see.
For long-term study, place the 2025 general map next to the 1985–2025 change map. Current forest in the west can be compared with the areas marked as forest loss, while the large agricultural zone in the east can be checked against agricultural-loss and other-difference patches. The two maps answer different questions: one describes the present classification, and the other highlights where the start and end classifications do not match.
These pairings also work well for classroom graphics and presentations because they reduce the temptation to treat one map as a complete description of the county. A reader can begin with a broad landscape question, choose the second layer that addresses it, and then consult the source data if exact location or time detail is needed. That approach is more useful than reading all four legends as if every category carried the same meaning.
Download the four original Lincoln County JPG maps
The download ZIP contains four separate JPG files: the 2025 land-cover map, the forest-and-farmland map, the impervious/developed-land map, and the 1985–2025 land-cover change map. The asset manifest lists each original JPG at 2480×1754 pixels. The 1800×1273 WebP files used in the article are web previews, so the JPG set is the better choice when you want the original files supplied with this county package.
Choose the general map for a one-page overview, the forest-and-farmland map for the clearest agriculture-versus-forest comparison, the impervious map for hard-surface patterns around settlements and roads, and the change map for a two-date comparison. The maps can be printed or placed in educational and reference materials, but their land-cover classes should still be interpreted with the limitations described below.
What these classifications cannot tell you about an individual property
Land cover is not zoning, legal land use, ownership, or a parcel survey. Agriculture means the surface was classified within an agricultural land-cover group; it does not identify the owner, crop, lease, or legal use. Forest identifies tree-dominated cover, not whether the tract is public, private, protected, managed for timber, or composed of a particular species.
Annual NLCD is a raster product, so real-world boundaries are generalized into grid cells. Narrow roads, small ponds, field edges, drainage features, and thin strips of trees may look simpler than they do on the ground. In western Lincoln County, where forest, farms, and wetlands frequently meet, a single cell may contain more than one type of surface. The colored edge on the map should never be treated as a surveyed property line.
The current maps use the 2025 classification supplied in the package. Construction, harvest, crop rotation, flooding, or vegetation changes after that observation period may not appear. The change product compares 1985 with 2025; it does not show when during those forty years a difference occurred. For a current site investigation, use newer imagery and the appropriate county, state, or federal records in addition to this map set.
The Lincoln County Cooperative Extension office in Star City is a useful local source for agriculture and natural-resource programs, while the Encyclopedia of Arkansas provides geographic background on the Arkansas River, Bayou Bartholomew, the Mississippi Alluvial Plain, and the Coastal Plain. Those references help place the maps in context, but neither should be used to assign an unverified cause to an individual pixel or change patch.
Frequently Asked Questions
What is the largest 2025 land-cover class in Lincoln County?
Agriculture is the largest reported class at 49.24%. Forest accounts for 20.85% and wetlands for 19.12%. The map shows agriculture most broadly in the east and northeast, while forest and wetlands are more prominent in the west and southwest.
Why does the western half of Lincoln County look more mixed than the eastern half?
The maps show more forest and wetlands mixed with smaller agricultural areas in the west, while the east contains broader farmland. A trusted Arkansas reference notes that Bayou Bartholomew crosses the county and separates the Mississippi Alluvial Plain to the east from the Coastal Plain to the west, although the map alone cannot prove the cause of each local cover difference.
Does the 15.46% class difference mean 15.46% of the county was developed?
No. It is the total area assigned a different mapped class in the 1985 and 2025 comparison. Only 1.37% is specifically reported as classified to developed, and the change map may also include classification variation as well as real landscape change.
Map File Information
The ZIP includes four original Lincoln County JPG maps: 2025 land cover, forest and farmland, impervious/developed land, and 1985–2025 land-cover change.
- Included Files: Use only the versions confirmed in the article and supplied images
- File Type: Use the confirmed download contents
- Intended Use: Printing, education, presentations, and map-based projects
Related Maps
- A Craighead County Arkansas Land Cover Map
- Arkansas County Arkansas Land Cover Map
- Ashley County Arkansas Land Cover Map
Sources and References
- MRLC Annual NLCD Data — official access to Annual NLCD land-cover products and related datasets.
- USGS Annual NLCD Land Cover Classification — official descriptions of the land-cover classes used for agriculture, forest, developed land, wetlands, and other categories.
- U.S. Census Bureau TIGER/Line Shapefiles — official county boundary data for Lincoln County and other U.S. counties.
- Lincoln County Cooperative Extension Service — University of Arkansas System county office information and local agriculture and natural-resource programs in Star City.
- Encyclopedia of Arkansas: Lincoln County — background on the Arkansas River boundary, Bayou Bartholomew, and the county’s eastern and western geographic divisions.
Green Map creates custom-edited map images using open geographic data sources such as geoBoundaries, Natural Earth, OpenStreetMap, and government open data.
These maps are edited visual materials, not raw data files, and are provided for education, documents, presentations, and graphic reference.