Little River County in southwest Arkansas does not have one land-cover type that overwhelms the rest of the county. In the 2025 summary, agriculture covers 31.84% and forest 31.23%, while wetlands account for 17.07%. The near tie becomes much more interesting once location is considered. Broad farm areas are easier to pick out in the south and west, while wooded cover is stronger through much of the center and east. Around Millwood Lake, water and wetlands form another large concentration.
Four views are included here: current land cover, forest and farmland, impervious surface and developed land, and mapped class differences from 1985 to 2025. The WebP images are page previews, and all four original JPG maps are available together in one ZIP download. Using the maps side by side makes it possible to separate questions about rural cover, built surfaces, lake and wetland areas, and long-term classification differences without asking one map to explain everything.
Table of Contents
The eastern side quickly explains why water and wetlands matter in Little River County
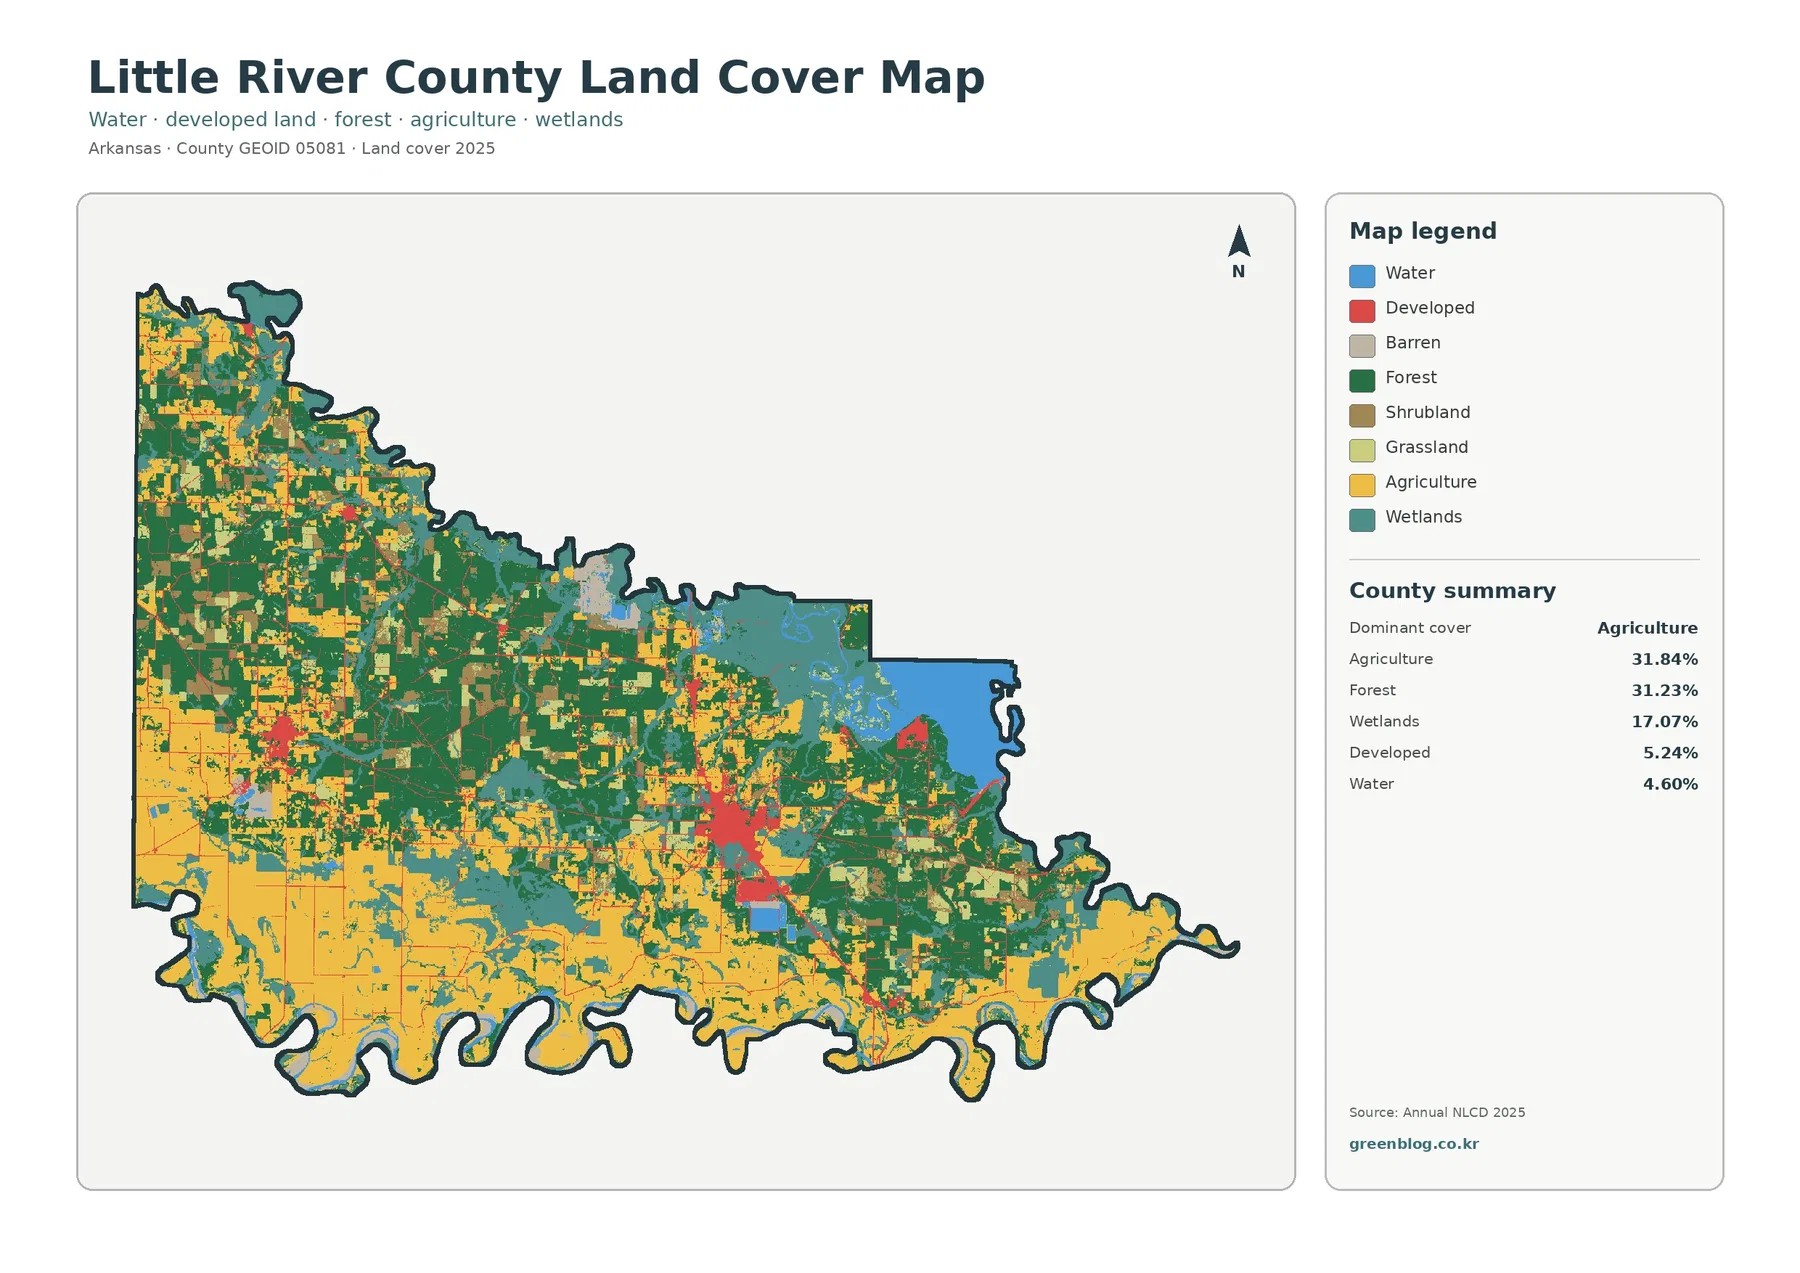
Millwood Lake is the most obvious water feature in the supplied land-cover image. The U.S. Army Corps of Engineers places Millwood Dam on the Little River about seven miles east of Ashdown, and the mapped lake occupies a broad area in the eastern part of the county. Blue water is surrounded by extensive teal wetland cover, with forest wrapping around many of those wet areas. That combination gives the east a very different appearance from the larger agricultural blocks that dominate much of the southern edge.
The county summary helps put that visual impression in perspective. Water is 4.60% of the mapped area, but wetlands are 17.07%. Wetland colors are not limited to a narrow strip around the lake; they also follow portions of the winding river margins and appear in smaller patches elsewhere. In other words, looking only for open water would miss a large part of the county’s water-associated cover.
Those teal areas should still be read as land-cover classifications rather than legal wetland boundaries. Annual NLCD describes surface cover from remotely sensed data; it does not establish a regulatory line, parcel boundary, ownership status, or permit requirement. The supplied map is useful for seeing where wetland-classified cells are concentrated, but a site-specific wetland decision requires the appropriate field and regulatory information.
Farmland and forest are almost tied in area, yet they separate clearly on the ground
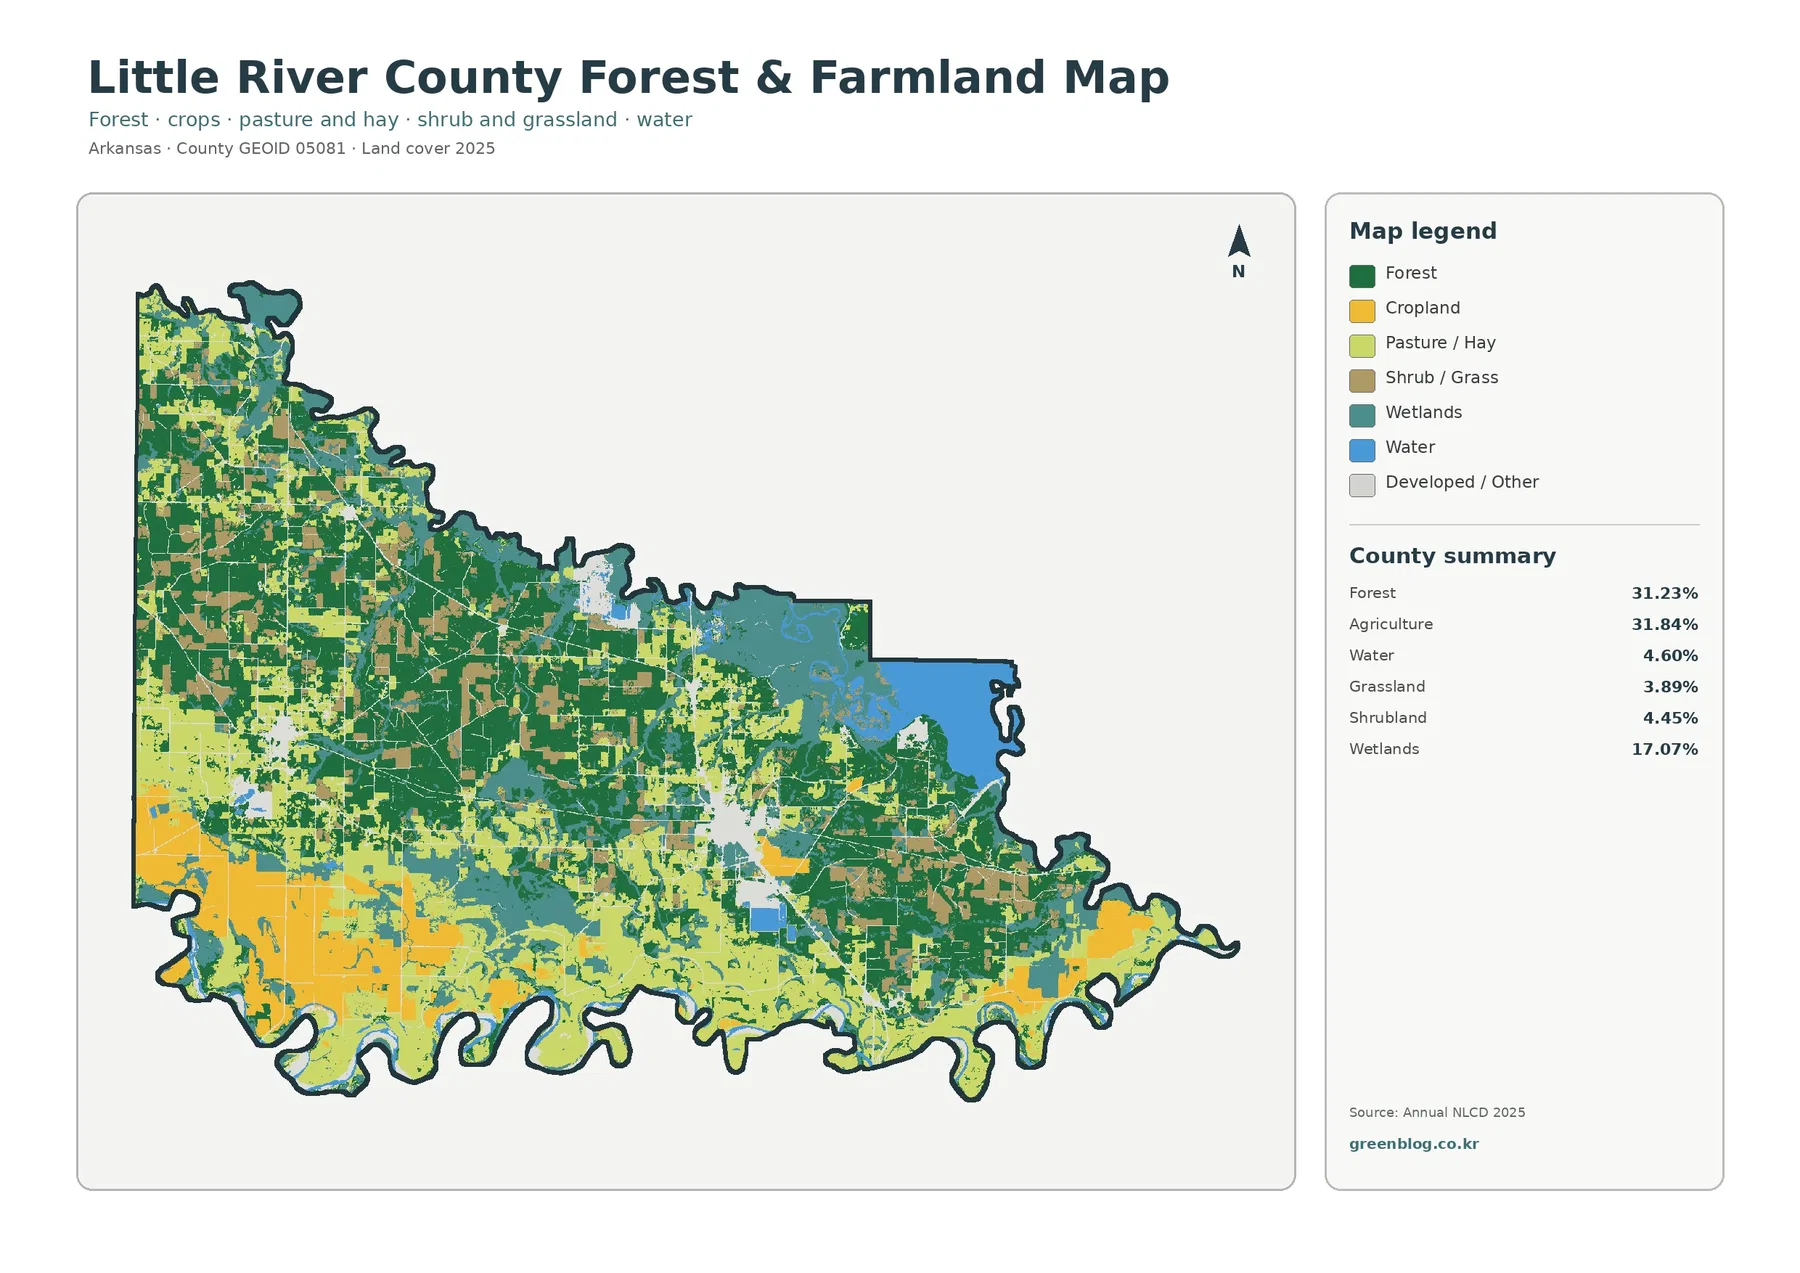
The forest-and-farmland view removes much of the developed detail, which makes the 31.84% agriculture and 31.23% forest shares easier to compare spatially. Large agricultural areas stand out along the southern and southwestern parts of the county. Farther north, fields break into smaller pieces and alternate more often with wooded tracts. The central portion becomes a patchwork rather than a simple boundary between a farm side and a forest side.
Wooded cover becomes more continuous through many central and eastern sections. Near Millwood Lake, forest sits beside wetlands and open water, while smaller agricultural areas continue to appear between green blocks. That pattern does not support a neat “west is farms, east is forest” rule. It shows a broad directional contrast, but the transitions are irregular and mixed.
Two smaller categories help explain those transitions. Grassland is listed at 3.89% and shrubland at 4.45%. Both appear as scattered patches instead of one large countywide belt. They matter because a pale open area between a field and a forest should not automatically be labeled farmland. Reading the legend keeps those smaller cover types from disappearing into an overly simple farm-versus-forest interpretation.
The simplified map also gives useful context around the two named developed clusters. Foreman sits within a western landscape where farm and forest cover resume quickly outside the compact built area. Ashdown, farther east, is surrounded by another mixed zone, but its developed footprint is more obvious on the dedicated impervious map. Because municipal limits are not drawn, these observations describe the visible landscape around the known city locations rather than precise city boundaries.
Ashdown stands out on an impervious map that is otherwise mostly pale
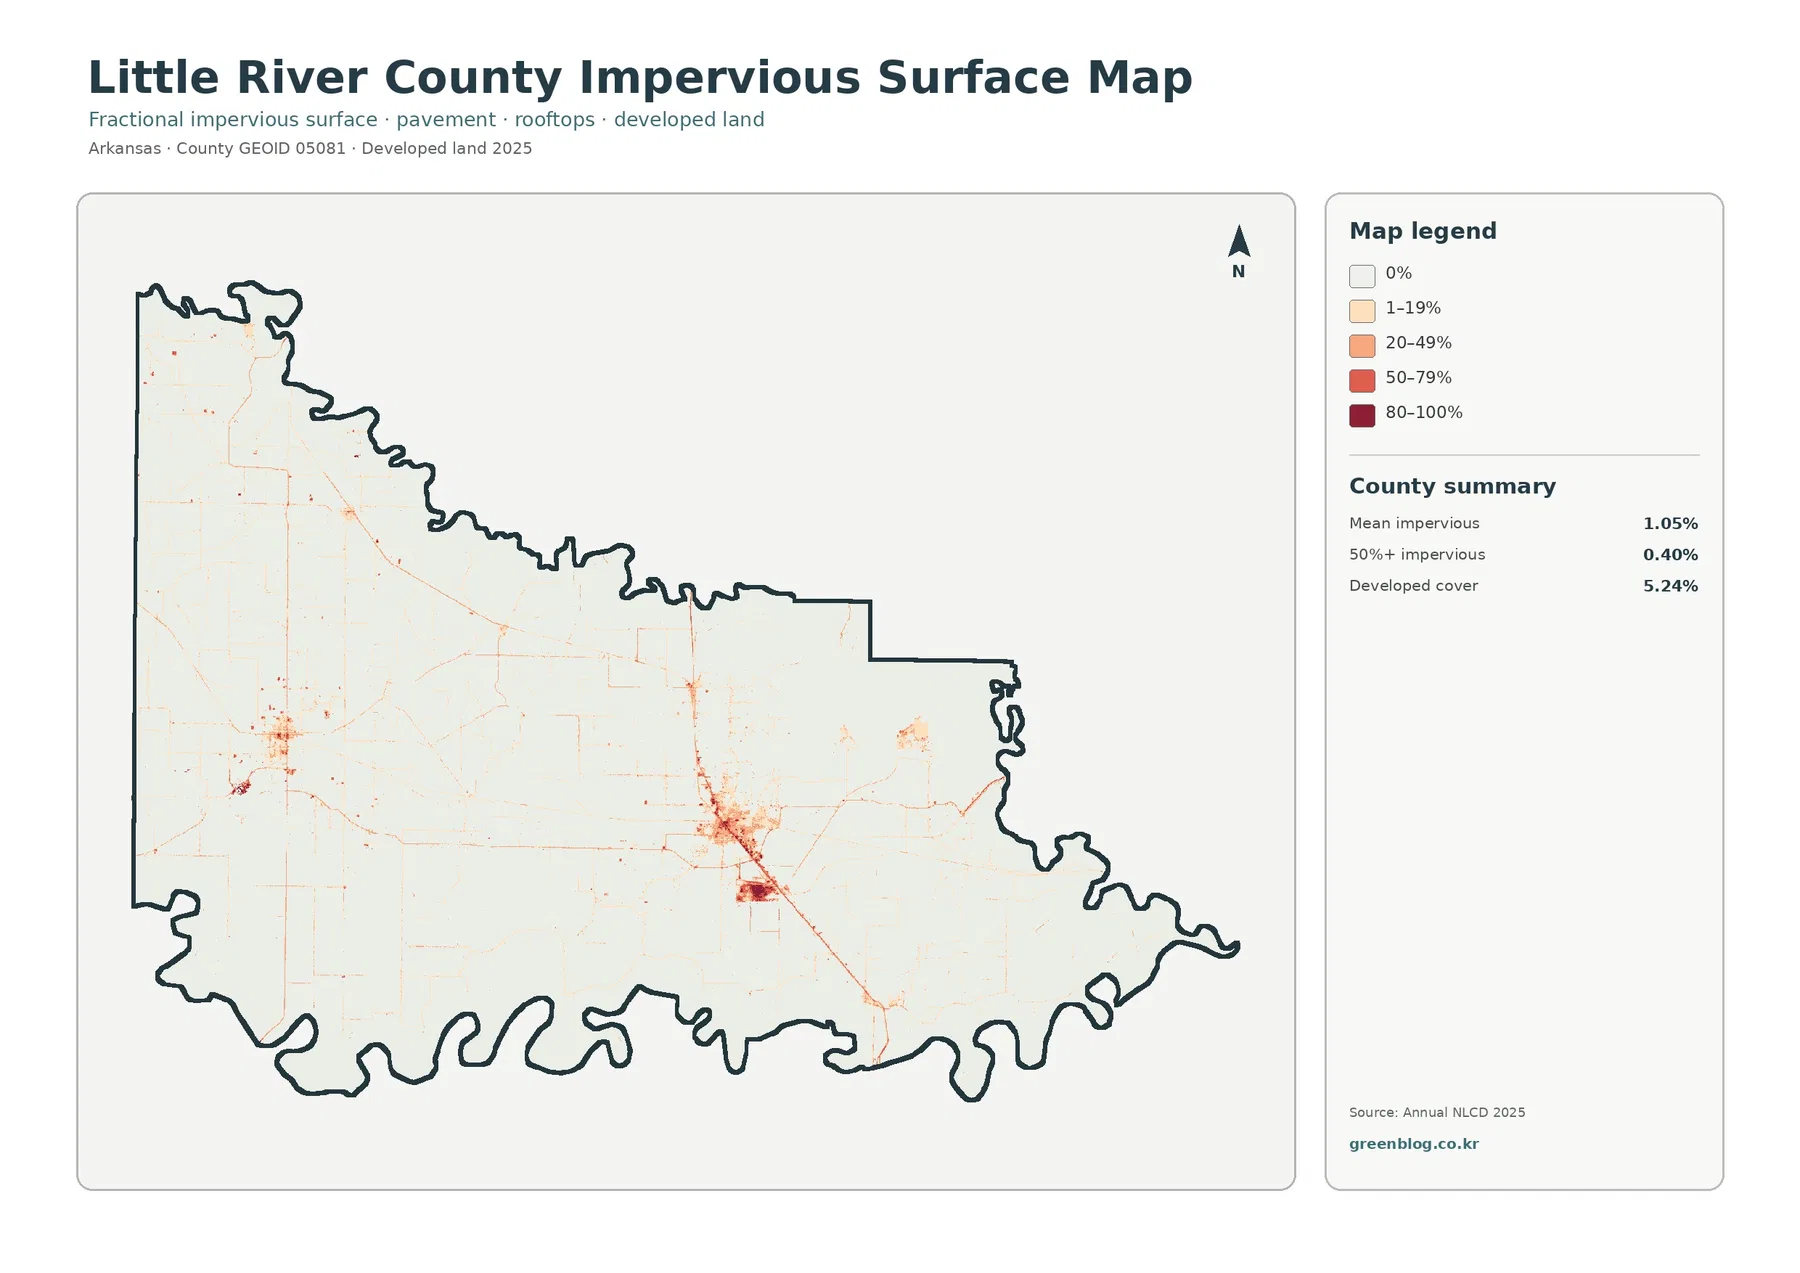
Impervious surface measures a different property from the general developed-land class. It estimates the share of a cell covered by hard surfaces such as pavement and rooftops, where water does not readily soak into the ground. The county’s mean impervious value is 1.05%, and only 0.40% of the area is mapped at 50% or greater imperviousness. Developed cover, by contrast, is 5.24% because a developed class can also include lawns, trees, exposed soil and other surfaces that are not fully impervious.
Ashdown forms the strongest orange and red concentration in the image. From that cluster, thinner traces extend along several roads into much paler surroundings. Foreman creates a smaller concentration farther west. Outside those places, the map is dominated by very low values, which fits the large amounts of farmland, forest, wetland and water seen in the other views.
This is the most direct of the four maps for comparing built-surface concentration. A countywide average of 1.05% can sound uniformly low, but the image makes the local contrast clear. A small developed core can contain much higher values even when most of the county remains lightly impervious. The thin road traces are also easier to see here than on the general land-cover image.
Imperviousness is not the same as flood risk or runoff volume. Rainfall, soils, slope, drainage systems, river levels and many other conditions are not represented by the percentage alone. As a first comparison, the impervious view works well for developed versus rural surfaces or a watershed lesson, but it should not be substituted for a drainage or flood study.
The 1985–2025 comparison is a map of class differences, not a development percentage
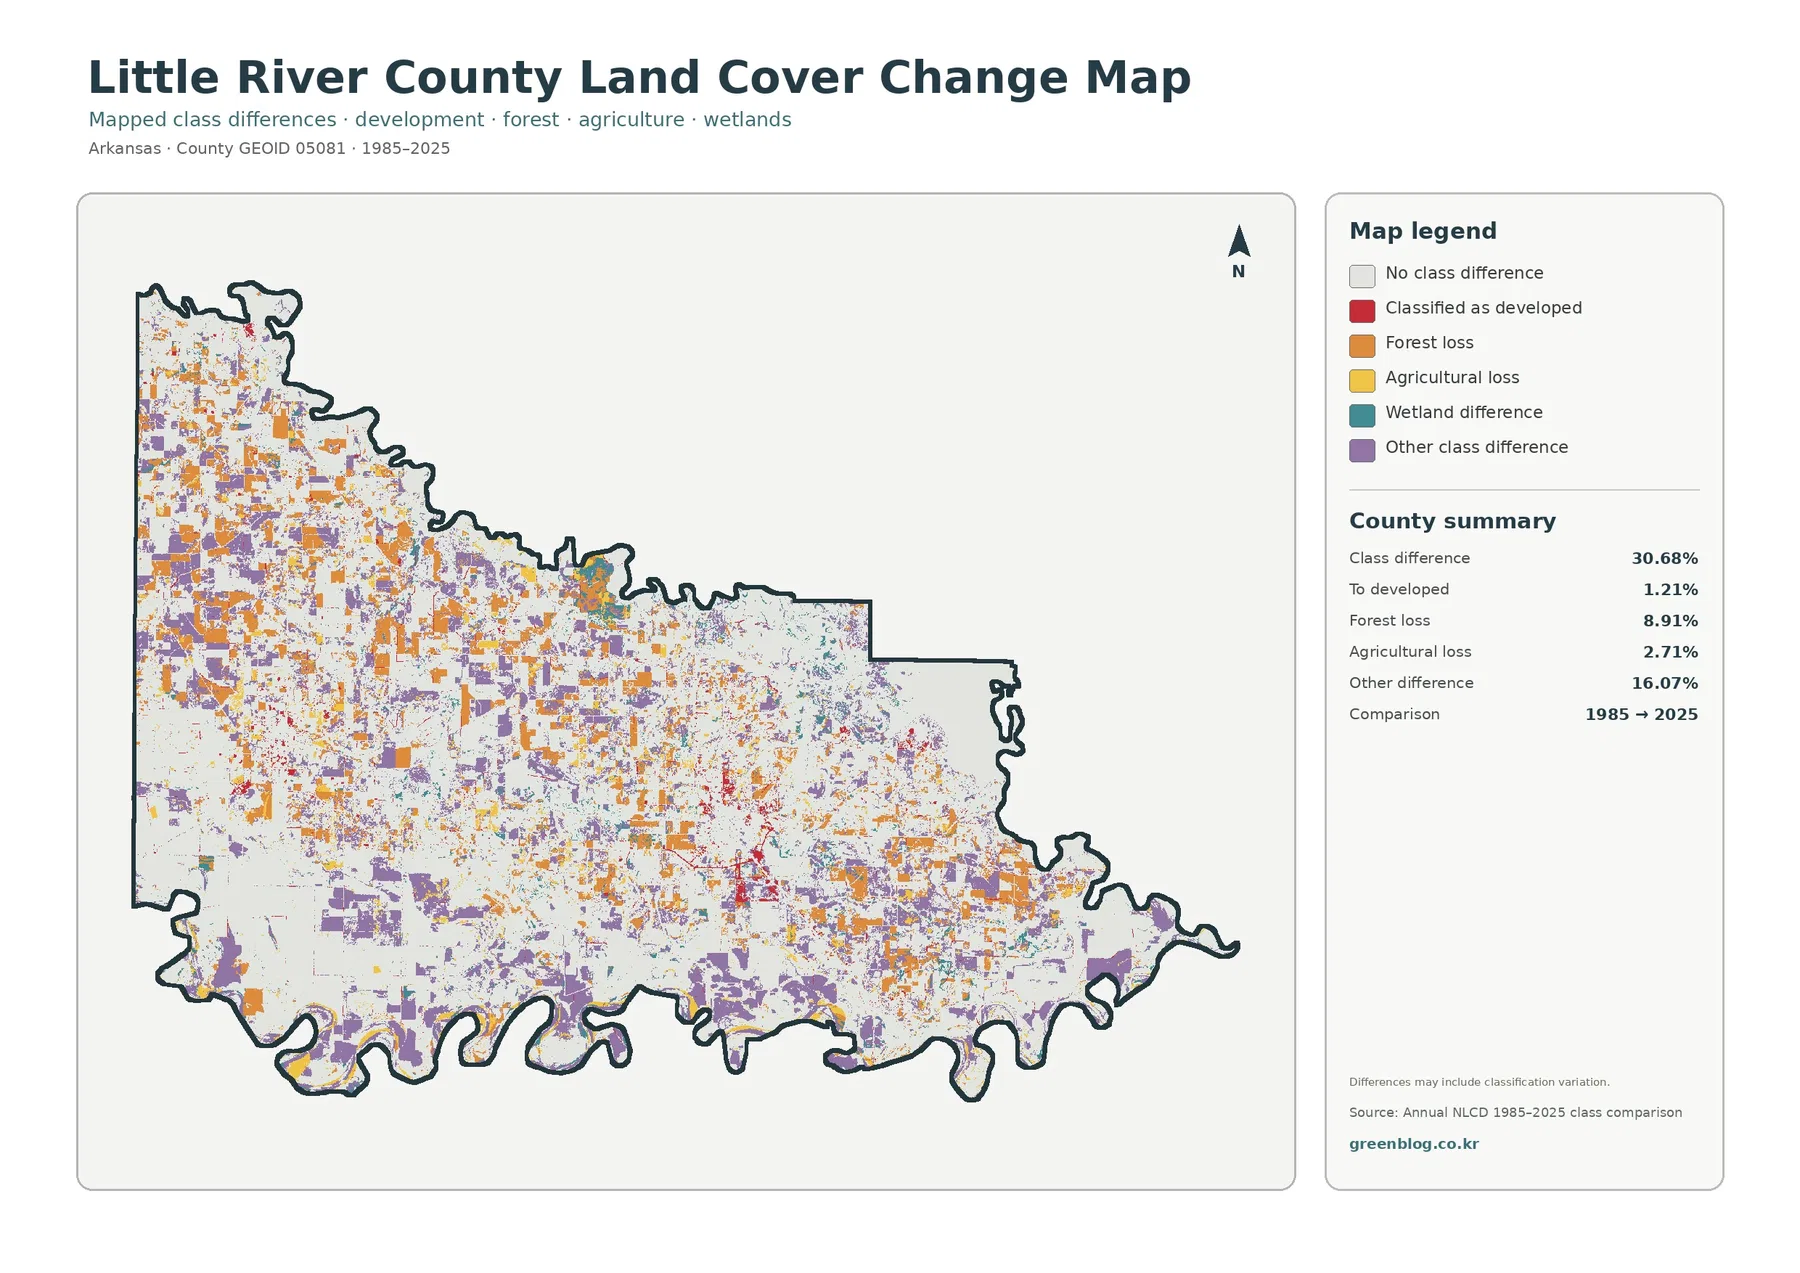
The change summary reports 30.68% as total class difference between the two endpoint datasets. That number does not mean 30.68% of Little River County became developed. Separate summary values are 1.21% classified to developed, 8.91% forest loss, 2.71% agricultural loss, and 16.07% other class difference. These are categories of mapped difference, not pieces of a current 2025 land-cover pie chart.
Orange forest-loss marks and purple other-difference marks are scattered widely across the western and northwestern parts of the county. Additional patches continue through the center and southeast. Red areas classified to developed are more concentrated around Ashdown and along narrow transportation corridors. The pattern makes the map useful as a screening view: it points to places where the two classifications differ and where a closer look may be worthwhile.
Current percentages should not be altered by subtracting the difference values. The present forest share of 31.23% tells how much area is classified as forest in 2025. The 8.91% forest-loss figure instead refers to cells that changed category between the endpoints. The same distinction applies to 31.84% current agriculture and 2.71% agricultural loss.
A note on the change graphic warns that some differences may include classification variation. A changed cell can reflect a real surface change, but mixed pixels, edge placement, image conditions or classification behavior may also contribute. For that reason, the map is better for locating possible change than for assigning an exact year or cause to a field, forest stand, wetland or neighborhood.
The countywide percentages are most useful when they stay connected to location
Agriculture being slightly larger than forest is an important summary fact, but the map gives that number meaning. Much of the southern part of the county is visibly more agricultural, while forest becomes stronger through the center and east. Wetlands at 17.07% are too large a share to treat as a narrow shoreline feature. Their distribution around Millwood Lake and along river margins changes the character of the eastern landscape.
The developed share tells a similar story. A 5.24% developed class sounds small compared with agriculture or forest, yet Ashdown is still easy to locate because built cover is concentrated rather than spread evenly. On the impervious map, that concentration becomes even clearer while most rural areas fade into very low values. Reading the percentage and the image together avoids the mistaken idea that a county average describes every part of the county equally well.
Two rivers also help explain the county outline in the supplied maps. The Encyclopedia of Arkansas describes the rivers as forming major parts of the county boundary, and long stretches of the northern and southern edges visibly follow winding watercourses. Those irregular edges matter when reading cover near the margins: farm, forest and wetland patches reach a river-shaped boundary rather than a simple straight county line.
Choose two views at a time when a comparison matters more than a complete legend
For a county overview, begin with the general land-cover map. It keeps the near-even agriculture and forest shares, the wetland component, developed clusters and Millwood Lake in the same frame. When the goal shifts to rural cover, pair it with the forest-and-farmland map. The second view reduces visual clutter and makes the southern farm areas and more wooded central and eastern sections easier to discuss.
A development-focused comparison works better with the general map beside the impervious view. One map identifies developed cover as a land-cover class, while the other shows how hard surfaces are concentrated within and along those developed places. For a historical comparison, place the current map beside the 1985–2025 difference map so the viewer can keep present-day cover separate from endpoint change categories.
Water and wetland questions benefit from another pairing. The general map shows open water and wetland classes directly, while the forest-and-farmland view makes the surrounding rural cover easier to follow. These combinations work well for environmental education, local reference, presentations and other tasks that need a county-scale explanation rather than parcel-level precision.
Download the four original Little River County JPG maps
The ZIP contains four separate JPG files: 2025 land cover, forest and farmland, impervious surface and developed land, and the 1985–2025 land-cover change map. The asset manifest lists each original JPG at 2480×1754 pixels, while the page previews are 1800×1273 WebP images. The original supplied files stay at their source resolution rather than being enlarged or re-encoded. Use the ZIP when the source JPGs are needed instead of the web previews.
Before using a color as evidence about a site or parcel, check what the map does not contain
Land cover tells you how the ground surface was classified. It does not tell you what a parcel is legally zoned for, who owns it, whether development is permitted, or where a surveyed property line lies. A cell mapped as agriculture does not establish agricultural zoning, and a forest cell does not identify public ownership or protected status. Those questions require the appropriate local records and legal data.
Annual NLCD is raster data, so the landscape is represented by a grid of cells. A boundary cell can contain more than one real surface, such as road and grass or forest and field. These mixed pixels can make an edge look cleaner on the map than it is on the ground. That limitation is especially important in Little River County because forest, agriculture, wetlands and water meet repeatedly across the central and eastern portions.
The current maps use the 2025 classification supplied with this package, and the change product compares the 1985 and 2025 endpoints. Construction, timber harvest, crop conversion, shoreline conditions or other events after the mapped year may not appear. The difference map also does not record every event that happened during the forty-year interval. Recent aerial imagery and field information are better choices when the latest condition of a specific place matters.
For local context, the University of Arkansas System Cooperative Extension maintains a Little River County office in Ashdown, and the U.S. Army Corps of Engineers publishes information about Millwood Lake. Those references can help explain the agricultural and water-resource setting around the county. They should not be used to assign a cause to a particular colored change cell unless a source directly documents that location and event.
Frequently Asked Questions
Why are agriculture and forest both prominent in Little River County?
The 2025 summary lists agriculture at 31.84% and forest at 31.23%, so their countywide shares are nearly equal. The map shows that they are not evenly mixed: larger agricultural areas occur in the south and west, while forest is more continuous through many central and eastern sections.
What do the large blue and teal areas near Millwood Lake represent?
Blue represents open water and teal represents wetlands. The 2025 county summary lists water at 4.60% and wetlands at 17.07%. The classes often occur next to each other around Millwood Lake and the Little River, but they are mapped separately.
Does the 30.68% class difference mean 30.68% of the county was developed?
No. The 30.68% value is the total share of cells classified differently in 1985 and 2025. The map separately lists 1.21% as classified to developed, and the total also includes forest, agriculture, wetland, other differences, and possible classification variation.
Map File Information
The ZIP contains four original JPG maps for Little River County: 2025 land cover, forest and farmland, impervious surface and developed land, and 1985–2025 land-cover change.
- Included Files: Land cover, forest/farmland, impervious/developed land, and land-cover change maps
- File Type: Four JPG files in one ZIP
- Intended Use: Printing, education, presentations, and map reference
Related Maps
- A Craighead County Arkansas Land Cover Map
- Arkansas County Arkansas Land Cover Map
- Ashley County Arkansas Land Cover Map
Sources and References
- MRLC Annual NLCD Data — Official access point for Annual NLCD land-cover data and related products.
- USGS Annual NLCD Land Cover Classification — Official explanation of the land-cover classes used for forest, agriculture, developed land, wetlands, water and other categories.
- U.S. Census Bureau TIGER/Line Shapefiles — Census boundary data for U.S. counties, including Little River County.
- Little River County Cooperative Extension Service — University of Arkansas System county office information and local research-based education programs.
- U.S. Army Corps of Engineers: Millwood Lake — Official information on Millwood Dam, its Little River setting, and the lake.
- Encyclopedia of Arkansas: Little River County — Background on the county, Ashdown, and the Little River and Red River boundary setting.
Green Map creates custom-edited map images using open geographic data sources such as geoBoundaries, Natural Earth, OpenStreetMap, and government open data.
These maps are edited visual materials, not raw data files, and are provided for education, documents, presentations, and graphic reference.