Ashley County in southeastern Arkansas has a land-cover pattern that changes noticeably from one side of the county to the other. The 2025 summary is led by forest at 36.16%, while agriculture accounts for 24.75% and wetlands for 24.29%. Broad farm blocks dominate much of the east, whereas the central and western portions contain a more intricate mix of forest and wetland. Developed areas occupy a smaller share but form clear concentrations near the county’s main population centers.
This page brings together four views of that landscape: 2025 land cover, forest and farmland, impervious surface and developed land, and a 1985–2025 class-change comparison. The four original JPG maps are available in one download. Use the maps as county-scale reference graphics for teaching, presentations, environmental context, or an initial comparison of developed, agricultural, forested, and wet areas.
Table of Contents
A county where forest, farms, and wetlands all matter
No single class describes Ashley County well. Forest is the largest category, but it covers a little more than one third of the county rather than a majority. Agriculture and wetlands are nearly tied, and together they cover almost half of the mapped area. This balance explains why the county looks so varied on the full land-cover map: large dark-green forest patches sit next to teal wetland corridors, while extensive yellow agricultural fields become especially prominent toward the eastern side.
The map also separates developed cover, shrubland, grassland, open water, and small amounts of other cover. Developed land is 5.88% of the 2025 summary and shrubland is 4.14%. These smaller percentages still carry useful information because they are concentrated rather than evenly spread. Developed cover helps locate settlement and road patterns, while open water and wetland colors trace low-lying areas and drainage features that cut through both forest and farmland.
Land cover should not be confused with zoning or legal land use. Annual NLCD classifies what is on the surface—forest, crops, developed cover, water, wetlands, and other broad categories. It does not tell you who owns a parcel, whether a site is zoned for housing or industry, or whether a property can be developed. Those questions require parcel records and local planning information rather than a satellite-derived land-cover map.
Impervious surfaces pinpoint the most built-up parts of Ashley County
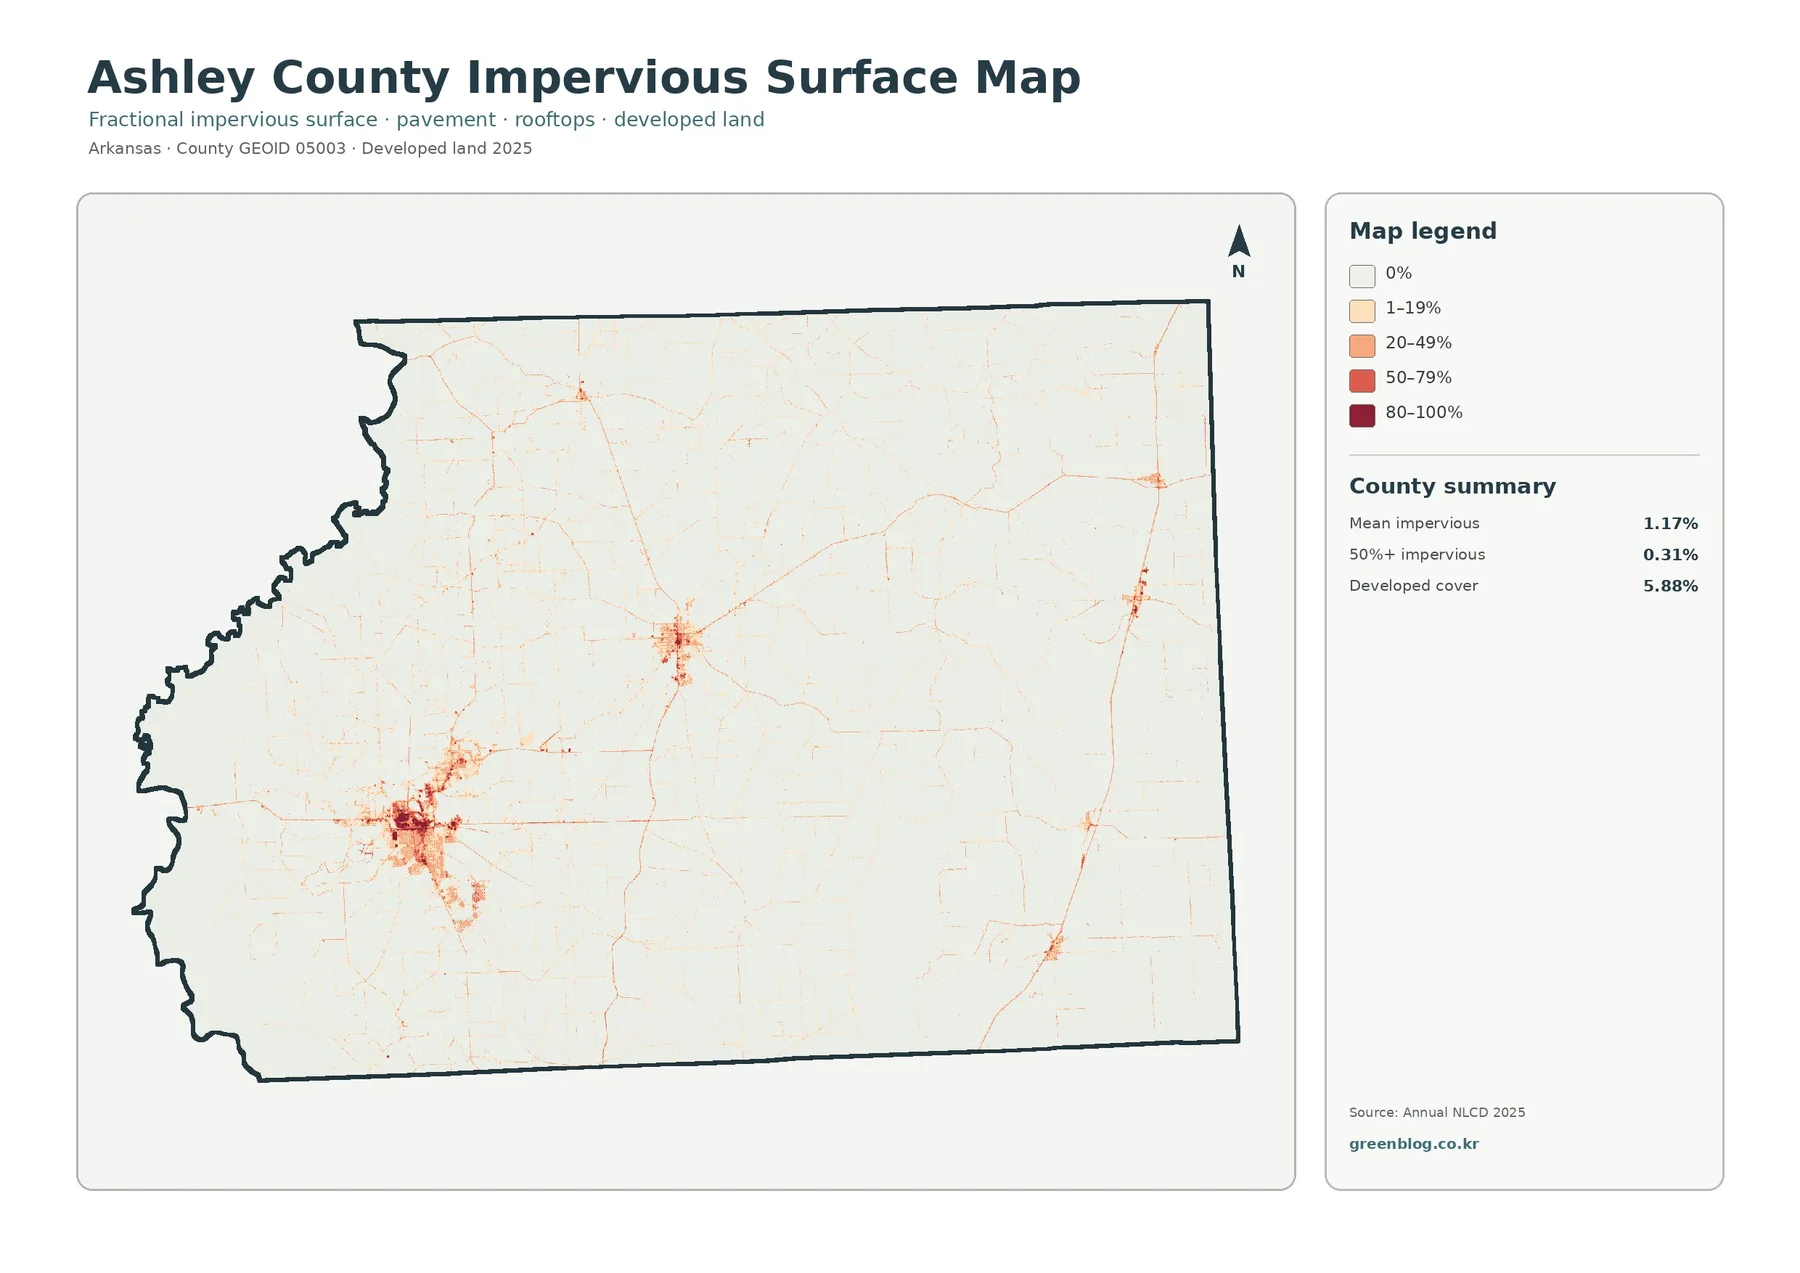
The impervious map strips away most natural-cover colors and focuses on surfaces such as pavement and rooftops that do not readily absorb rainfall. Most of Ashley County remains very pale on this view, which fits a county dominated by forest, agriculture, and wetlands. The strongest dark cluster appears in the southwest around the general location of Crossett. A second concentration near the middle of the county corresponds broadly with Hamburg, and thinner lines extend outward along the road network.
The countywide mean impervious value is 1.17%, while only 0.31% of the mapped area falls at 50% impervious or higher. Developed cover in the categorical land-cover product is 5.88%. Those figures are not contradictory. The developed class can include places with a mixture of vegetation and built surfaces, while the fractional impervious layer measures how much of each cell is actually covered by hard, water-resistant surfaces.
This distinction makes the impervious map useful for locating the most intensively built parts of the county without treating every developed pixel as a dense urban block. It can also provide starting context for runoff or watershed discussions. It should not be used by itself to predict flooding, however, because flood behavior also depends on rainfall, soil, slope, drainage infrastructure, stream levels, and many other factors that are not contained in this image.
The 2025 land-cover map reveals an east-west contrast
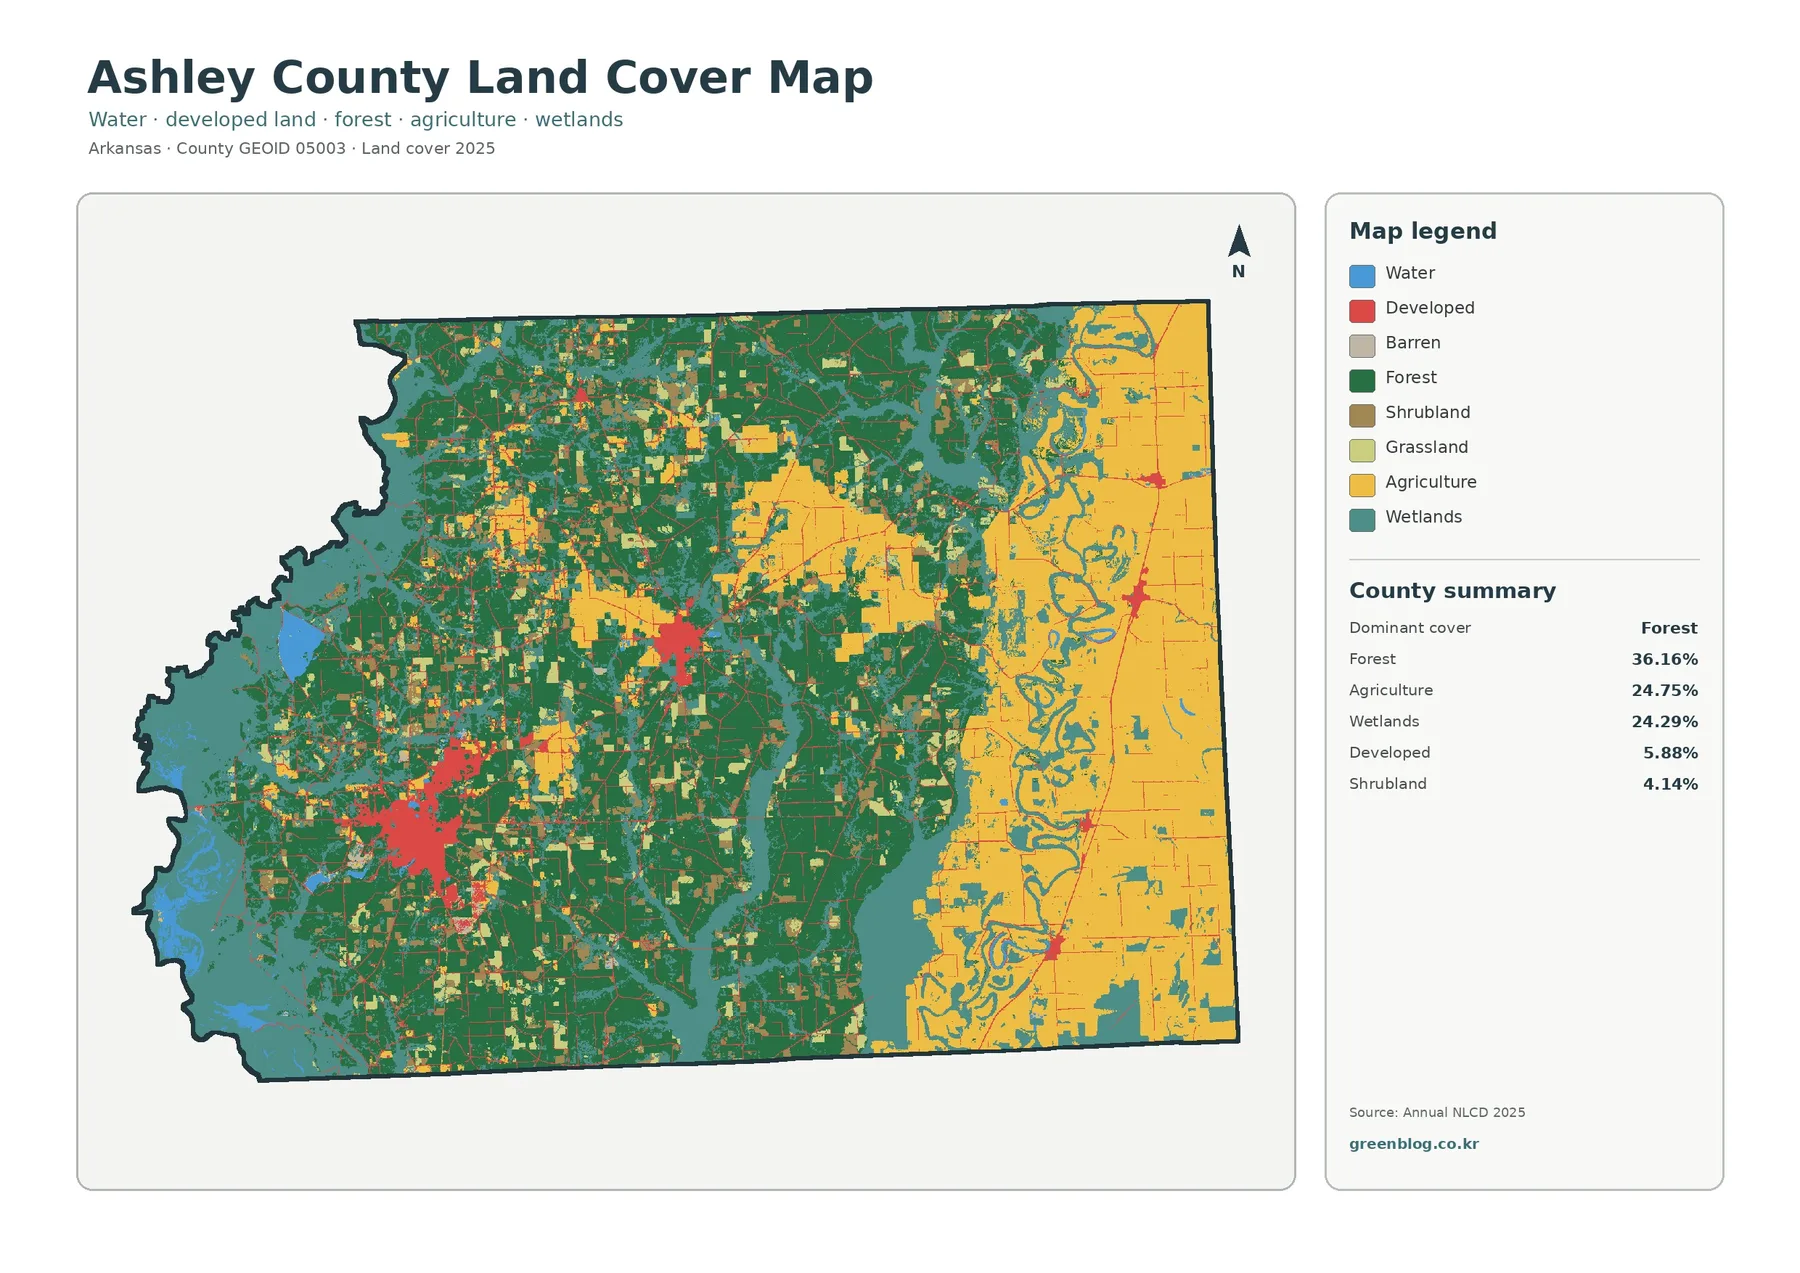
On the general 2025 map, the eastern part of Ashley County stands out for its large, contiguous agricultural blocks. Those fields are not isolated from natural cover. Teal wetlands and blue water features weave through and around the farmed area, creating irregular edges and narrow corridors. Moving westward, agriculture becomes more fragmented and dark-green forest occupies a much larger share of the view.
The central and western sections are more mixed. Forest patches range from large continuous areas to smaller pieces separated by roads, fields, wetlands, or developed land. Wetlands are especially noticeable along low-lying corridors and around water features, and the far western boundary has a more irregular shape than the straighter eastern edge. The map is useful because all of these classes can be compared in one frame instead of examining forest, farms, or development in isolation.
Red developed pixels form obvious clusters around settlement areas and appear as thinner traces along roads elsewhere. Because the preview does not label individual towns or roads, a single red patch should not be treated as an official municipal boundary or a specific facility. The developed class represents surface-cover conditions, not incorporated city limits. For precise road names, parcel boundaries, or local jurisdiction lines, use a dedicated transportation or cadastral source.
Forest and farmland become easier to compare when the legend is simplified
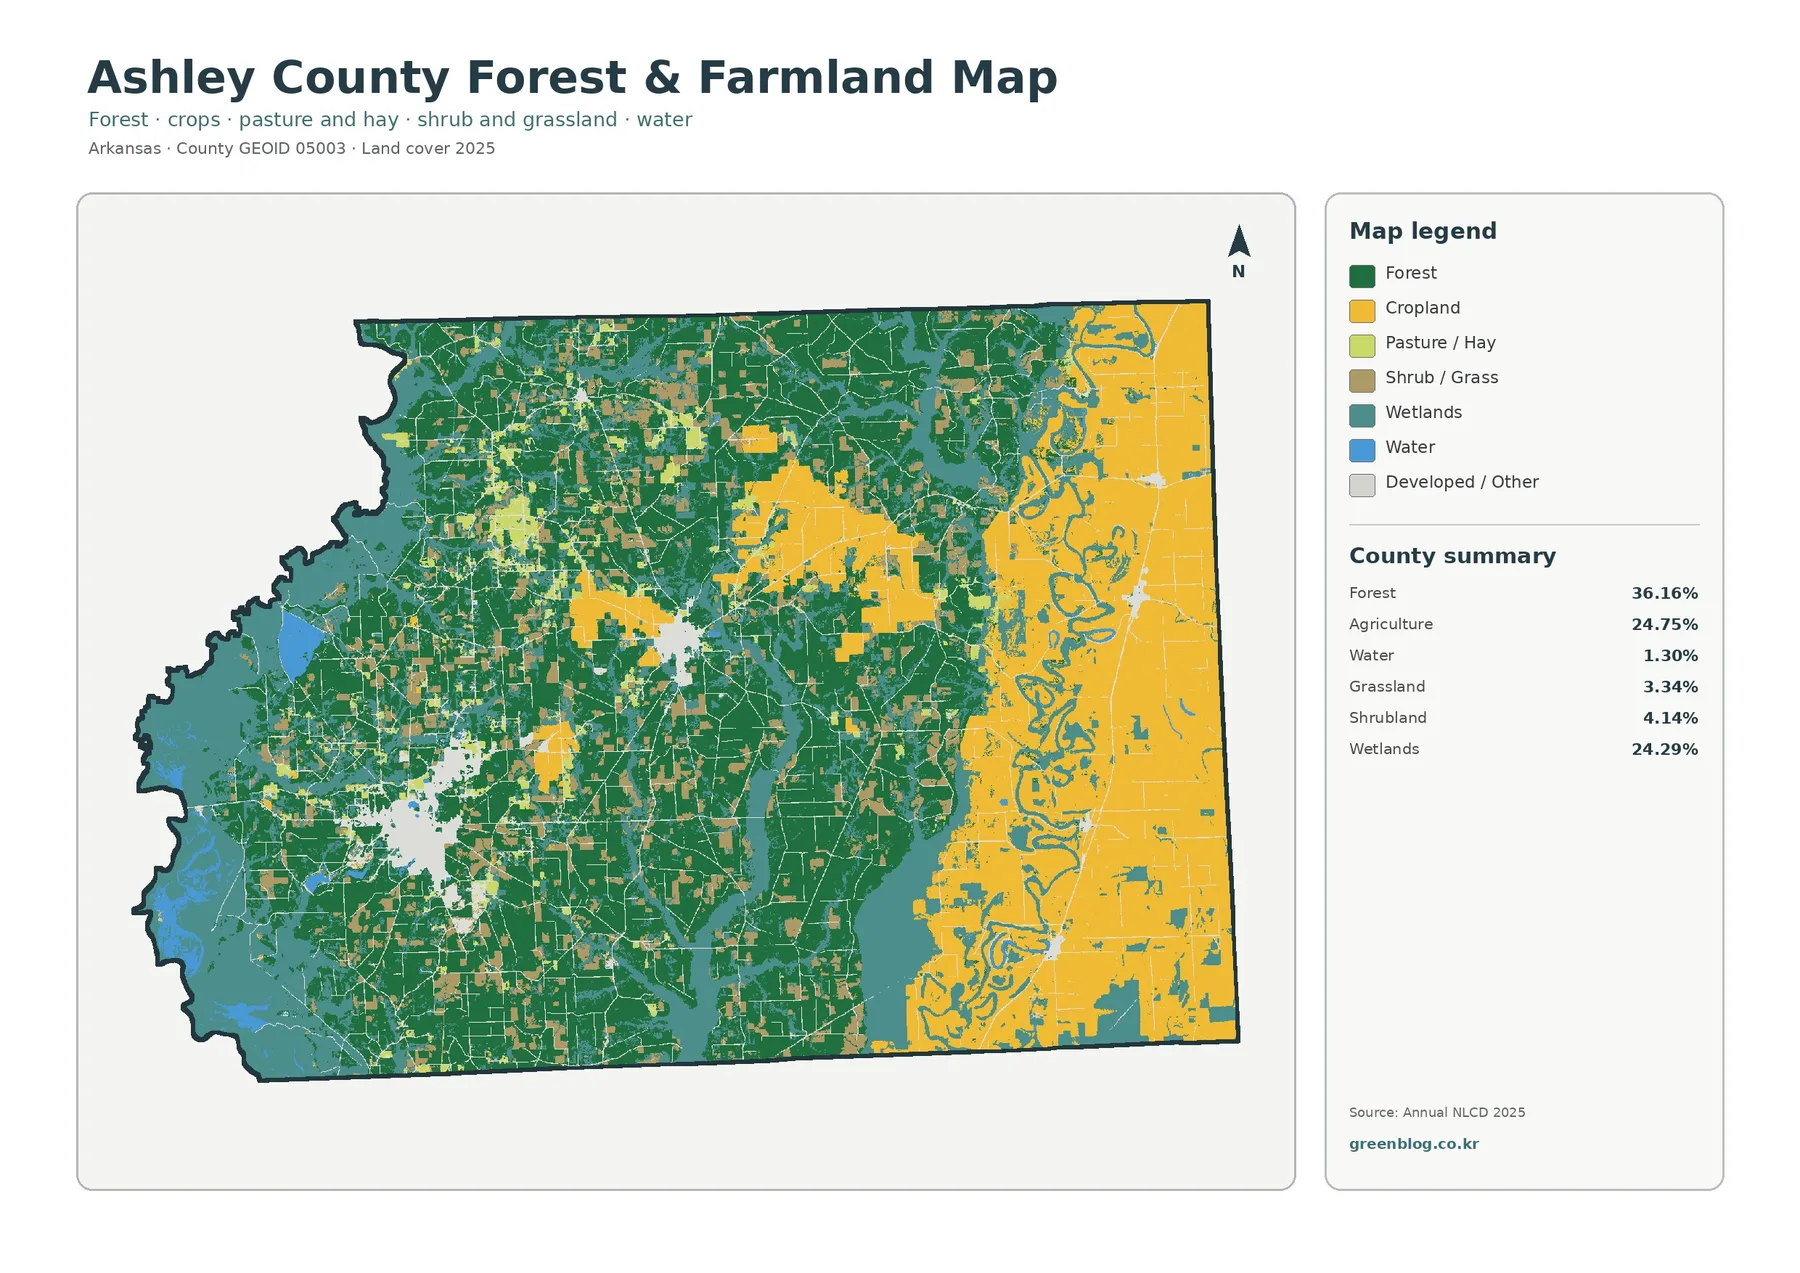
The forest-and-farmland view emphasizes the two major terrestrial cover types without removing the water and wetland context that shapes the county. Forest remains 36.16% and agriculture 24.75%. The same summary also reports water at 1.30%, grassland at 3.34%, shrubland at 4.14%, and wetlands at 24.29%. Those values make clear that the space between the large forest and crop blocks is not simply “empty” land; wetlands form a major part of the county landscape.
Agriculture is most continuous in the east, where broad yellow fields fill much of the rectangular eastern section. Smaller farm patches also appear farther west and north, often interspersed with forest. Forest, in turn, is not limited to the western half. Dark-green patches continue into agricultural areas and along wet corridors. The result is a patchwork rather than a clean dividing line between a forest zone and a farm zone.
Historical ecological research by the U.S. Forest Service provides useful background for this pattern. Work based on early survey records describes bottomland forests, upland mixed pine and hardwood forests, grasslands, and aquatic features in the Ashley County area. That historical study is not a direct baseline for the 2025 NLCD percentages, but it helps explain why forest and wetland settings are important parts of the county’s broader landscape story.
The 1985–2025 map highlights where classifications differ
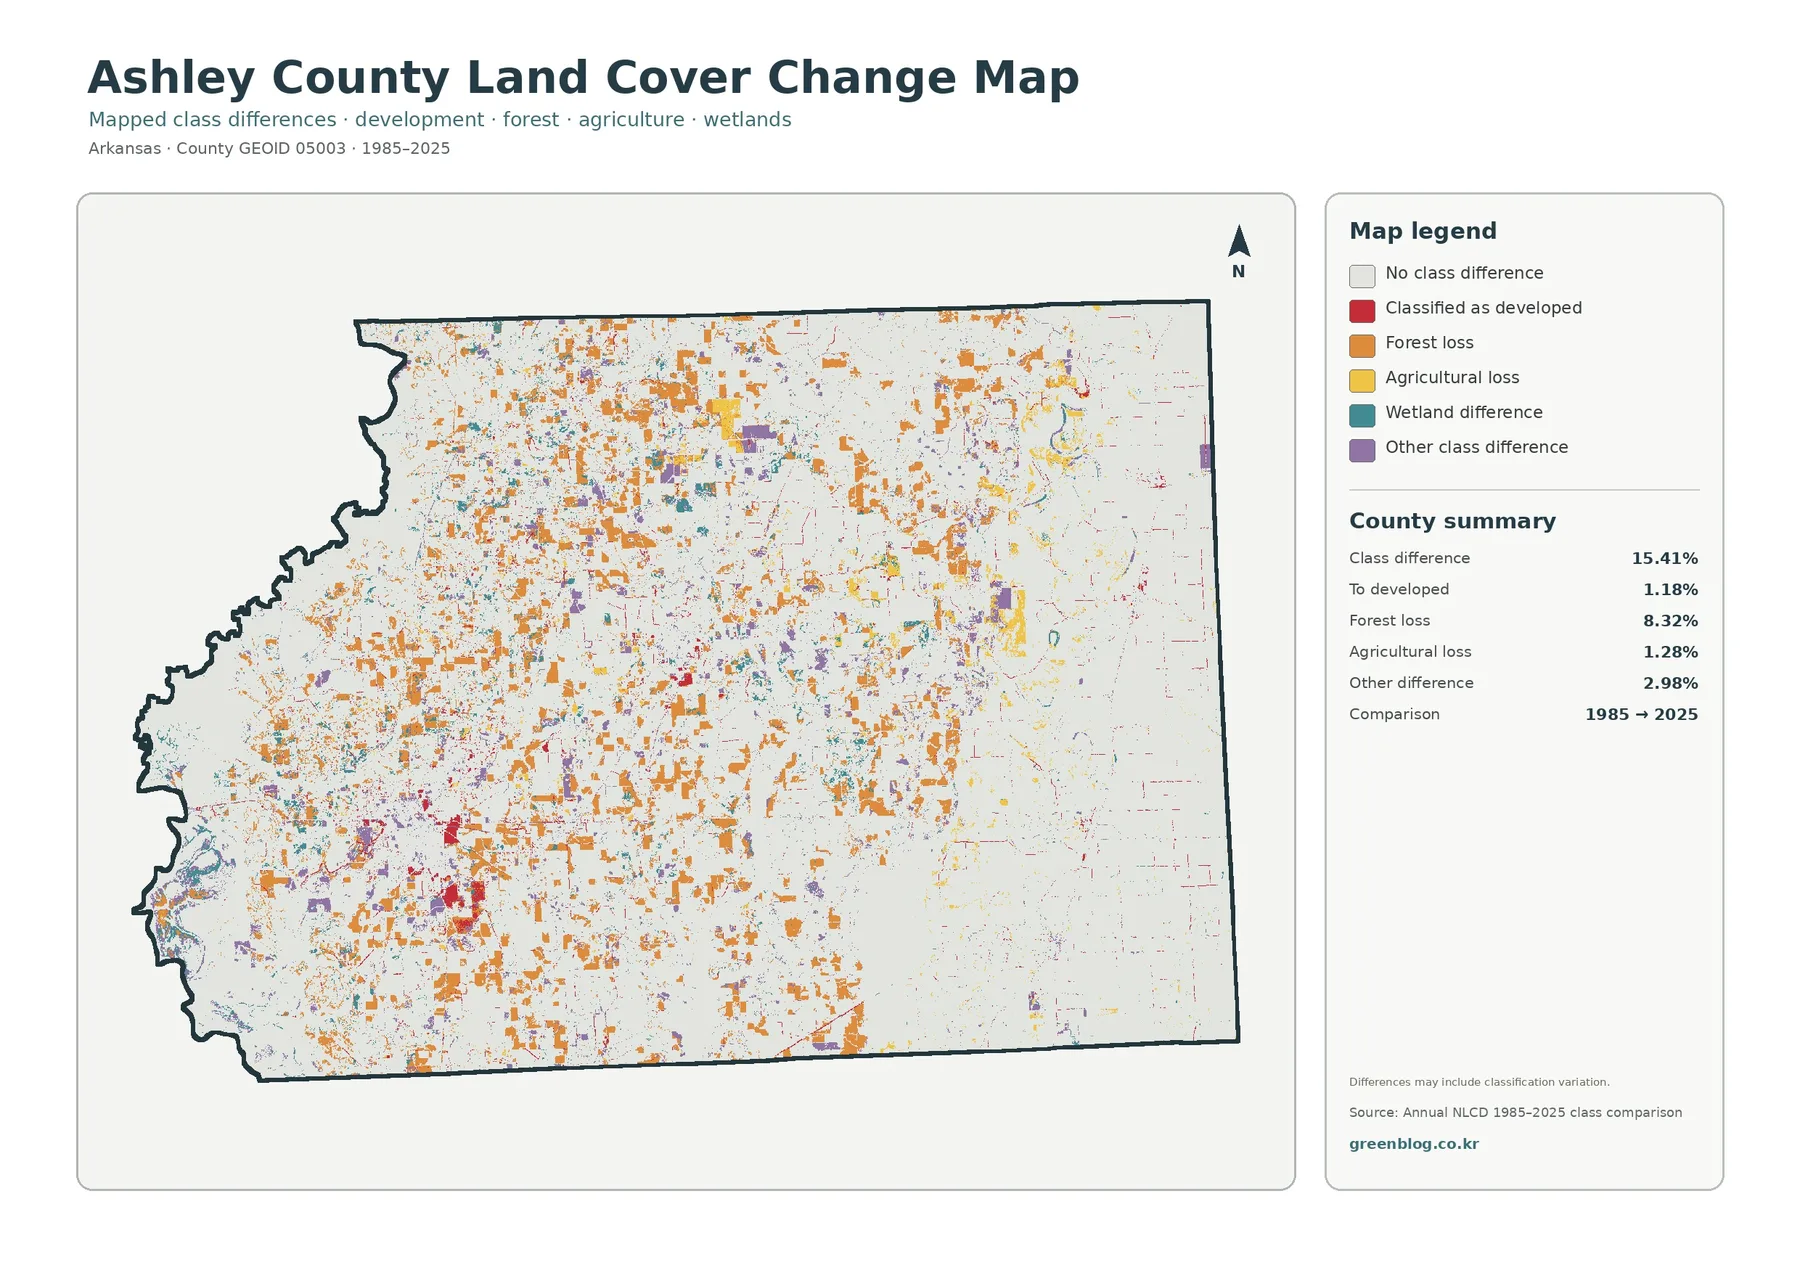
The change map compares the 1985 and 2025 classifications and marks cells whose class is different at the two endpoints. The summary reports a total class difference of 15.41%. Within that total, 8.32% is assigned to the forest-loss category, 1.18% to cells classified as developed, 1.28% to agricultural loss, and 2.98% to other differences. Wetland difference is mapped as its own category, but the summary panel does not list a separate percentage for it, so no value is inferred here.
Orange forest-loss cells are distributed widely across the county instead of forming a single continuous block. Red developed-change cells are more concentrated near the southwest settlement cluster and around the central population area. In the eastern agricultural region, several kinds of class differences appear along field edges and wet corridors. This dispersed pattern is useful for identifying locations that may deserve closer inspection rather than suggesting that one large section of Ashley County changed in the same way.
A forest-loss label on this map is not automatically proof of permanent deforestation. It means the endpoint classifications differ in the way defined by the map’s comparison rules. Timber harvest followed by regrowth, conversion to another cover type, wetland shifts, classification uncertainty, and changes near mixed boundaries can all contribute to differences. The map itself notes that classification variation may be included, so a site-specific conclusion should be checked against annual data, aerial imagery, and local records.
The large pale background is important too. A cell with no endpoint class difference had the same representative class in 1985 and 2025, but that does not guarantee that nothing happened there during the intervening forty years. A place could have changed temporarily and returned to the same broad class. Treat this graphic as an endpoint comparison, not as a complete year-by-year history of every land-cover event.
Bayou Bartholomew adds useful local context for wetland patterns
Ashley County lies within a southeastern Arkansas landscape shaped by bayous, lowlands, forest, and agriculture. Arkansas Game and Fish Commission information for Little Bayou Wildlife Management Area places the site in Ashley County and notes access to Bayou Bartholomew. The agency describes the area as predominantly forested with bottomland and upland hardwoods plus shortleaf pine, and it also warns that seasonal high water and flooding can occur.
That local information helps explain why wetland and forest colors deserve as much attention as cropland on the county maps. It does not mean that every wetland-colored cell belongs to Bayou Bartholomew or that every blue line can be named from this land-cover image. Individual channels are not labeled in the preview. A hydrography map is the better source when the exact stream name, route, or watershed boundary matters.
For environmental education, the eastern farm-and-wetland boundary is particularly instructive. Large agricultural blocks sit close to wet corridors, while forest remains nearby in strips and patches. Students or planners can use that pattern to discuss how land-cover classes meet one another around drainage features, then move to more detailed watershed or conservation data if they need to evaluate water quality, habitat, or management questions.
How to read 30 m Annual NLCD without overinterpreting it
Annual NLCD is a raster product derived largely from Landsat imagery at 30-meter spatial resolution. In practical terms, the landscape is divided into grid cells about 30 meters on a side and each cell is assigned a representative class or surface value. A real 30-meter area may contain trees, grass, pavement, a ditch, and part of a building at the same time, but the map must generalize that mixture. Small features can therefore disappear or be represented by the dominant signal in the cell.
Mixed pixels are most common near boundaries between cover types. A narrow road through forest, a small pond, a thin stream, or the edge of a field may not appear with survey-level precision. The same caution applies to the county’s developed fringes and wetland edges. These maps are strong for county-scale patterns and comparisons, but they are not parcel surveys and should not be used to measure a property line or determine the exact acreage of a small site.
The 2025 maps also represent a particular mapping year. Construction, harvest, flooding, restoration, or agricultural changes after that observation period may not appear. Annual NLCD is validated, but like all remotely sensed classification products it has uncertainty. For a decision that affects a specific property or project, combine the maps with newer imagery, field information, local planning records, elevation data, and hydrology as appropriate.
Choosing the right Ashley County map for a task
Use the general land-cover view for an overall county profile
The full 2025 map works best when the goal is to show several cover types at once. It quickly communicates the eastern agricultural concentration, the broader forest presence across the central and western county, major wetland patterns, water features, and the relatively compact developed clusters. It is a good opening figure for a report or presentation before moving to a more specialized view.
Use the forest-and-farmland view for a clearer natural-versus-agricultural comparison
When forest and agriculture are the main subjects, the simplified map reduces competition from the developed-class palette and makes the patch structure easier to follow. It can support forestry education, agricultural context, habitat discussions, or a simple comparison of where the largest blocks of tree cover and cropland occur. Wetlands and water remain visible so that field and forest patterns are not separated from their drainage setting.
Use the impervious map to locate hard-surface concentration
The impervious map is the most direct view for pavement and rooftops. It is useful when you want to show that built surfaces are concentrated around Crossett, Hamburg, and road corridors rather than spread evenly across Ashley County. Remember that impervious percentage is not the same as population density, traffic volume, building height, or municipal extent.
Use the change map to select places for follow-up
The endpoint comparison is most useful as a screening tool. It identifies where a class difference is mapped between 1985 and 2025, letting you select areas for a closer look with annual records or historical imagery. It is less suitable for assigning a cause. A colored pixel tells you that the classification changed according to the map rules, not why the change happened.
Download the four Ashley County JPG maps
The download archive contains the four original JPG maps used for this page: the 2025 land-cover map, forest-and-farmland map, impervious-surface and developed-land map, and the 1985–2025 land-cover change map. Each source JPG is 2480×1754 pixels. Downloading the set is convenient when you need the full map frame rather than the smaller web preview.
Keep the title, legend, year, and source visible when possible. Those elements are especially important for the change and impervious maps because the same color can mean very different things across map types. If you crop a figure for a slide, preserve enough legend information that a reader can tell whether the graphic represents categorical land cover, impervious percentage, or endpoint change.
Frequently Asked Questions
What is the largest land-cover class in Ashley County?
Forest is the largest 2025 class at 36.16%. Agriculture is 24.75% and wetlands are 24.29%, so all three are important to the county pattern. Looking only at the top-ranked class would miss the extensive eastern farm blocks and the large amount of wetland cover shown across the county.
Where is agricultural land most concentrated?
The largest continuous agricultural area appears in the eastern part of Ashley County. Smaller farm patches occur in the central and northern portions as well. Wetlands and water features interrupt and border many eastern fields, so the farm pattern is better described as a broad agricultural area crossed by wet corridors than as one uninterrupted block.
Does the 15.41% class difference mean 15.41% of the county became developed?
No. The 15.41% value is the total share of cells with a mapped endpoint class difference between 1985 and 2025. The portion classified as changing to developed is 1.18%. Other parts of the total include forest-loss classification, agricultural loss, wetland difference, and other class differences.
Can this map be used to check zoning or buildability?
No. The maps describe surface cover at 30-meter raster resolution. They do not contain zoning, parcel ownership, deed restrictions, building rules, or a legal determination of developability. Check county or municipal planning records and parcel data for those questions.
What files are included in the download?
The ZIP contains four JPG files corresponding to the four map views on this page. They cover 2025 land cover, forest and farmland, impervious/developed land, and the 1985–2025 class-change comparison.
Map File Information
Ashley County land-cover JPG set
- Included Files: Use only the versions confirmed in the article and supplied images
- File Type: Use the confirmed download contents
- Intended Use: Printing, education, presentations, and map-based projects
Related Maps
- Arkansas County Arkansas Land Cover Map
- Following 75 County Shapes Across an Arkansas Map
- Albany County Land Cover Map
Sources and further reading
The primary land-cover source is MRLC Annual NLCD Data. The current U.S. Geological Survey product description is available through USGS Annual NLCD Land Cover.
For the scale of the raster cells, see the USGS explanation of Annual NLCD spatial resolution, which states that the products use 30-meter Landsat-based raster data. County boundaries can be cross-checked with U.S. Census Bureau TIGER/Line Shapefiles.
For county-specific environmental context, the Arkansas Game and Fish Commission Little Bayou WMA page describes forest conditions and Bayou Bartholomew access in Ashley County. The U.S. Forest Service study of natural presettlement features in the Ashley County area provides additional ecological background. These local sources add context but do not replace the NLCD classification shown in the maps.
Green Map creates custom-edited map images using open geographic data sources such as geoBoundaries, Natural Earth, OpenStreetMap, and government open data.
These maps are edited visual materials, not raw data files, and are provided for education, documents, presentations, and graphic reference.