Dale County’s 2025 land-cover pattern is not dominated by a single surface type. Forest is the largest class at 41.71%, but farmland, wetlands, developed areas, grassland, shrubland, and water break that forest into a varied landscape across southeastern Alabama. The four maps on this page separate those patterns so you can compare broad cover, forest and farmland, impervious surfaces, and mapped class differences from 1985 to 2025.
The page previews use WebP images for quick viewing, while the four original JPG maps are available in one download. That set is useful when you need a larger image for a report, classroom activity, presentation, or side-by-side county comparison rather than a small browser preview.
Table of Contents
A county shaped by forest, farmland, wetlands, and several developed centers
The general 2025 map gives the clearest overview. Forest accounts for 41.71% of Dale County, agriculture for 23.03%, wetlands for 15.59%, developed land for 11.79%, and grassland for 3.64%. The supporting forest-and-farmland summary also reports 3.54% shrubland and 0.62% water. Those numbers matter because the county is neither an almost continuous forest county nor an overwhelmingly agricultural one. Instead, wooded areas, farmed or open land, and wet corridors repeatedly meet each other.
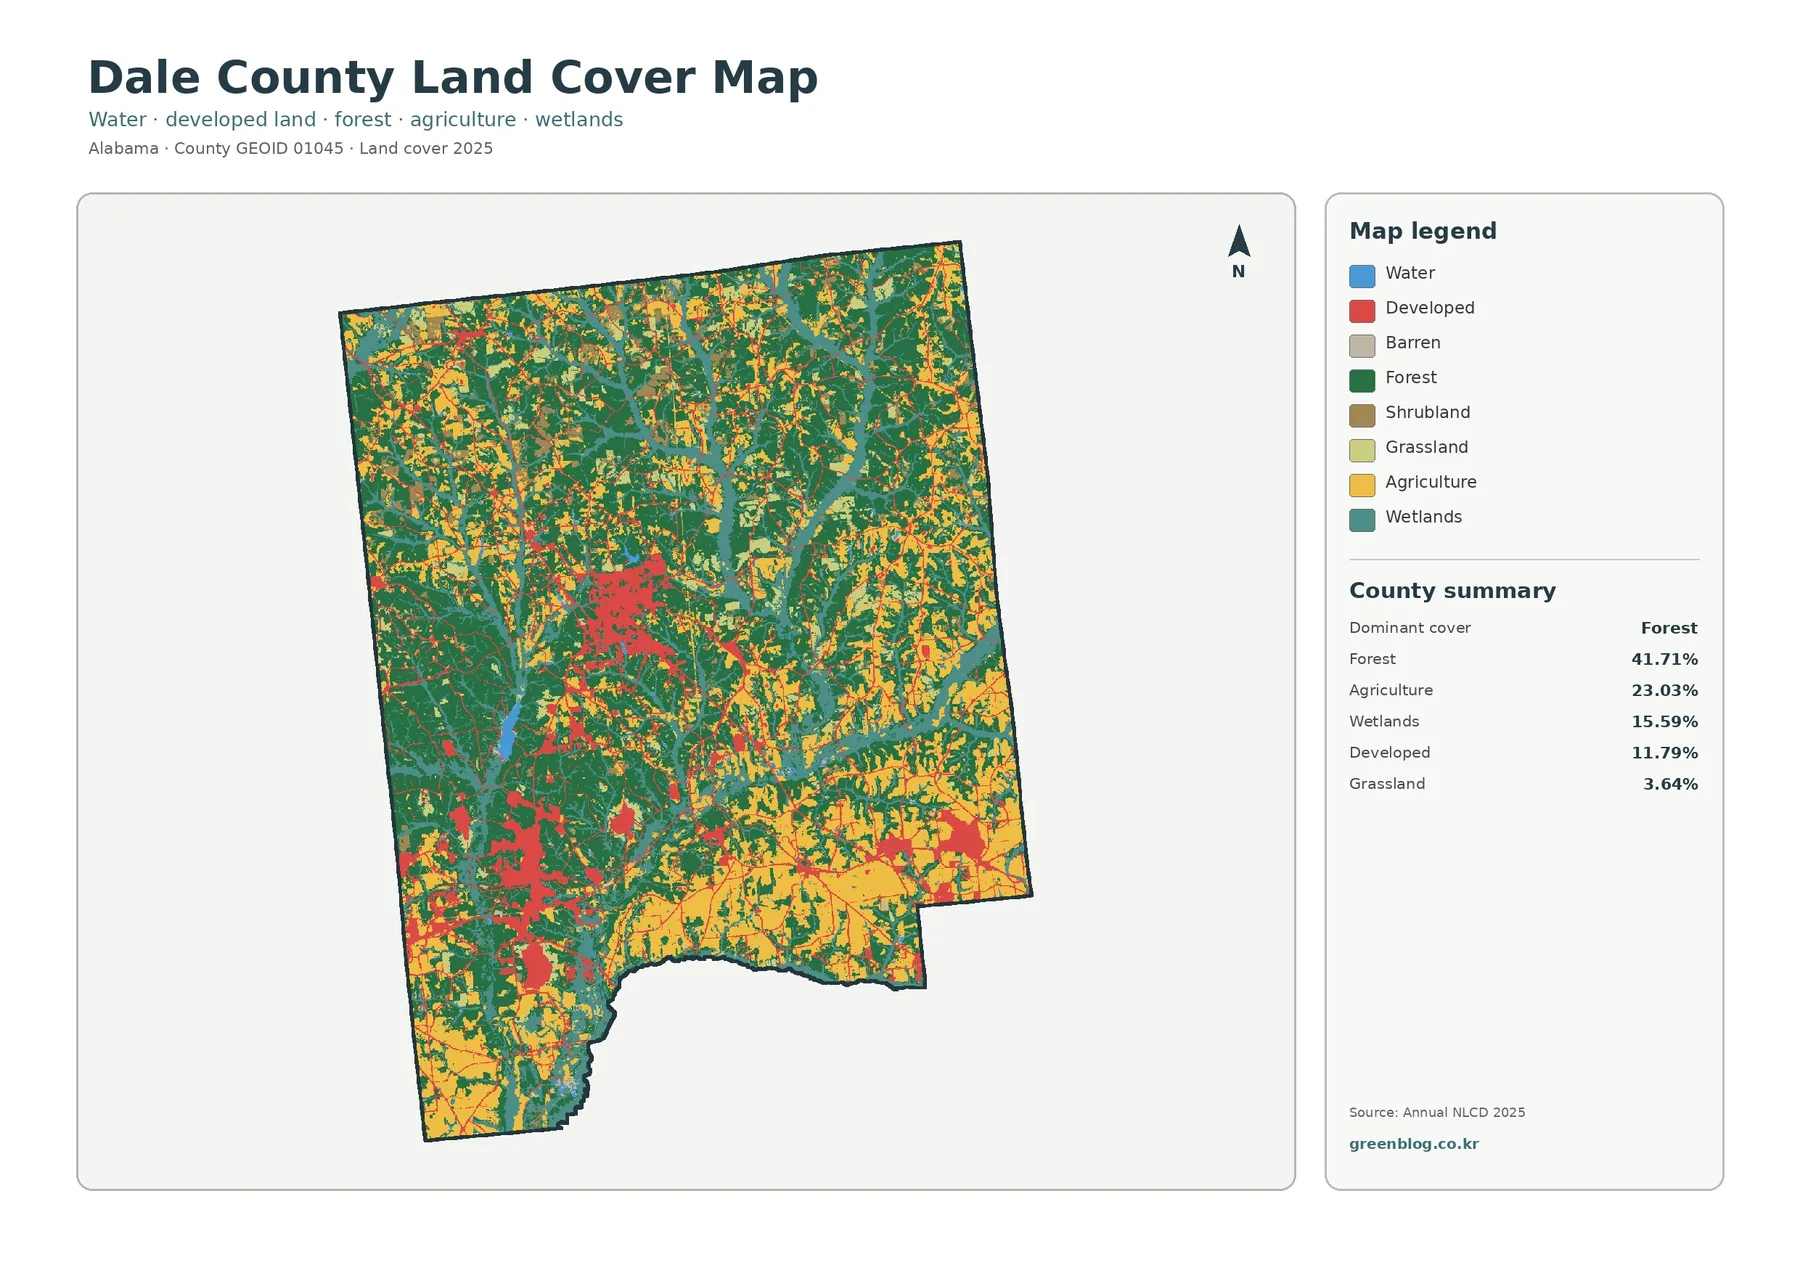
Large forest blocks are easy to see through much of the western, central, and northern portions of the county, although they are interrupted by agricultural patches and wetland corridors. Agriculture appears more frequently toward the eastern and southeastern parts of the map and also occurs in many smaller openings elsewhere. Wetlands form narrow, branching shapes through both wooded and farmed areas, while developed colors gather in a few stronger clusters rather than covering the county evenly.
That pattern fits the county’s broader setting without requiring the land-cover map to act as a city map. The Dale County Commission describes the county as part of southeastern Alabama’s Coastal Plain and the Wiregrass region. It lists Ozark as the county seat and includes communities such as Daleville, Level Plains, Newton, Ariton, Midland City, and others. When the land-cover image is compared with a separate road or place map, those settlement locations provide useful context for the concentrated developed footprints.
Hard surfaces reveal a much smaller footprint than the developed class
Impervious surface means pavement, rooftops, parking areas, and other surfaces that allow little rainfall to soak directly into the ground. Dale County’s mean impervious value is 2.54%, and only 1.19% of the county is mapped at 50% or more impervious. That is much lower than the 11.79% developed-cover figure because a developed land-cover class can include lawns, scattered trees, open areas, and low-density development along with buildings and pavement.
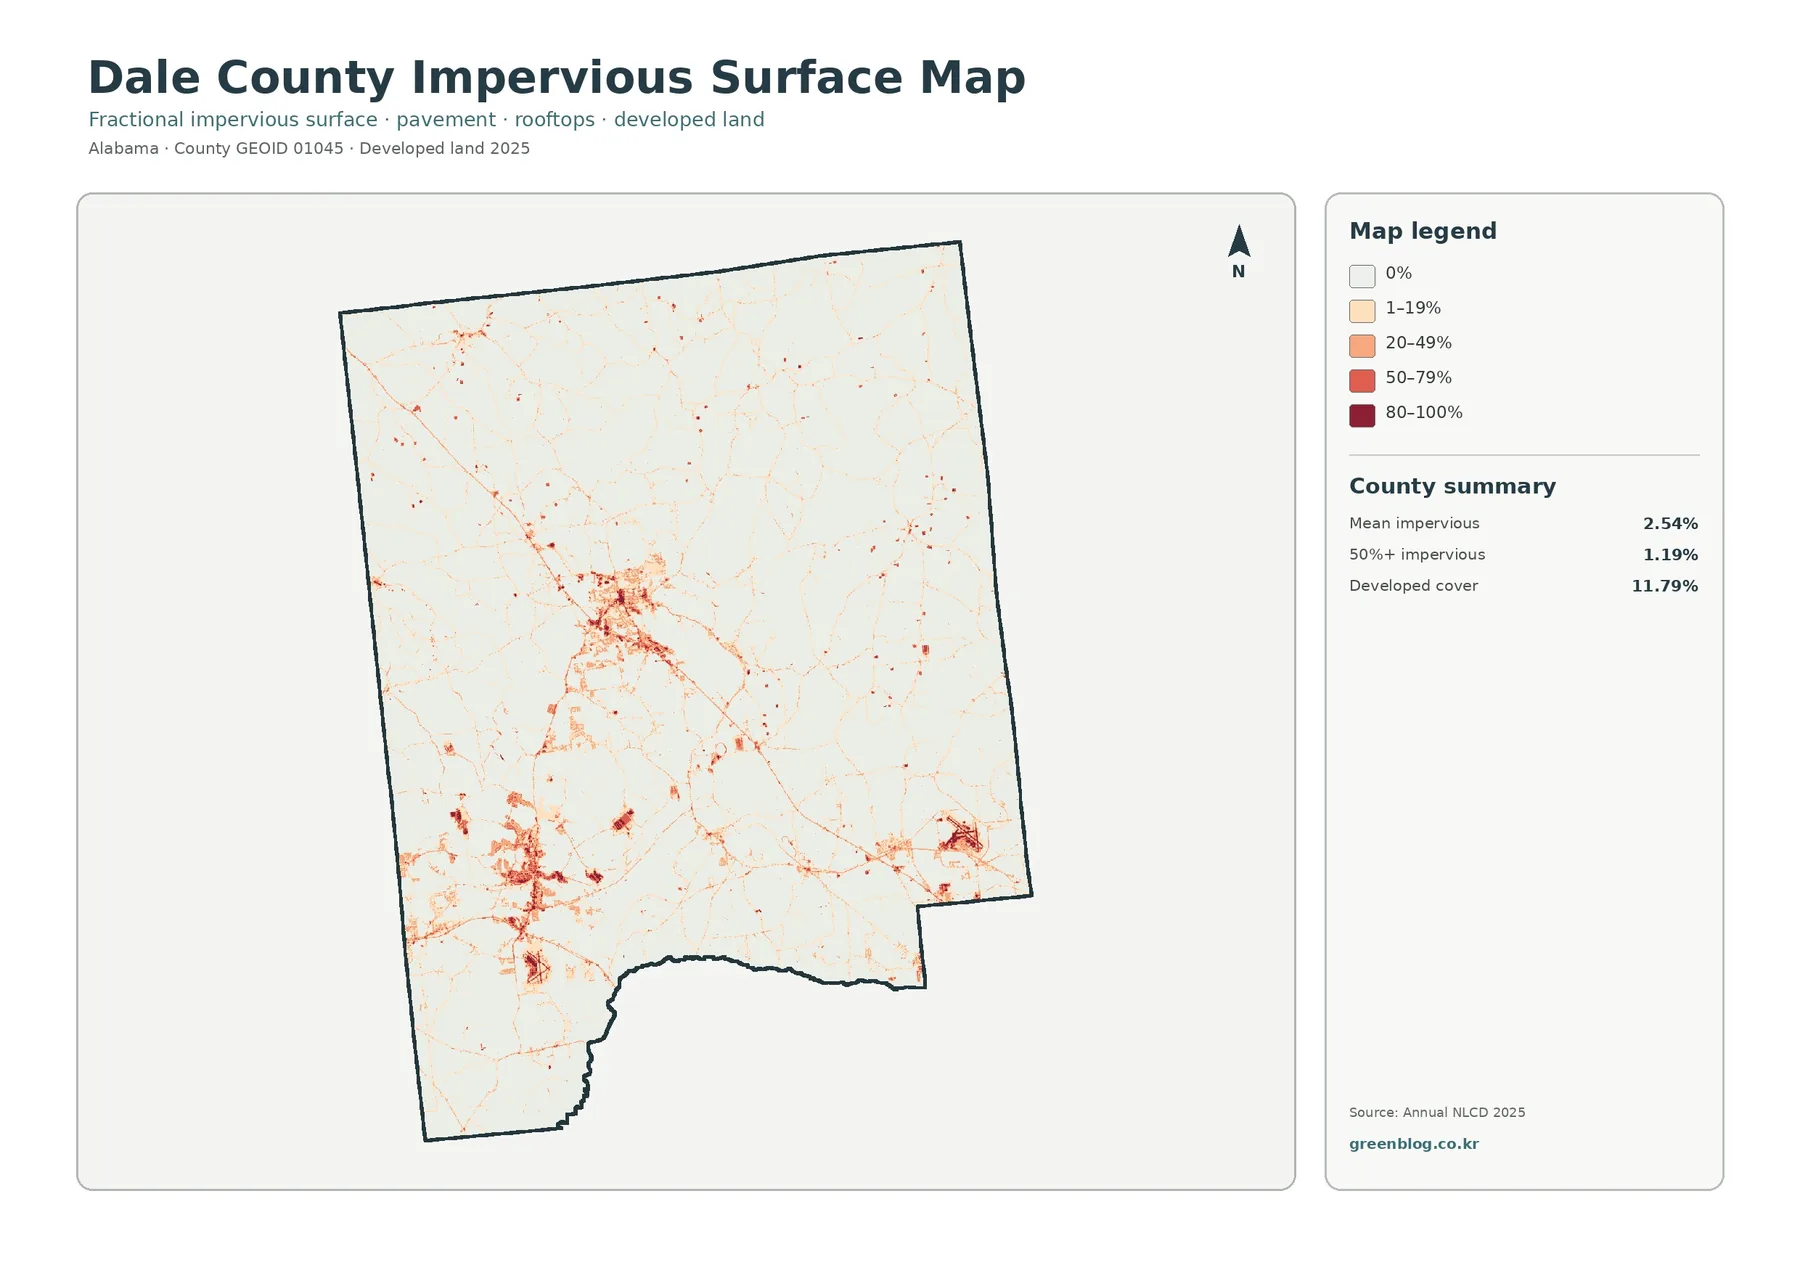
Most of the county appears very light on this map. Stronger orange and red areas are concentrated in central-western and southwestern clusters, with another noticeable concentration near the southeastern side and thin connecting lines elsewhere. Those linear traces resemble transportation corridors, but the map by itself does not prove that roads caused nearby development. It simply shows that hard surfaces and more developed places occupy specific corridors and centers while broad rural areas remain lightly impervious.
Local geography helps explain why it is useful to keep several kinds of developed places in mind. Dale County identifies Ozark and Daleville as communities bordering Fort Novosel, and the U.S. Army describes Fort Novosel as the Home of Army Aviation in the Wiregrass of southeast Alabama. A land-cover image cannot replace a military-installation boundary or municipal map, yet this context reminds the reader that a concentrated hard-surface footprint may include civic, residential, transportation, and military facilities rather than a single conventional urban core.
Forest and farmland form a patchwork rather than two separate halves
The forest-and-farmland view reduces the number of competing colors and makes the county’s working landscape easier to follow. Dark green forest remains extensive across the west and through broad sections of the interior. Cropland, pasture, and hay occur as both small openings and larger agricultural patches. The eastern and southern portions contain many of the brighter farm colors, but agriculture also appears throughout the northern half, so it would be misleading to describe one side of the county as entirely forest and the other as entirely farmed.
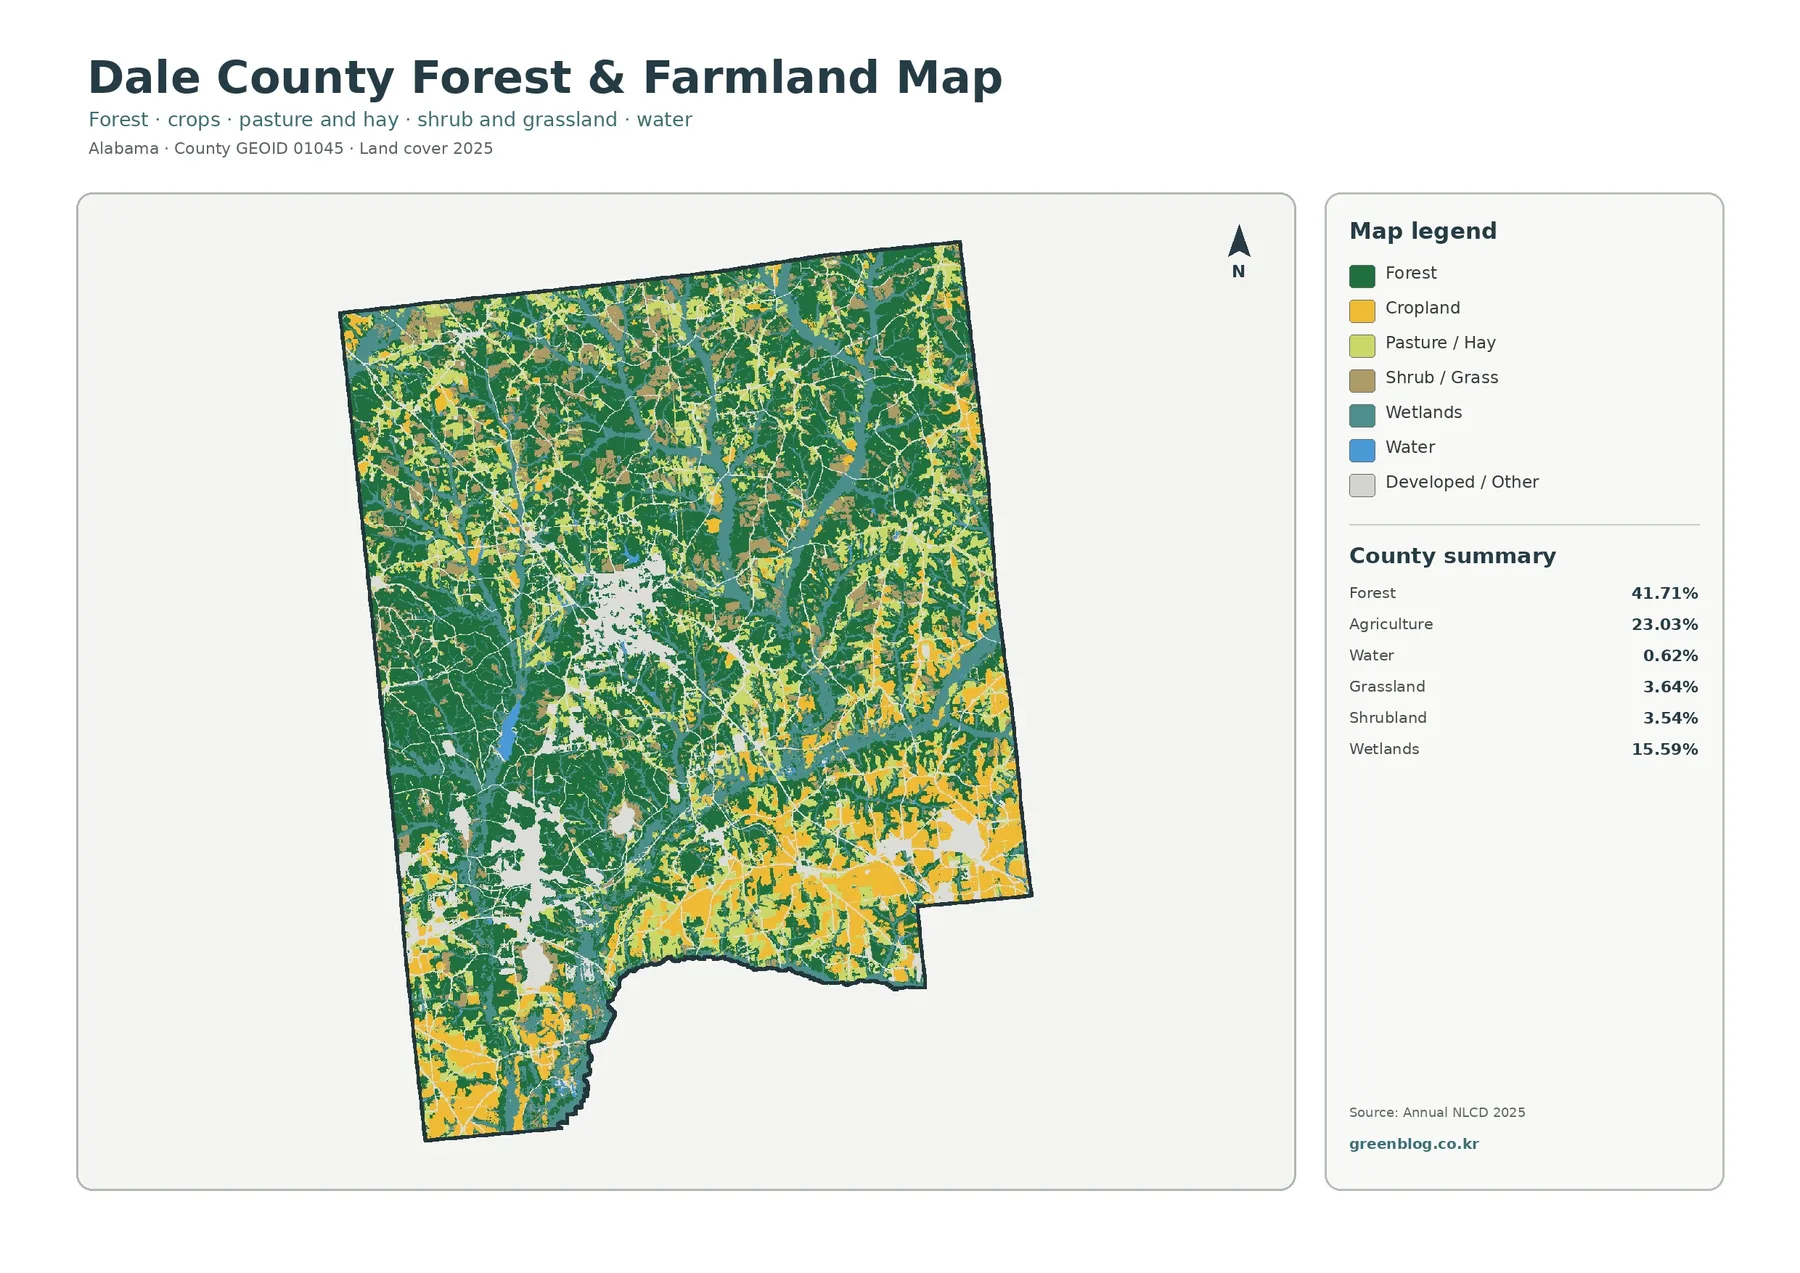
This map is especially helpful for examining edges. Many farm patches touch forest directly, and wetland colors thread between both kinds of cover. A student comparing habitat settings can use those edges to discuss where wooded and open environments meet. Someone preparing a county presentation can use the same view to show why a single countywide percentage does not describe the whole landscape: 23.03% agriculture can appear as many separate fields and open areas rather than one continuous agricultural belt.
The smaller classes should not be ignored simply because their percentages are low. Shrubland is 3.54%, grassland is 3.64%, and open water is 0.62% in the supplied summary. On a countywide map, a small percentage can still appear in numerous narrow or scattered locations. For close local work, the pattern of those cells matters more than the countywide number, and a higher-resolution local dataset may be needed if the feature of interest is smaller than the Annual NLCD grid.
The 1985–2025 comparison records class differences, not a complete history of every parcel
The change map compares mapped classes in 1985 and 2025. Its summary reports class differences across 32.99% of the county. Of the total county area, 2.39% is shown as changing to developed, 7.05% as forest loss, 4.07% as agricultural loss, and 18.20% as other class difference. Because the “other difference” category is the largest component, the colored map should not be read as if one single process explains all change.
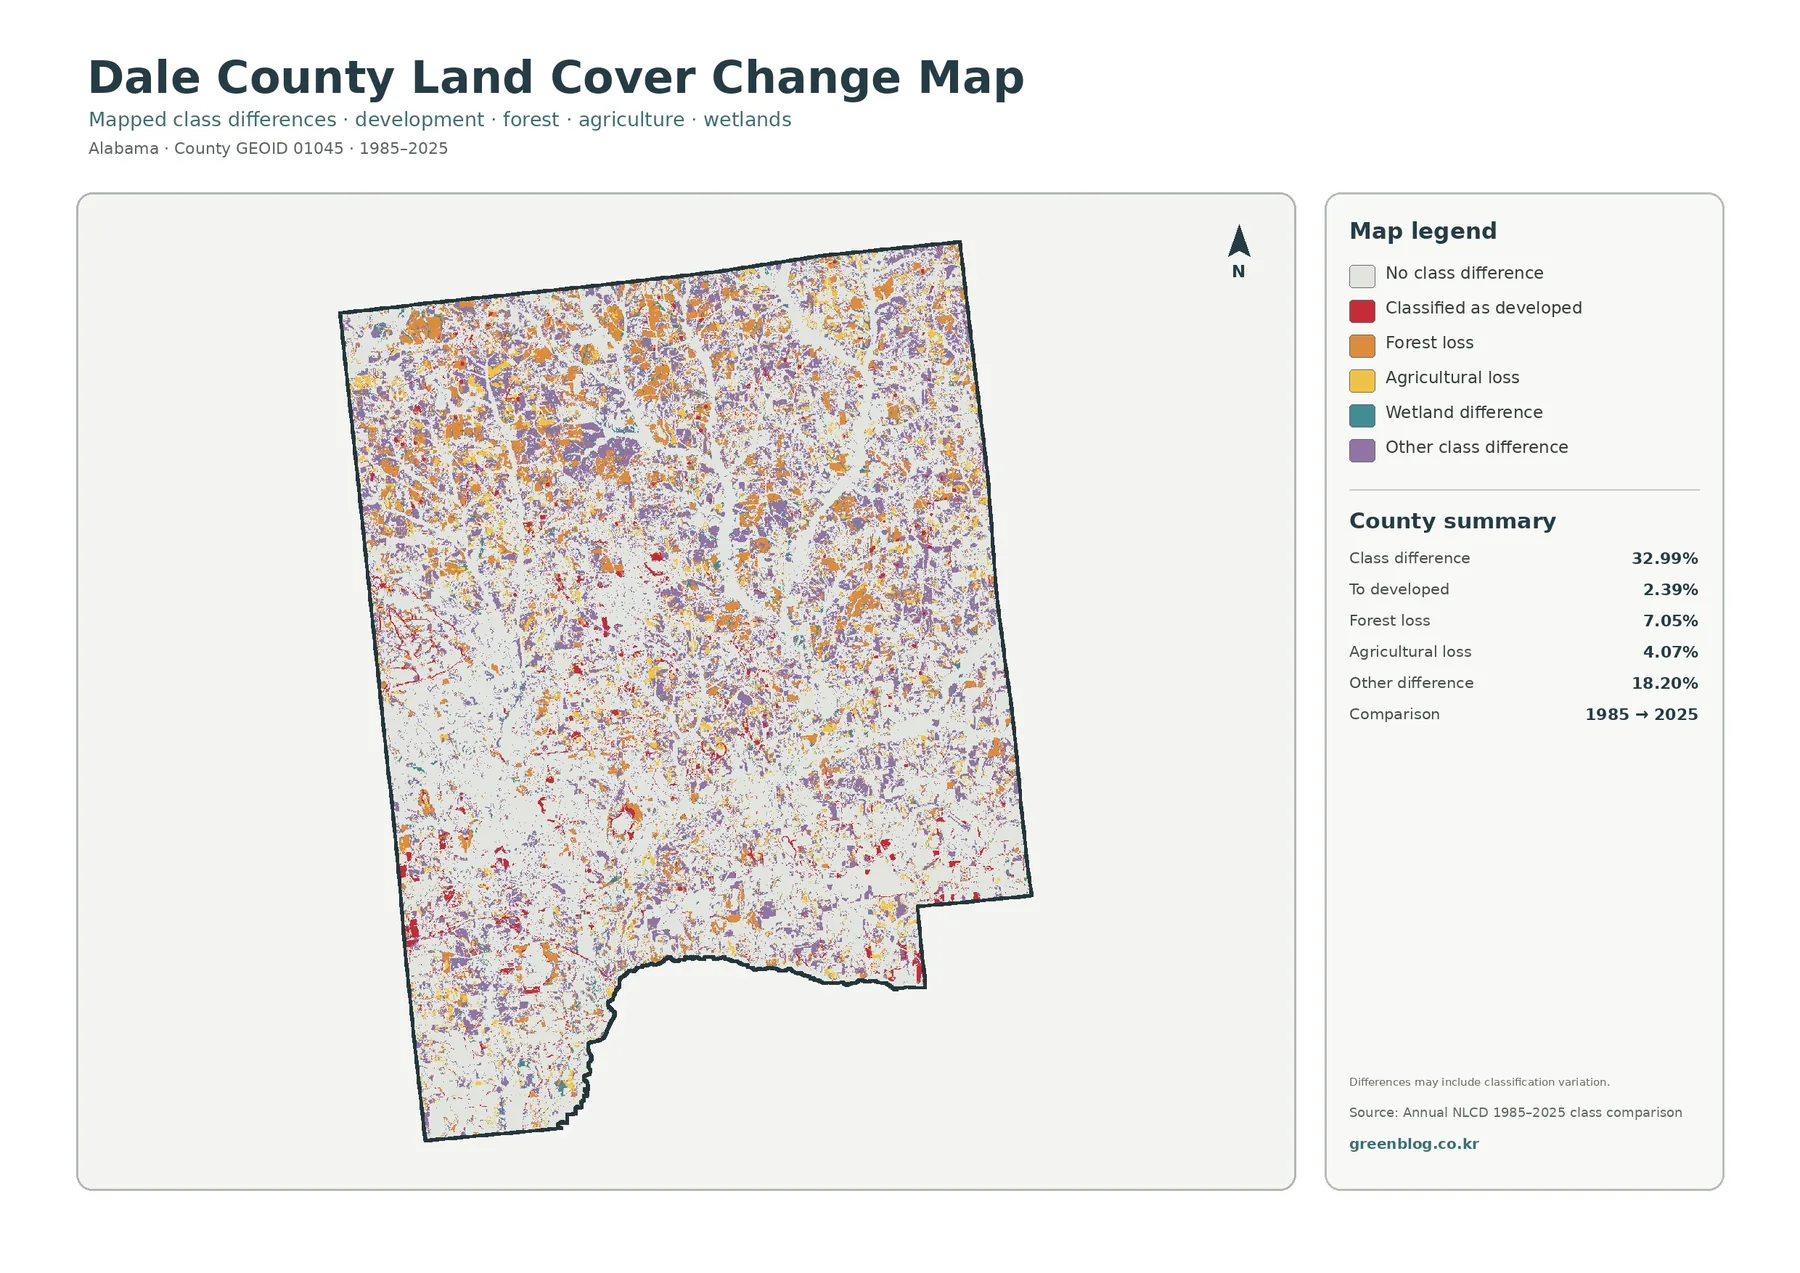
Color is scattered through the northern half, the central interior, and the south rather than forming one continuous front. Red areas classified as developed occur near some of the stronger settlement footprints, while orange forest-loss and yellow agricultural-loss cells appear in many smaller patches. Purple “other” differences are widespread. The map therefore works best as a screening tool that points to places worth comparing in more detail, not as a final statement about why a particular field, stand of trees, or developed site changed.
Classification uncertainty is another reason to be careful. A 30-meter raster cell can contain more than one real-world surface, especially along forest edges, narrow roads, small ponds, field margins, and mixed low-density development. A cell may be assigned a different dominant class even when the physical change on the ground is subtle. The map itself notes that class differences may include classification variation, so site-specific claims should be checked against aerial imagery, local records, or other dates in the Annual NLCD series.
Wetlands cover far more area than open water
One of Dale County’s most distinctive summary contrasts is 15.59% wetlands versus only 0.62% open water. The general map makes that difference easy to understand. Blue water occupies relatively small areas, while wetland colors branch across the county in narrow bands and larger low-lying patches. Looking only for lakes or broad water bodies would miss much of the mapped wet environment.
For watershed education, the wetland network can be compared with surrounding forest and farmland to see how wet cover crosses different parts of the landscape. That does not mean every colored wetland cell has the same vegetation, hydrology, legal status, or management rule. Land cover describes the surface category detected and classified by the dataset. It is not a wetland delineation, zoning layer, ownership map, or statement about whether development is allowed on a specific parcel.
Choosing the right Dale County map for the question
Use the general land-cover map when the goal is to introduce the county in one figure. It keeps forest, agriculture, wetlands, developed land, grassland, shrubland, barren land, and water in one legend and is the quickest way to compare their countywide arrangement. The forest-and-farmland version is better when the main question concerns wooded land, crop or pasture openings, and the boundaries where those covers meet.
The impervious map answers a different question. It separates the intensity of hard surfaces from the broader developed class, making it useful for runoff discussions, settlement-pattern comparisons, and presentations about built footprints. The change map shifts attention away from the present-day pattern and toward cells whose classifications differ between 1985 and 2025. Placing the present map beside the change map can help readers avoid confusing current forest or farmland with the history of how that cell was classified.
These maps can also support simple classroom exercises. Students can identify the dominant class, locate areas where forest and agriculture touch, find the strongest impervious clusters, and then check whether nearby areas show mapped class differences. For a county comparison, repeat the same questions with another Alabama county rather than comparing colors casually. Consistent questions, matching years, and the same product family make the comparison easier to explain.
Download the four Dale County JPG maps
The download archive contains four original JPG files: the 2025 general land-cover map, the forest-and-farmland map, the impervious/developed-land map, and the 1985–2025 land-cover-change map. Keeping the four files together makes it easier to switch from a broad county overview to a focused comparison without saving each browser preview separately.
For printing or slide use, keep the map’s original aspect ratio so the legend and county outline are not distorted. If several maps are used in one report, retain the map title and observation years near each image. The source JPG dimensions supplied with this package are 2480 × 1754 pixels, which are larger than the WebP body previews, although the asset manifest does not label them as meeting a formal A3 high-resolution reference.
Scale, classification, and date matter when reading the maps
Annual NLCD is a raster product derived from remotely sensed data. USGS documents the Collection 1.2 products at 30-meter spatial resolution, so each grid cell represents an area on the ground rather than a surveyed parcel boundary. Small buildings, narrow streams, thin tree lines, and tiny fields may be generalized or combined with the surrounding cover. That level of detail is appropriate for regional and county patterns but not for precise parcel measurement.
Mixed pixels are common near boundaries between surfaces. A single cell may contain trees, grass, pavement, and a building, yet the land-cover product still needs to assign a class based on its classification method. Fractional impervious data handle hard surface differently by estimating a percentage, which is why the impervious map can add detail inside areas that the general map simply labels as developed.
The dates are equally important. The general maps describe 2025 conditions as represented by the supplied Annual NLCD data, while the change map compares 1985 with 2025. Construction, forestry work, crop rotation, storm effects, or land management after the observation period may not appear yet. If a current site decision depends on recent conditions, use these maps as background and check a newer local source, current imagery, and the relevant agency records.
Frequently Asked Questions
What is the largest land-cover class in Dale County?
Forest is the largest 2025 class at 41.71%. Agriculture accounts for 23.03%, wetlands 15.59%, and developed cover 11.79%. These are countywide mapped percentages, not parcel-level measurements.
What files are included in the Dale County download?
The ZIP contains four original JPG maps: general land cover, forest and farmland, impervious surface and developed land, and the 1985–2025 land-cover change comparison.
Can this land-cover map be used to determine zoning or legal wetland status?
No. Land cover classifies what is on the surface, such as forest, agriculture, water, wetlands, or developed land. Zoning, property ownership, regulated wetlands, and building permissions require separate official records.
Map File Information
Dale County Land Cover Maps — 4 JPG Files
- Included Files: Use only the versions confirmed in the article and supplied images
- File Type: Use the confirmed download contents
- Intended Use: Printing, education, presentations, and map-based projects
Related Maps
- Autauga County Alabama Land Cover Map
- Baldwin County Alabama Land Cover Map
- Barbour County Alabama Land Cover Map
Sources and references
- MRLC Annual NLCD — Annual land-cover product information and data access, including the 1985–2025 series.
- USGS Annual NLCD Collection 1.2 Land Cover — 30-meter raster resolution, product format, and land-cover classification information.
- Dale County Commission — Official county background, Wiregrass and Coastal Plain setting, county seat, and community information.
- U.S. Army Aviation Center of Excellence and Fort Novosel — Official context for the large Army Aviation installation in the Wiregrass area.
- Alabama Cooperative Extension System — Dale County — Local agriculture, forestry, wildlife, horticulture, and community Extension resources.
Green Map creates custom-edited map images using open geographic data sources such as geoBoundaries, Natural Earth, OpenStreetMap, and government open data.
These maps are edited visual materials, not raw data files, and are provided for education, documents, presentations, and graphic reference.