Baxter County in north-central Arkansas is dominated by forest, but the county is not a uniform block of green. The 2025 land-cover summary reports 66.49% forest, 16.44% agriculture, 8.41% developed cover, and 6.45% water. On the map, broad forested areas occupy much of the south and east, large water bodies cut into the eastern side, and a stronger concentration of developed land appears around the Mountain Home area. Agriculture is more frequent through the central, western, and northern parts of the county, where it breaks the forest into a more varied pattern.
This page brings together four views of the same county: current land cover, forest and farmland, impervious surface and developed land, and a 1985–2025 land-cover comparison. The four original JPG maps are available in one download below. They are useful when you need a countywide visual for a classroom, presentation, environmental overview, watershed discussion, or a first comparison of where forest, farming, water, and built surfaces are concentrated.
Table of Contents
Baxter County at a glance: forest first, with water and settlement shaping the pattern
Forest is the clearest countywide feature. At 66.49%, it covers roughly two-thirds of the mapped area, and the largest continuous-looking forest blocks are visible across the southern extension and much of the eastern half. The pattern becomes more mixed around the county’s central and western areas. There, agricultural cover appears in many patches and developed land forms a more obvious cluster near Mountain Home. Reading the county this way is more useful than describing it as simply rural or forested, because the maps show distinct zones with very different surface cover.
The 2025 land-cover map shows a strong forest-water relationship
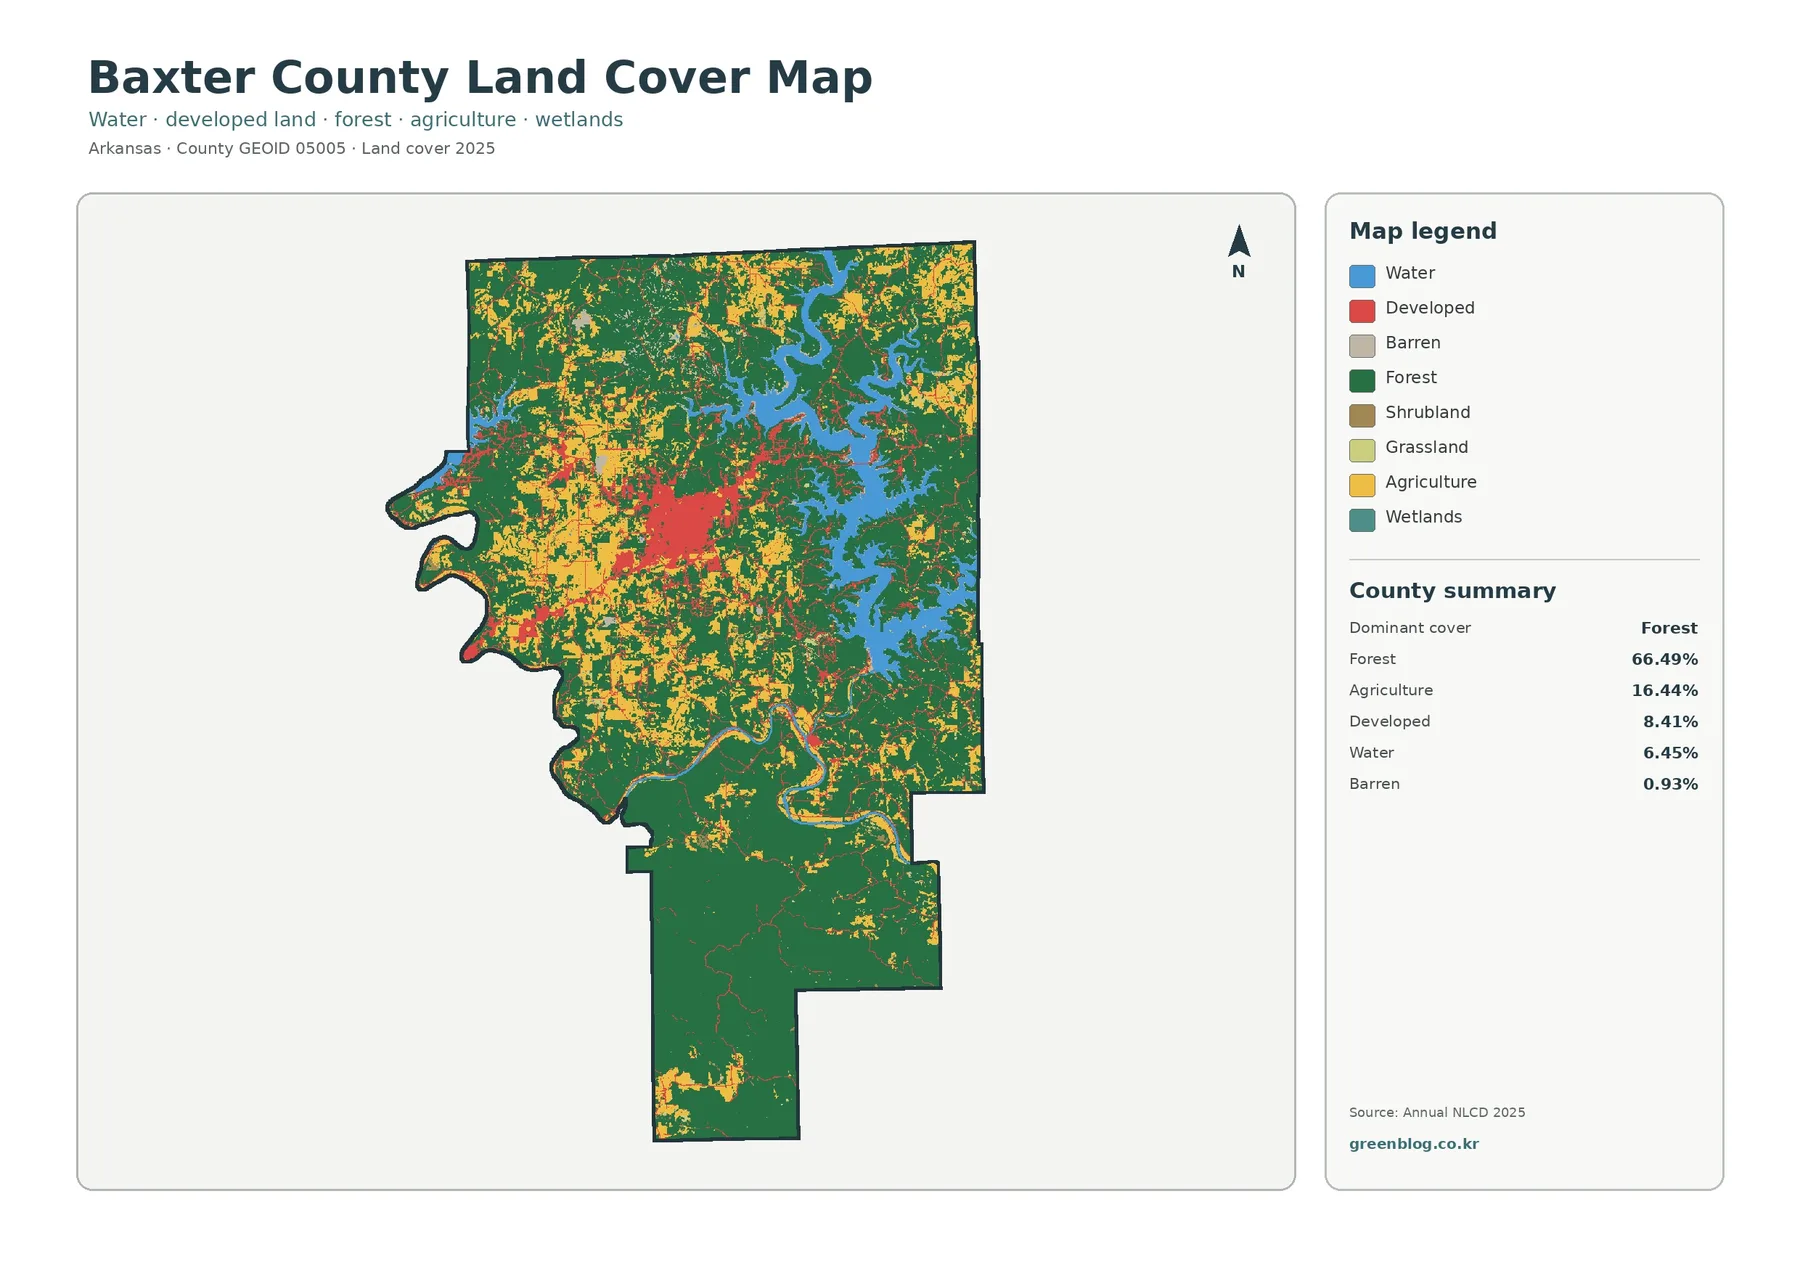
The general map is the best starting point because it keeps all of the main classes in one view. Dark green forest covers a large share of the county, especially in the south and east. Yellow agricultural cover is more broken and frequent toward the central and western areas. Red developed cover forms its largest concentration near the middle of the county, slightly to the west, matching the general location of Mountain Home. Smaller red traces extend away from that concentration, which makes the developed pattern look connected rather than scattered randomly across the county.
Blue water is especially prominent in the east and northeast, where the shoreline is highly irregular. Baxter County’s official government site describes the county as lying between Bull Shoals Lake and Norfork Lake and also identifies the White River and North Fork River as major local water features. The land-cover preview does not label individual lakes or river branches, so it is better to use those official names as geographic context rather than assign a name to every blue arm visible in the image. What the map clearly establishes is that major water bodies occupy a meaningful part of the county and meet extensive forest along long shorelines.
Forest and farmland are easier to compare in the simplified map
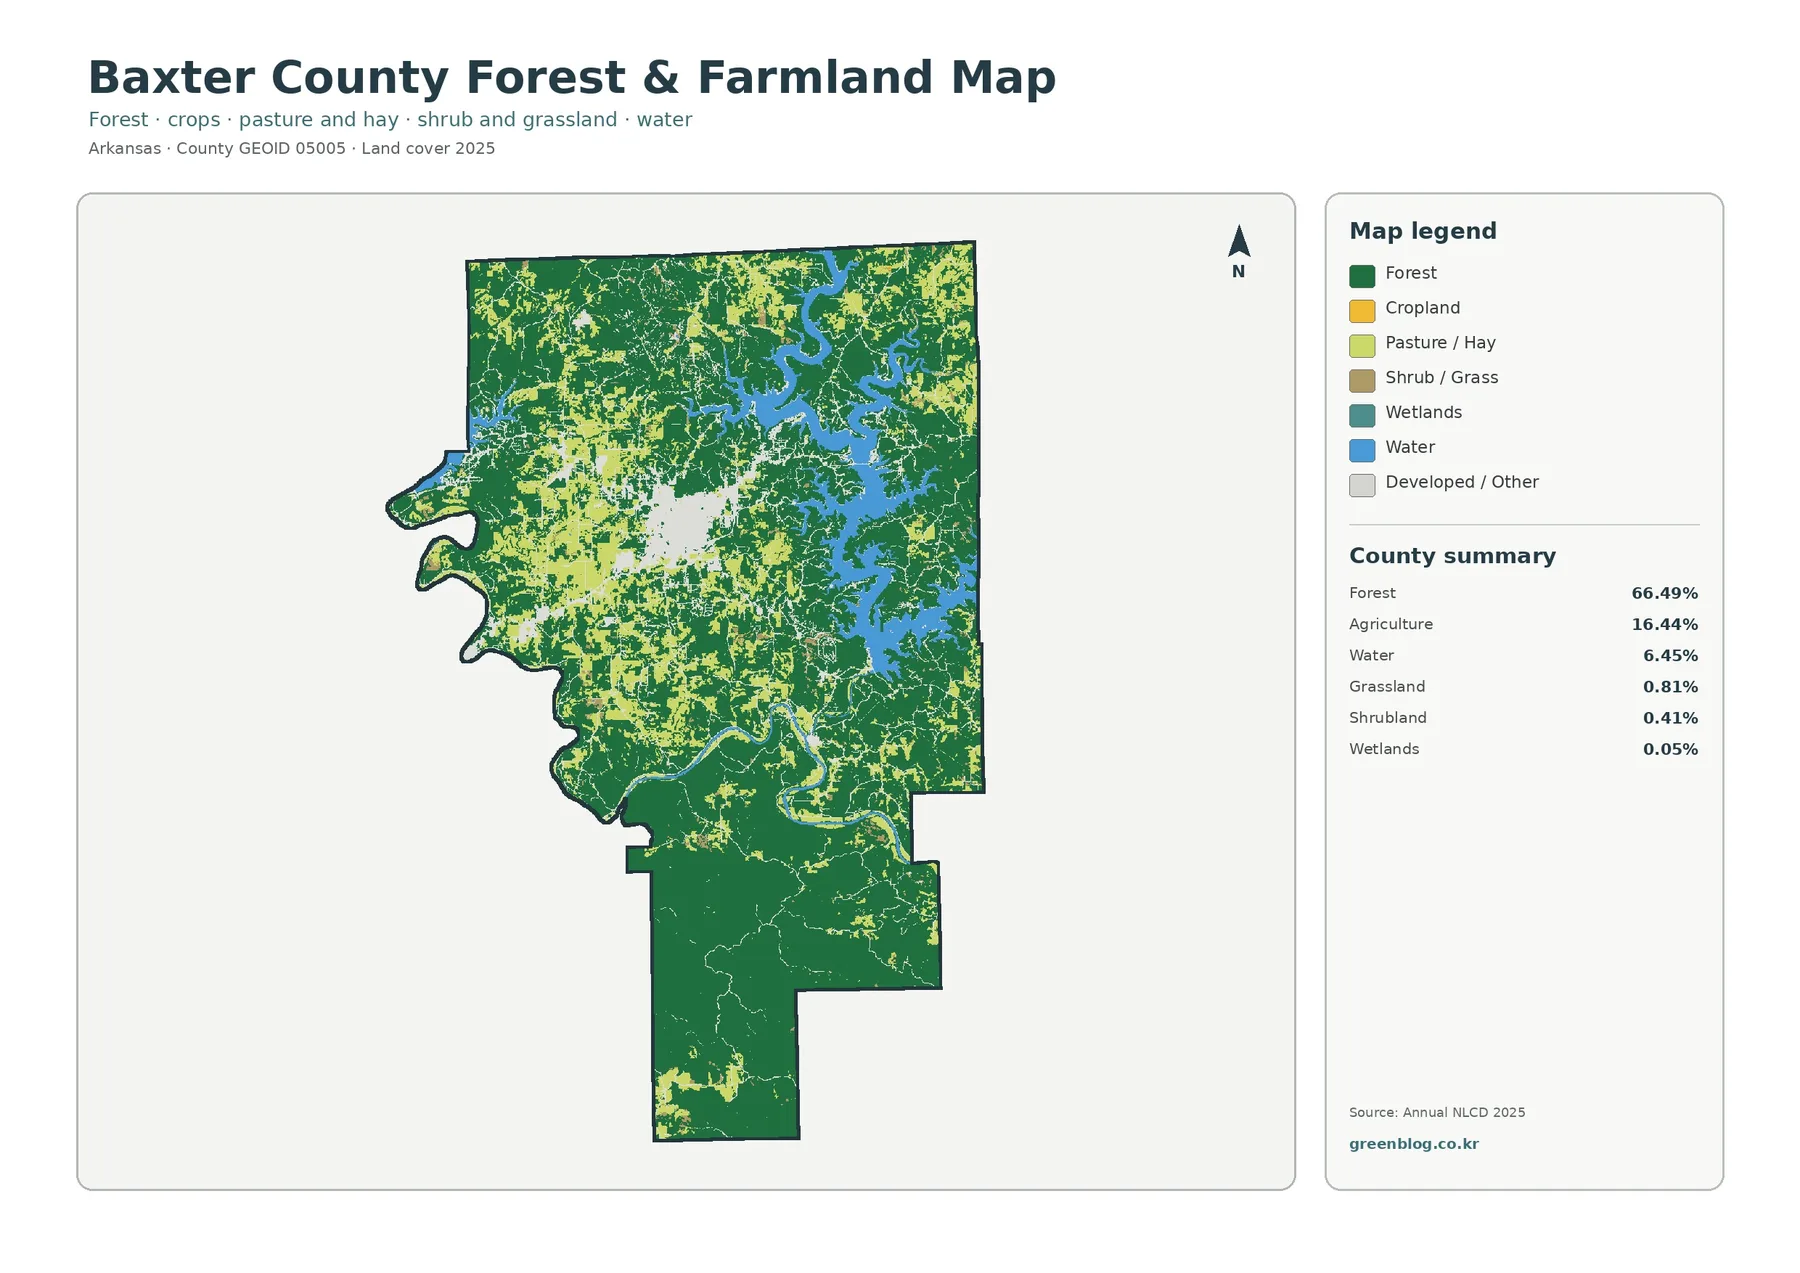
The forest-and-farmland map removes some of the visual competition among classes and makes the county’s 66.49% forest share immediately clear. Large green areas dominate the southern section and remain widespread around the eastern water bodies. Agricultural colors are much more frequent in the central and western portions, where they appear as a mosaic inside the broader forested landscape. This is a useful view for anyone trying to explain where open agricultural cover is concentrated without losing the surrounding forest context.
Impervious surface pinpoints the developed core more sharply
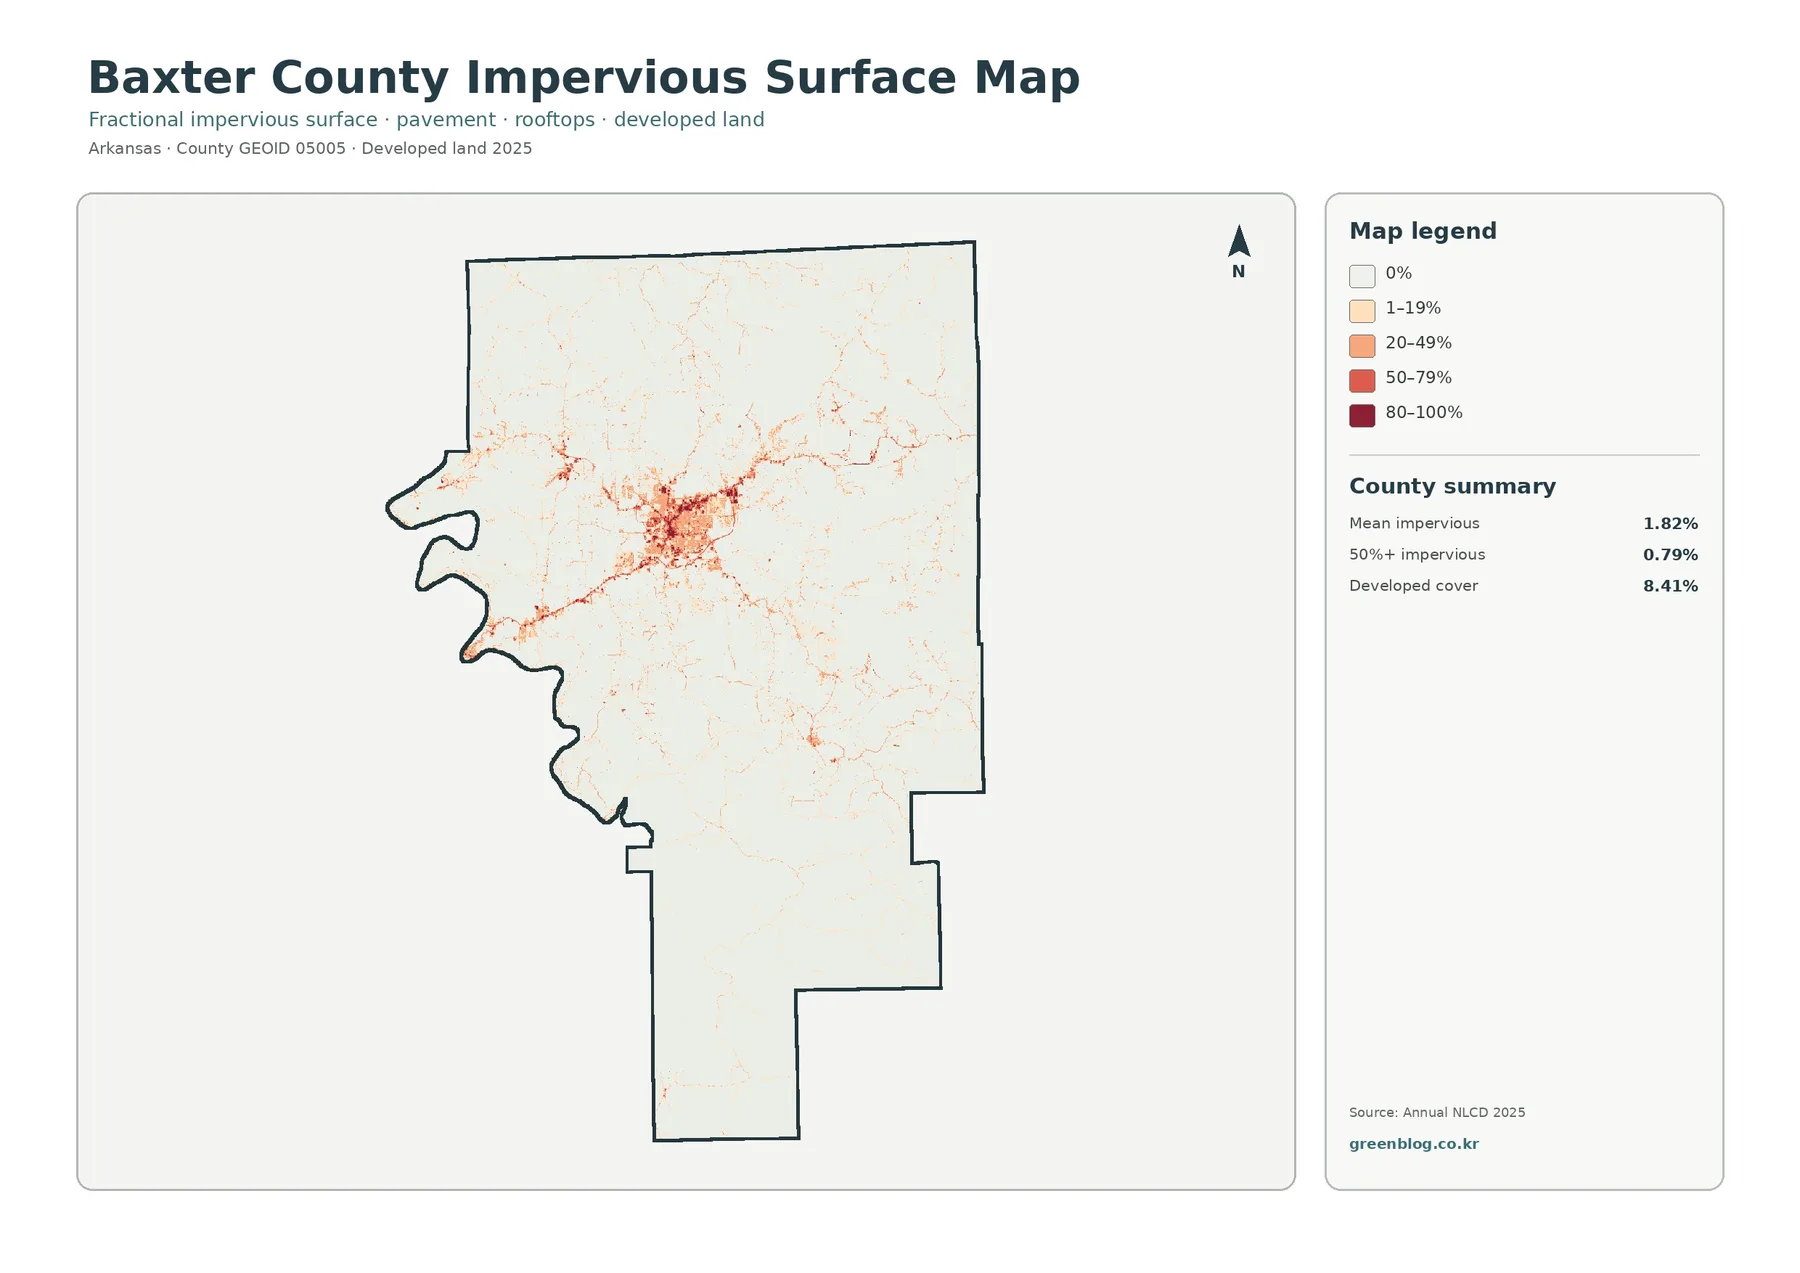
Impervious surface refers to hard surfaces such as pavement, parking areas, and rooftops that do not absorb water as readily as soil or vegetation. Baxter County has a mean impervious value of 1.82%, and 0.79% of the county is mapped at 50% or greater imperviousness. Those countywide averages are low, yet the map makes the central developed concentration easy to find. The strongest cluster is around Mountain Home, with thinner lines extending outward along built corridors.
The 1985–2025 comparison highlights where classifications differ
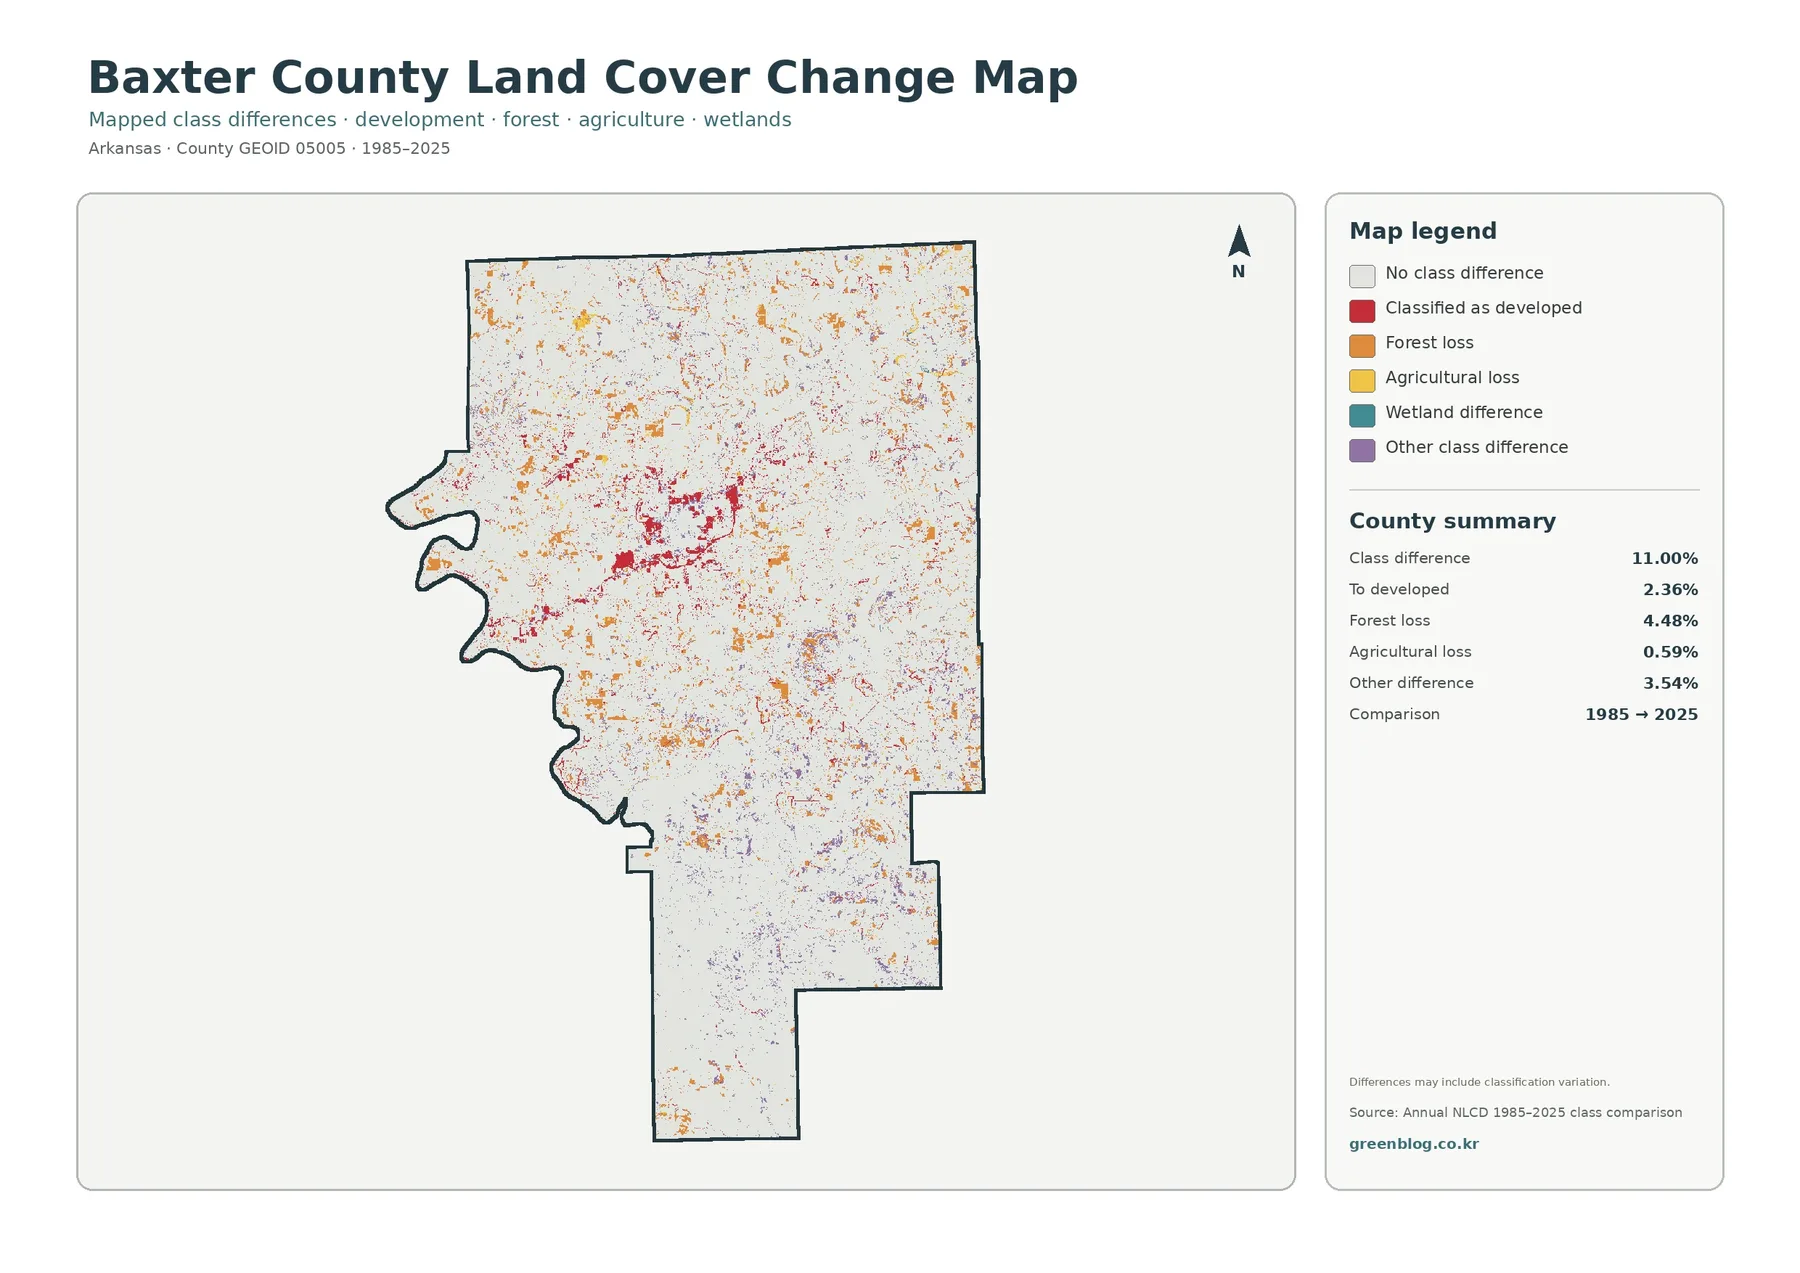
The change map compares the 1985 and 2025 classifications and marks the cells that differ between those two endpoints. The county summary reports a class difference of 11.00%. Within that total, 4.48% is grouped as forest loss, 2.36% as change to developed, 0.59% as agricultural loss, and 3.54% as other difference. The map also includes a wetland-difference category. Because the supplied summary does not give a separate percentage for that category, no additional wetland figure should be inferred.
The term forest loss needs careful interpretation. A cell classified as forest in one endpoint and another class in the other does not automatically prove permanent clearing. Timber harvest followed by regrowth, a real conversion to another cover type, a shift in the mapped class boundary, or classification differences can all affect the comparison. The same caution applies to other change categories. The map is strongest when used to locate areas that deserve a closer look, not when used alone to explain why a change occurred.
What 30-meter raster data can and cannot show
Annual NLCD is a raster dataset derived from Landsat imagery at a 30-meter spatial resolution. In simple terms, the landscape is divided into grid cells about 30 meters across, and each cell receives a representative land-cover class or a measured fraction such as impervious surface. That scale is appropriate for countywide comparison, but it simplifies features smaller than a cell. Narrow roads, small buildings, tiny ponds, and thin stream channels may be averaged with the surrounding cover.
Download the four Baxter County JPG maps
The download ZIP contains four original JPG files: the 2025 land-cover map, forest and farmland map, impervious surface and developed-land map, and the 1985–2025 land-cover change map. Each JPG is 2480×1754 pixels. Use the originals when you need a larger image than the WebP previews shown in the article.
Keep the title, legend, and comparison year visible when placing the maps in documents or slides. This is especially important for the change map, where the 1985 and 2025 endpoints define the meaning of the colors. The maps are appropriate for county-scale reference and presentation, but they are not parcel surveys, engineering plans, or legal boundary documents.
Frequently Asked Questions
What is the dominant land cover in Baxter County?
Forest is the dominant 2025 class at 66.49%. Agriculture is 16.44%, developed cover is 8.41%, and water is 6.45%. The distribution is uneven: forest is especially extensive in the south and east, while agriculture and development are more noticeable through the central and western parts of the county.
Does 1.82% mean only 1.82% of the county is developed?
No. Developed cover is 8.41%. The 1.82% figure is the mean impervious fraction across the county. Impervious surface measures hard surfaces such as pavement and rooftops, while the broader developed class can also include lower-density areas with vegetation mixed among buildings and roads.
Does the 11.00% class difference mean 11% of Baxter County was urbanized?
No. The 11.00% figure includes all mapped endpoint class differences between 1985 and 2025. The summary separately reports 2.36% changed to developed, 4.48% forest loss, 0.59% agricultural loss, and 3.54% other difference, with a wetland-difference class also shown on the map.
Map File Information
Baxter County Land Cover Maps — 4 JPG Files
- Included Files: Use only the versions confirmed in the article and supplied images
- File Type: Use the confirmed download contents
- Intended Use: Printing, education, presentations, and map-based projects
Related Maps
- Arkansas County Arkansas Land Cover Map
- Ashley County Arkansas Land Cover Map
- Following 75 County Shapes Across an Arkansas Map
Sources and references
The mapped land-cover products and annual data access are available through MRLC Annual NLCD Data. The supplied Baxter County map package identifies Annual NLCD 2025 as the source for the current-cover summaries and uses 1985 and 2025 as the endpoints for the change comparison.
Definitions for the land-cover classes can be reviewed through the USGS Annual NLCD Land Cover Classification. USGS also explains that Annual NLCD is a 30-meter raster product in its Annual NLCD spatial-resolution guidance.
Local context on Mountain Home, the county’s rugged terrain, Bull Shoals Lake, Norfork Lake, the White River, and the North Fork River is available from the official Baxter County Government website. These local references help describe the county setting but do not replace the land-cover classification itself.
Green Map creates custom-edited map images using open geographic data sources such as geoBoundaries, Natural Earth, OpenStreetMap, and government open data.
These maps are edited visual materials, not raw data files, and are provided for education, documents, presentations, and graphic reference.