Echols County occupies a long strip along Georgia’s southern edge, where the state line with Florida provides an easy orientation reference but the interior is much less urban than a typical county map might suggest. The supplied map set separates four kinds of information: the county outline with selected roads and place labels, a simplified settlement view, a water map built around the Alapaha and Suwannee systems, and an elevation map showing a county-wide range of about 22 to 54 meters. A ZIP containing four high-resolution A3 JPG files is available for download on this page, so the maps can be viewed online first and then saved for printing, classroom work, or a presentation.
Statenville is the county seat, and the general map marks the courthouse area in the western half of the county. Other labels include Haylow near the north, Needmore along the central east-west road, Melrose near the southwest edge, and Fargo just beyond the eastern side. Those names are widely spaced, which is important: the map is not showing a continuous chain of towns. Much of the county is better understood through the roads that connect a few reference points and through the river corridors that become much more visible on the water and elevation views.
Table of Contents
A Long Southern Border and an Irregular Northern Edge
The basic county map is the best place to establish shape and direction. Echols County has a stepped western side, a broad northern boundary with several bends, and a long southern line that follows the Georgia–Florida border. The county then extends a considerable distance eastward before the boundary turns around the southeastern end. A small locator inset places the county at the bottom of Georgia, reinforcing the same orientation without requiring a separate statewide map.
Road lines are more noticeable in the western portion, where several routes meet near the courthouse symbol. Farther east, the central road continues past Needmore toward the county edge while the number of labeled places declines. Haylow provides a northern reference and Melrose a southwestern one; Fargo sits outside the eastern boundary and helps show where the county ends. The wide gaps between those labels are part of what makes the map useful: a reader can see the broad arrangement without a dense layer of street names covering the county outline.
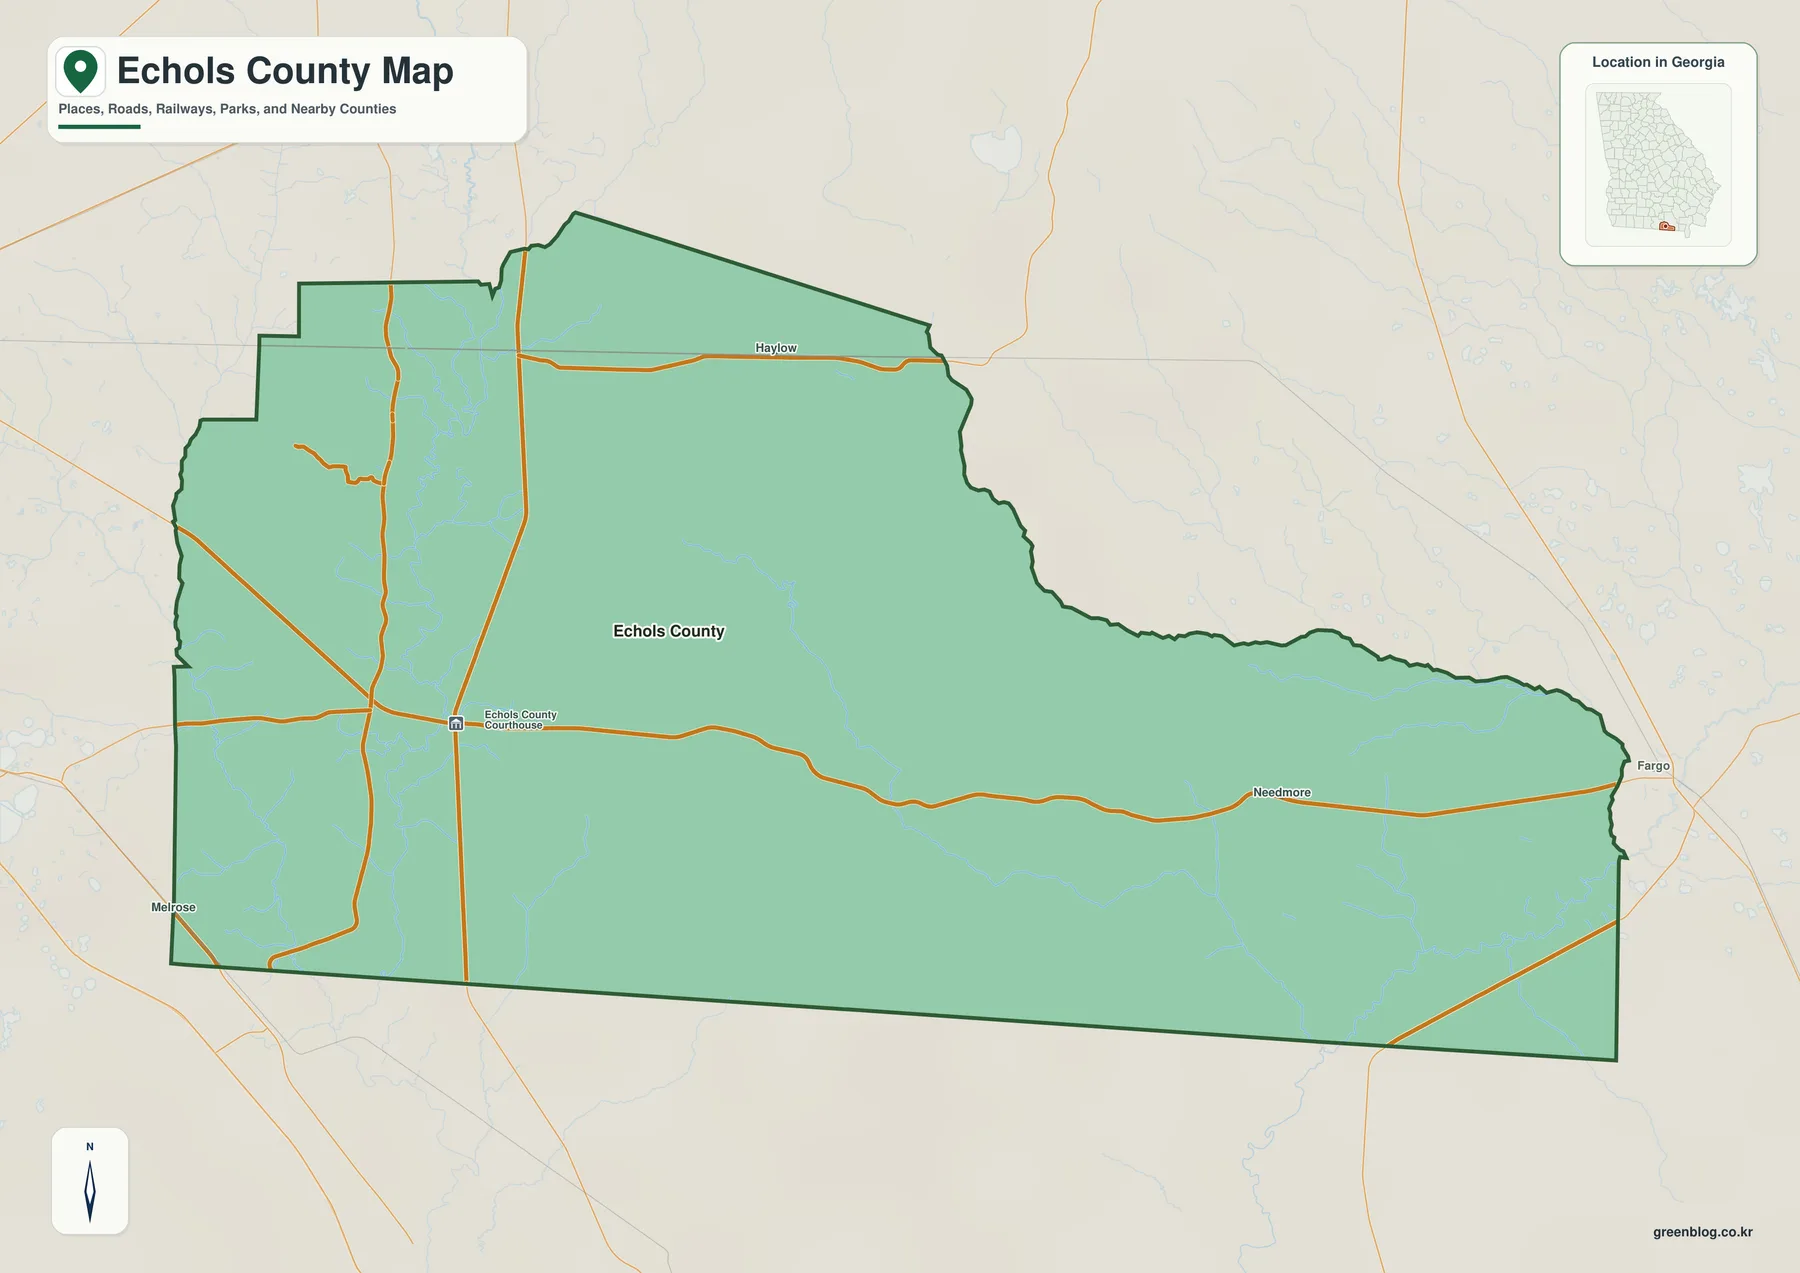
This is a county-scale reference rather than a navigation map. It does not attempt to show every local road, private drive, address, or parcel line. For locating the county seat area, comparing the western and eastern halves, or explaining the county’s unusual elongated shape, that simplicity is an advantage. A turn-by-turn route or property boundary question requires a more detailed source.
Using Haylow, Needmore, and the Courthouse as Reference Points
The labeled communities work best as orientation points rather than as a measure of urban size. Haylow lies toward the upper part of the map, Needmore sits along the main east-west route through the middle, and Melrose appears near the southwest corner. The courthouse symbol is farther north than Melrose and near a cluster of crossing road lines. Starting from that symbol and following the central road toward Needmore gives a simple mental route across the county without relying on coordinates.
The eastern half looks much more open because fewer names and roads are selected for display. That should not be interpreted as empty land, nor does it mean that the map contains every recognized community. The general map is selective by design. Its strongest use is to show the relative position of the named points and the direction of the larger roads inside the county boundary.
Why the Settlement View Contains So Few Markers
The settlement-distribution map is intentionally more abstract than the general county map. It highlights one ranked reference point inside the county and places neighboring county names around the frame. Lowndes County is shown to the west, while Clinch County and Lanier County appear to the north. That regional framing is more important here than the number of local place labels. The map is useful when the question is “where does Echols County sit among nearby counties?” rather than “where is every named community?”
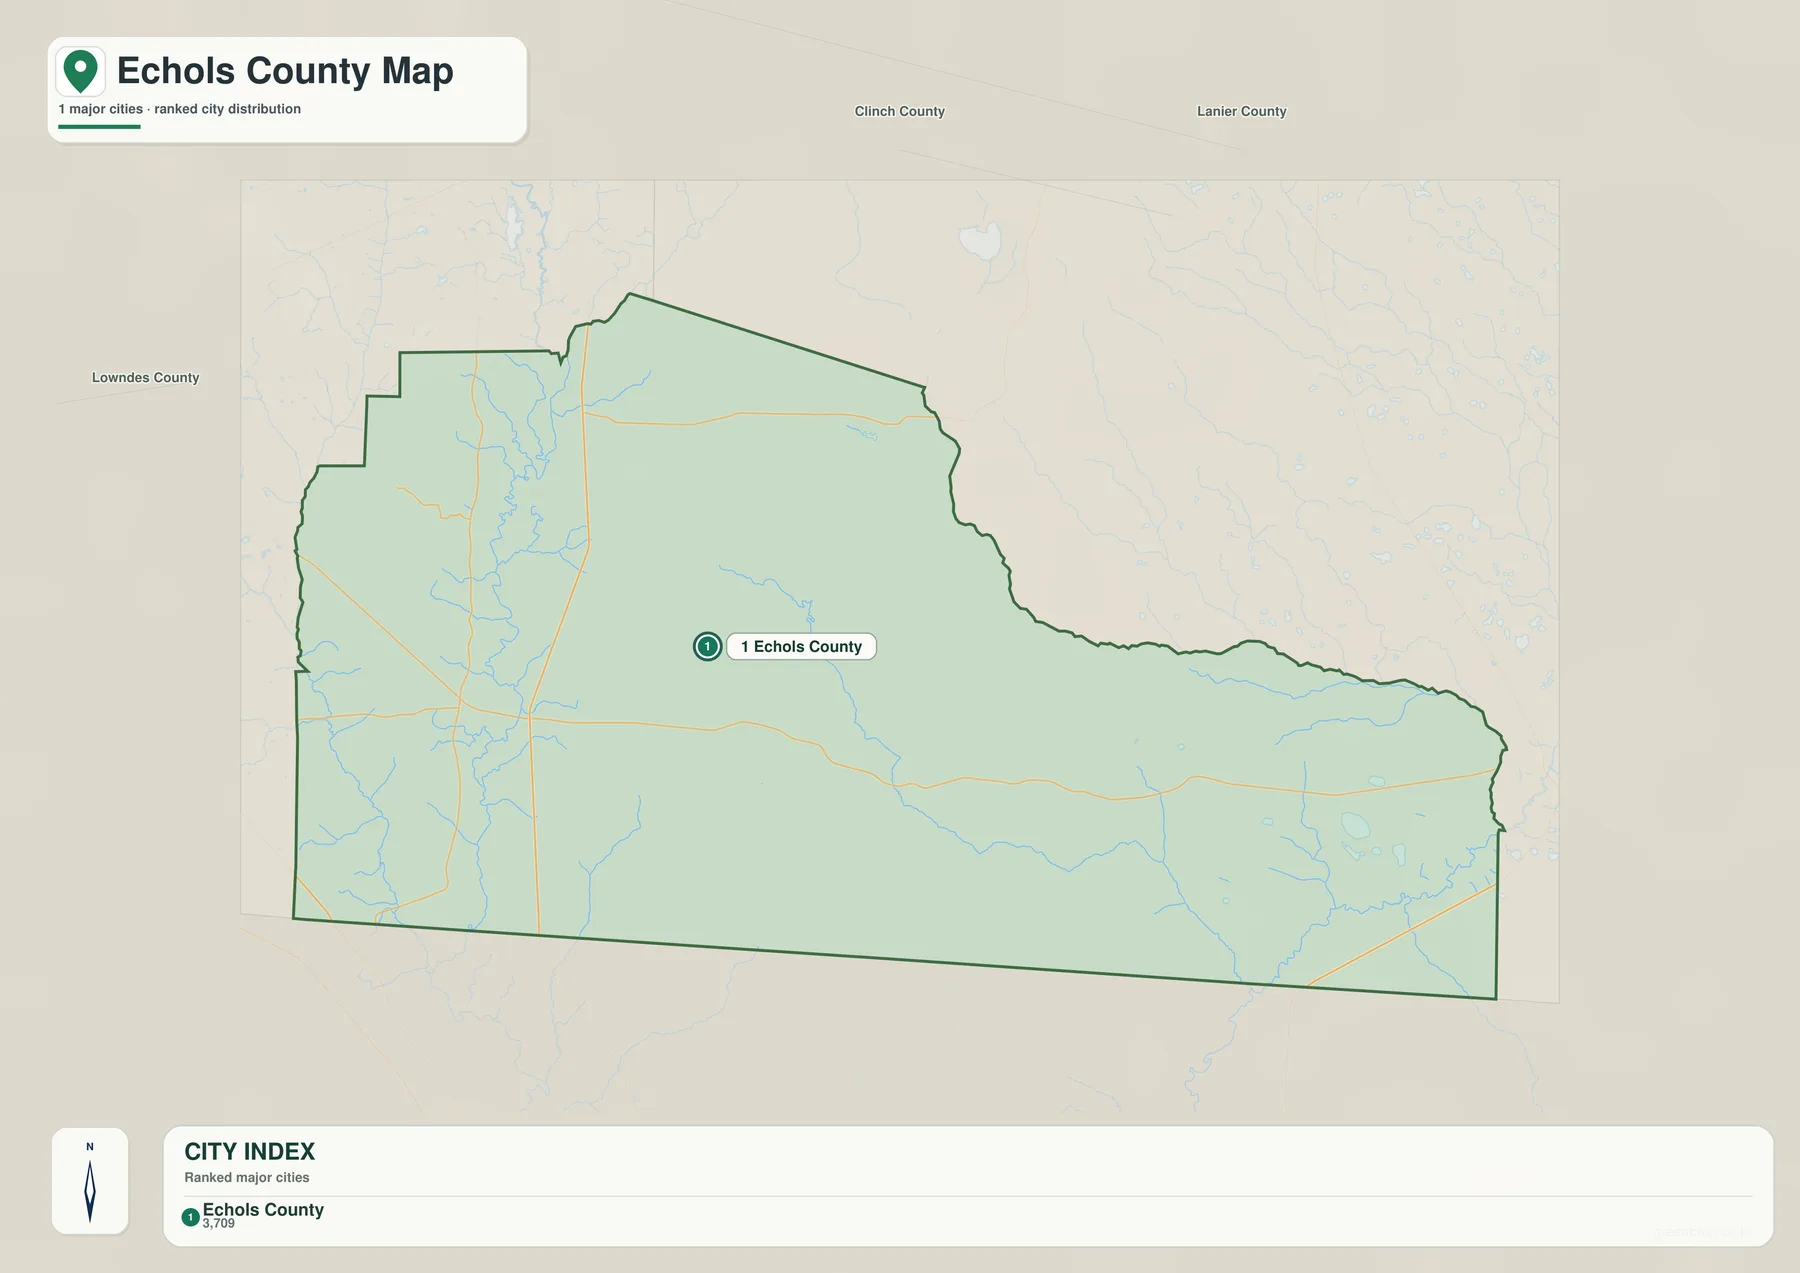
Reading the two maps together prevents a common misunderstanding. Haylow, Needmore, Melrose, and the courthouse area appear on the general map, while the settlement view reduces the county to a much smaller set of markers. The second map therefore should not be used as a complete list of populated places. It works better as a regional locator, especially in a classroom slide or report where neighboring counties need to remain legible.
No road-distance connectors are shown on this settlement image, so it should not be used to infer driving mileage or travel time. Even when points look close on a county map, the actual road route can be longer. For route planning, use a current road or navigation source; for county-to-county orientation, this simplified map is sufficient.
The Alapaha System Dominates the Western Water Map
The water map changes the visual character of Echols County. In the west, the Alapaha River forms a strong north-south line with many bends, and the Alapahoochee River approaches from the southwest. Smaller named branches such as Howell Branch, Cowpen Branch, and Kettle Branch connect to the larger system. These features explain why the western half, which can look relatively simple on the road map, contains a much more intricate natural network.
Farther east, Toms Creek crosses the central and southern part of the county. Long Branch and other smaller streams appear closer to the eastern side, while the Suwannee River becomes the major feature near the southeast. Pierce Camp Bay and Bevins Bay are also labeled in the eastern portion. The word “Bay” is a mapped local feature name here; the map by itself should not be used to assign a legal wetland classification or assume a coastal bay.
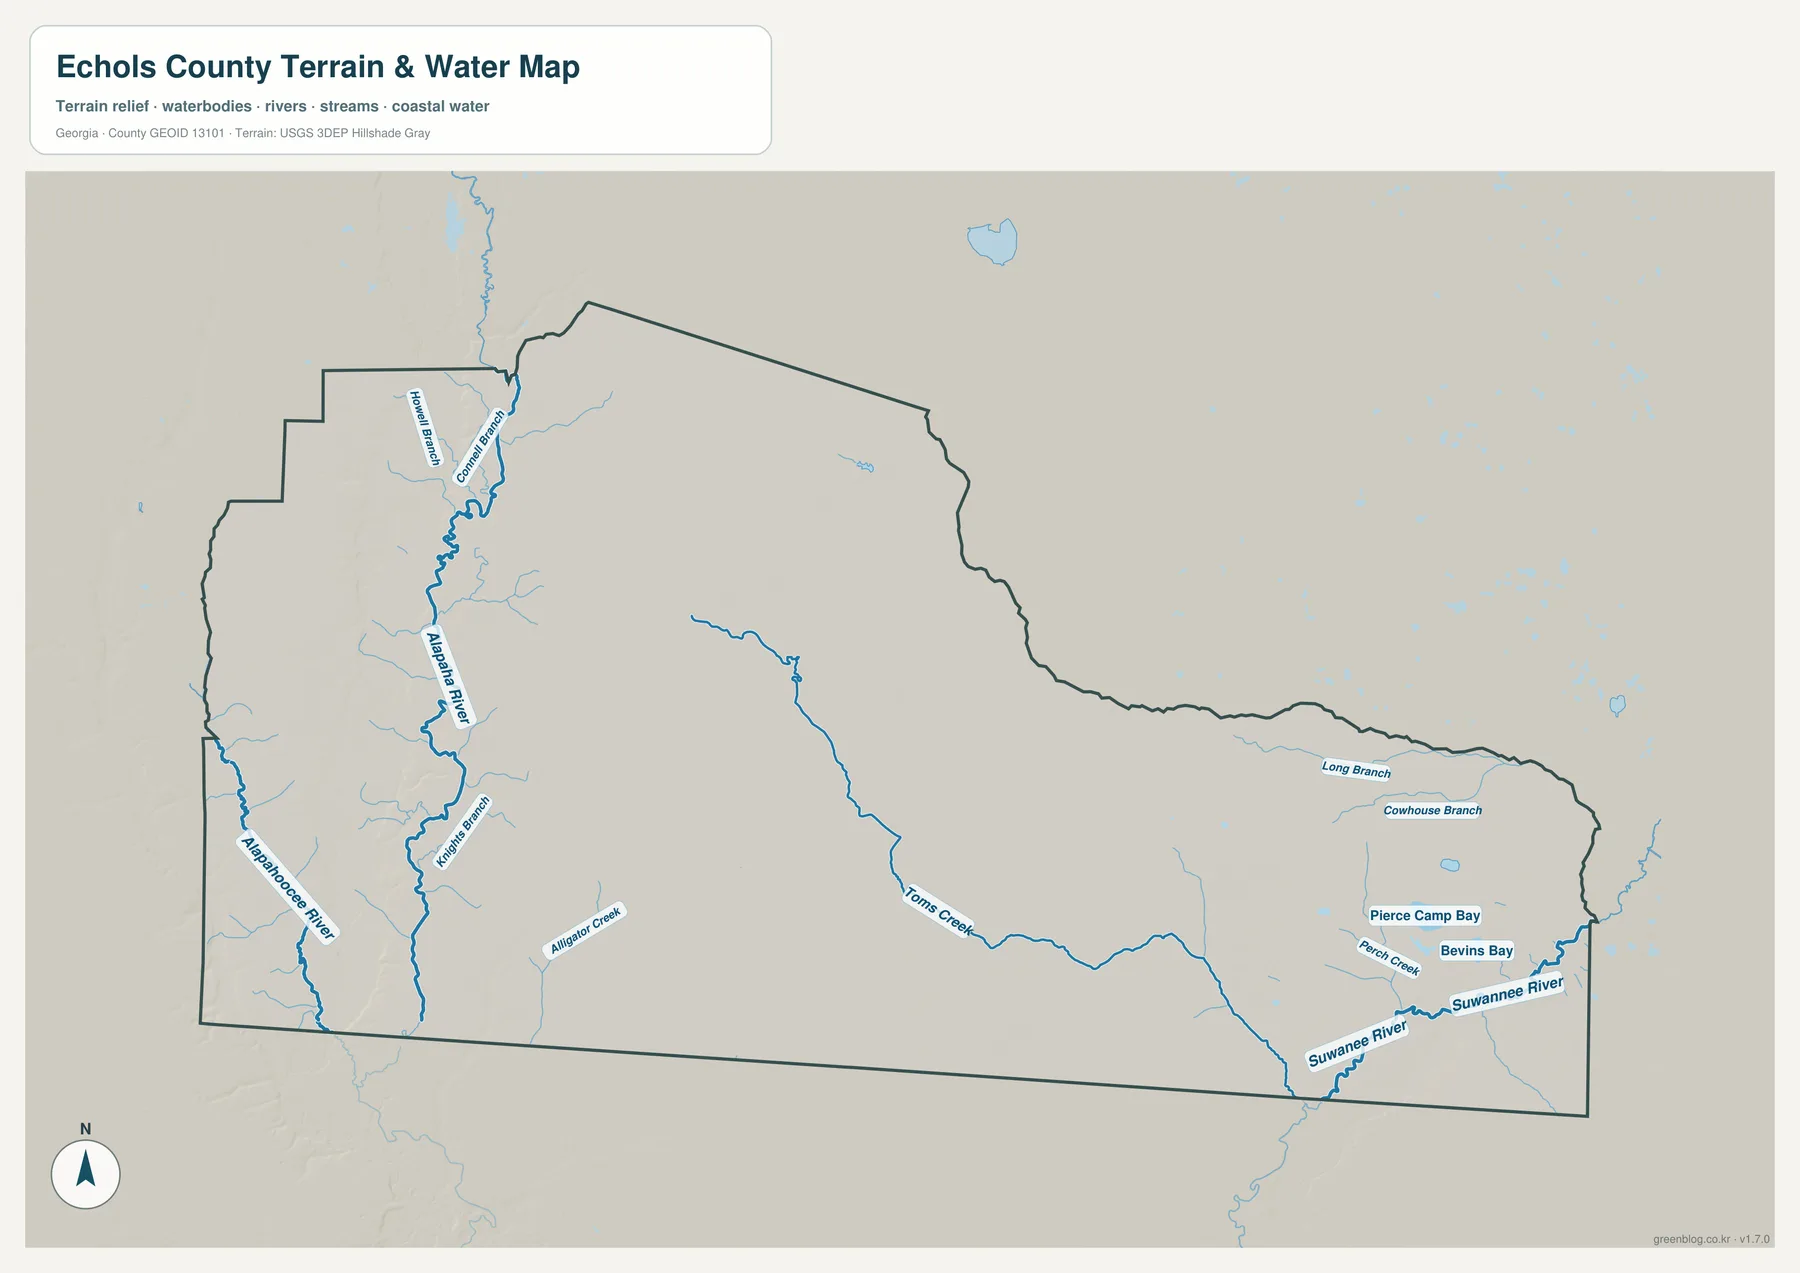
This layer is designed to show hydrographic features and their relative positions. It is not a flood-insurance map, a wetland jurisdiction map, a parcel map, or a navigation chart. Its value is in comparison: the Alapaha corridor can be followed through the west, Toms Creek provides a central connection, and the Suwannee system gives the southeastern end of the county a separate drainage focus.
What a 22–54 Meter Elevation Range Looks Like
The elevation legend reports an actual county range of roughly 22 to 54 meters and a mean near 43 meters. Those numbers describe a low-relief landscape, but “low relief” does not mean completely flat. The shaded surface shows a narrow green corridor along the Alapaha River, with tan and brown ground rising on either side. The difference is modest in absolute terms, yet the river valley is visually distinct because it remains lower than much of the nearby interior.
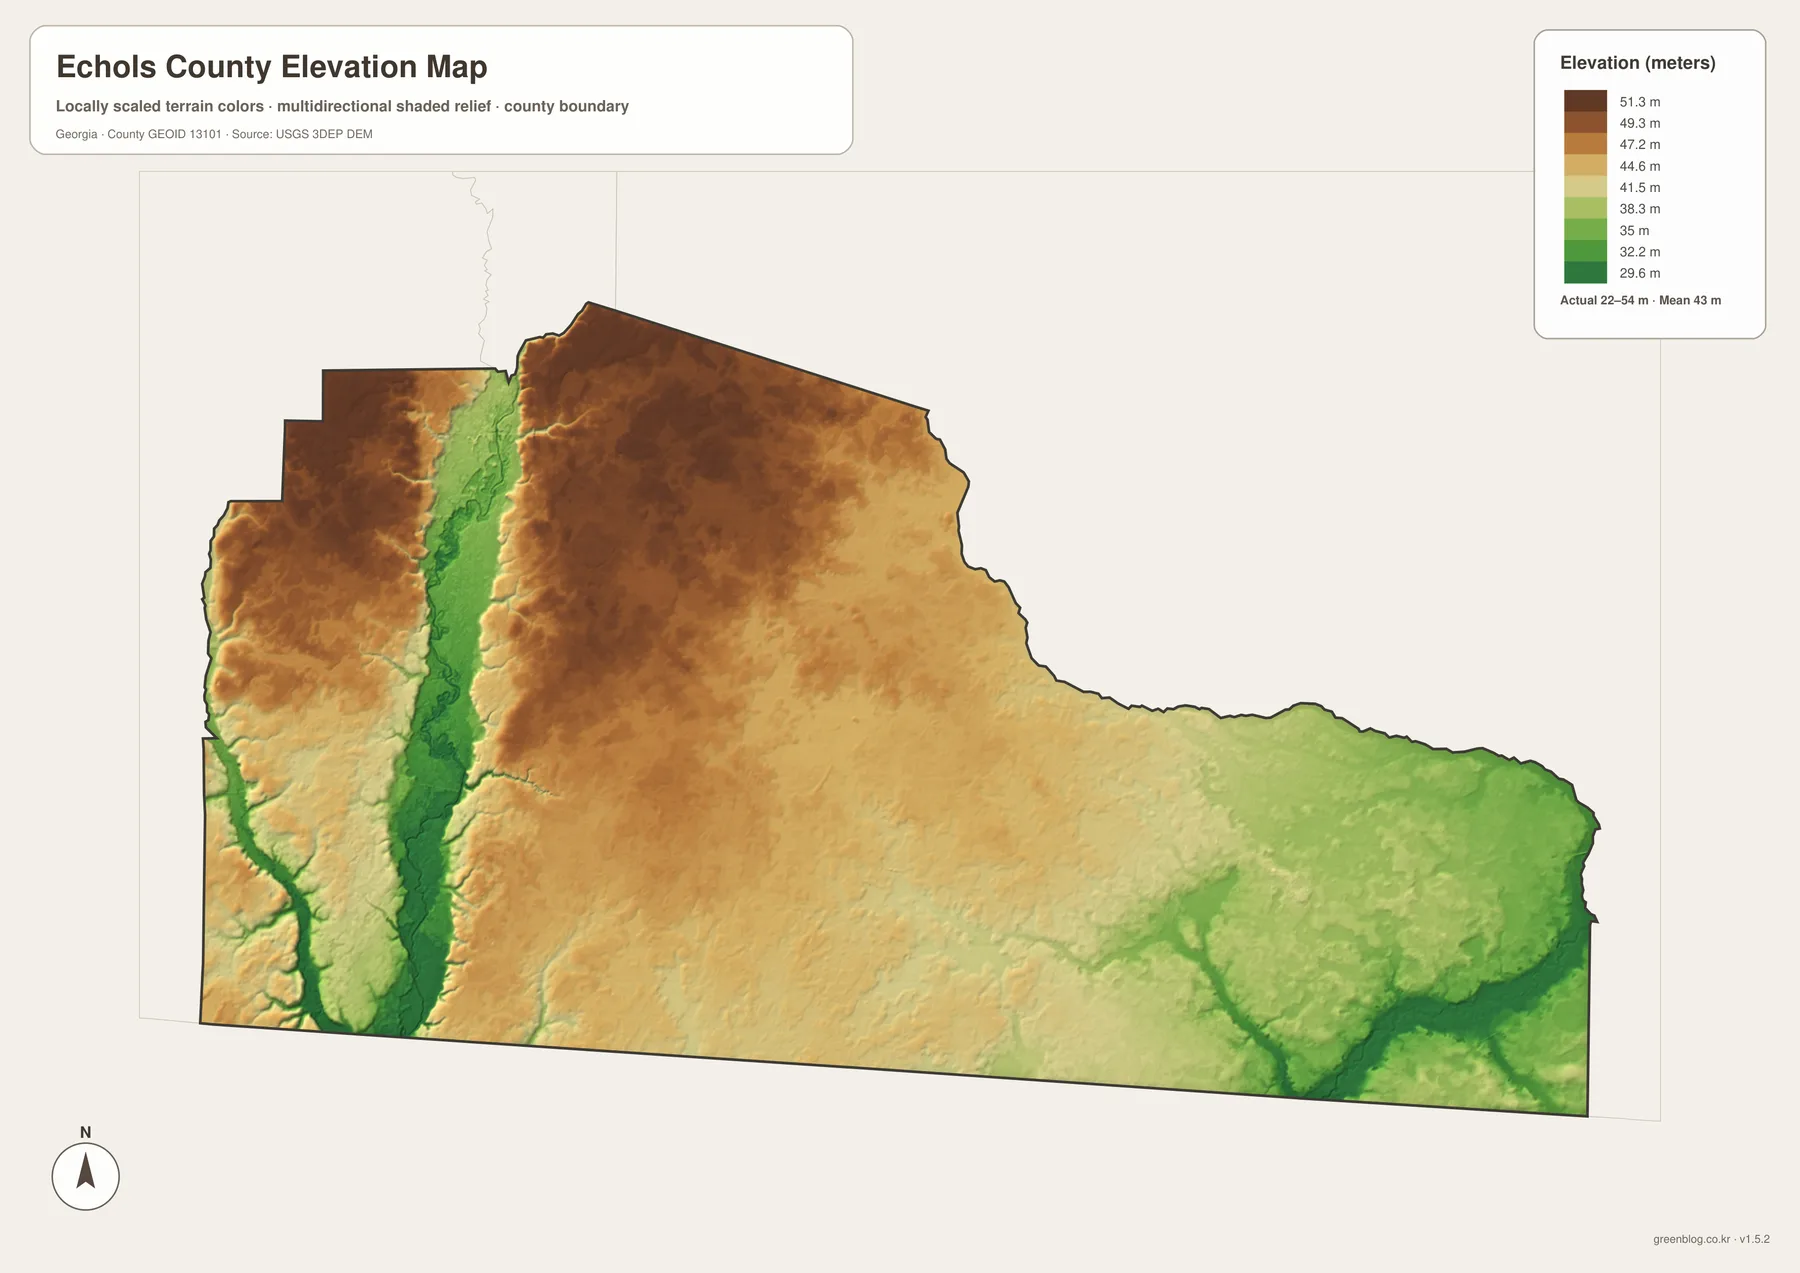
The southeastern corner drops again around the Suwannee River. Unlike the narrow western river band, some lower colors spread more broadly across the eastern and southeastern side before concentrating near the river. Higher tones are more common across parts of the north-central and northwestern interior. Even there, the maximum is only about 54 meters, so these are gentle differences within a low county rather than mountain ridges.
The elevation image should be read at county scale. It is suitable for explaining why river corridors form lower bands and for comparing broad terrain zones, but it does not replace survey-grade measurements at an address or construction site. A drainage design, building elevation, or engineering decision needs a finer source and field verification.
The Florida Line Makes East–West Comparison Easier
The long southern boundary is more than an administrative line; it is also the clearest visual ruler on the map. Once the Florida side is established, the county can be read from west to east without losing direction. The Alapaha and Alapahoochee systems define the west, the courthouse and several road junctions sit in the western half, Needmore marks the central route, and the Suwannee lowlands become more important toward the southeast. The irregular north edge is then easier to understand as the opposite side of the same elongated county.
This comparison also shows why one map cannot explain Echols County by itself. The road map gives more human-made reference points in the west, while the eastern half becomes more informative on the water and elevation layers. A large blank-looking area on the basic map may contain streams, low ground, and named water features that only appear when the theme changes. Switching among the maps therefore adds information rather than simply repeating the same county outline four times.
Choosing the Best Map for the Question
Use the general county map when the task is to show the outline, selected roads, the courthouse area, or named places such as Haylow, Needmore, and Melrose. Choose the settlement view when neighboring counties need to be visible with minimal local clutter. The water map is the strongest option for following the Alapaha, Alapahoochee, Toms Creek, and Suwannee systems, while the elevation map explains how those river corridors relate to the lowest parts of the county.
For a classroom handout, the general map can serve as the first page and the water or elevation view can follow when the lesson moves from political boundaries to physical geography. A local-history or regional overview may benefit from the same sequence because the county seat and road references establish orientation before the river systems are introduced. A natural-resource discussion may reverse that order and begin with water, using the county map only to keep the administrative boundary clear.
The WebP images in the article are convenient for on-screen viewing. The download package contains four separate high-resolution JPG files, allowing one map to be printed by itself or the full set to be used side by side. The maps are reference products, so anyone preparing legal, engineering, flood, parcel, or navigation work should pair them with the appropriate official specialized source.
Frequently Asked Questions
Where does the elevation map show the lowest ground?
The clearest low corridors follow the Alapaha River in the west and the Suwannee River in the southeast. The county-wide range is about 22 to 54 meters, so the contrast is gentle rather than mountainous, but the dark green river zones are noticeably lower than much of the surrounding interior.
Which map is best for Haylow or Needmore?
Use the general county map. It labels Haylow, Needmore, Melrose, Fargo, and the courthouse area, while the settlement-distribution map is intentionally simplified and does not repeat every small community. The settlement view is better for comparing Echols County with Lowndes, Clinch, and Lanier counties.
Can the water map be used to determine flood zones or wetlands?
No. The water map is a county-scale reference for rivers, creeks, branches, and named water features. It does not establish flood-insurance zones, regulated wetland boundaries, parcel limits, or safe navigation routes. Use the appropriate official regulatory or site-specific map for those decisions.
Map File Information
Download the Echols County four-map set as high-resolution A3 JPG files in one ZIP.
- Included Files: county map, settlement distribution map, water map, and elevation map
- File Type: four original high-resolution JPG files
Related Maps
Sources and Reference Data
County boundaries and general geographic reference data can be checked against the U.S. Census Bureau TIGER/Line program. County background and administrative context are available through the New Georgia Encyclopedia entry for Echols County and Census QuickFacts.
Names and positions of mapped rivers and streams can be compared with USGS National Hydrography, while the terrain background is supported by the USGS 3D Elevation Program. These sources provide the authoritative data context; the maps on this page are simplified county-reference graphics intended for clear public use.
Green Map creates custom-edited map images using open geographic data sources such as geoBoundaries, Natural Earth, OpenStreetMap, and government open data. These maps are edited visual materials, not raw data files, and are provided for education, documents, presentations, and graphic reference.