Leon County combines a dense Tallahassee urban core with a much larger outer landscape of forest and wetlands. Forest is the leading 2025 land-cover class at 43.68%, followed by wetlands at 25.66% and developed land at 18.25%. Agriculture accounts for 5.46%, while smaller amounts of grassland, shrubland, and water appear in scattered areas. The contrast between the central built-up area and the greener county edges is the clearest pattern across the map set.
This page explains four views of Leon County: the 2025 land-cover map, the forest-and-farmland map, the impervious-surface map, and the 1985–2025 class-comparison map. The browser uses WebP previews, while the four original JPG maps are available together in one ZIP download below. They are useful for comparing Tallahassee with the county’s forest, wetlands, farmland, and mapped long-term class differences.
Table of Contents
The Tallahassee core stands out inside a county where forest remains the largest cover class
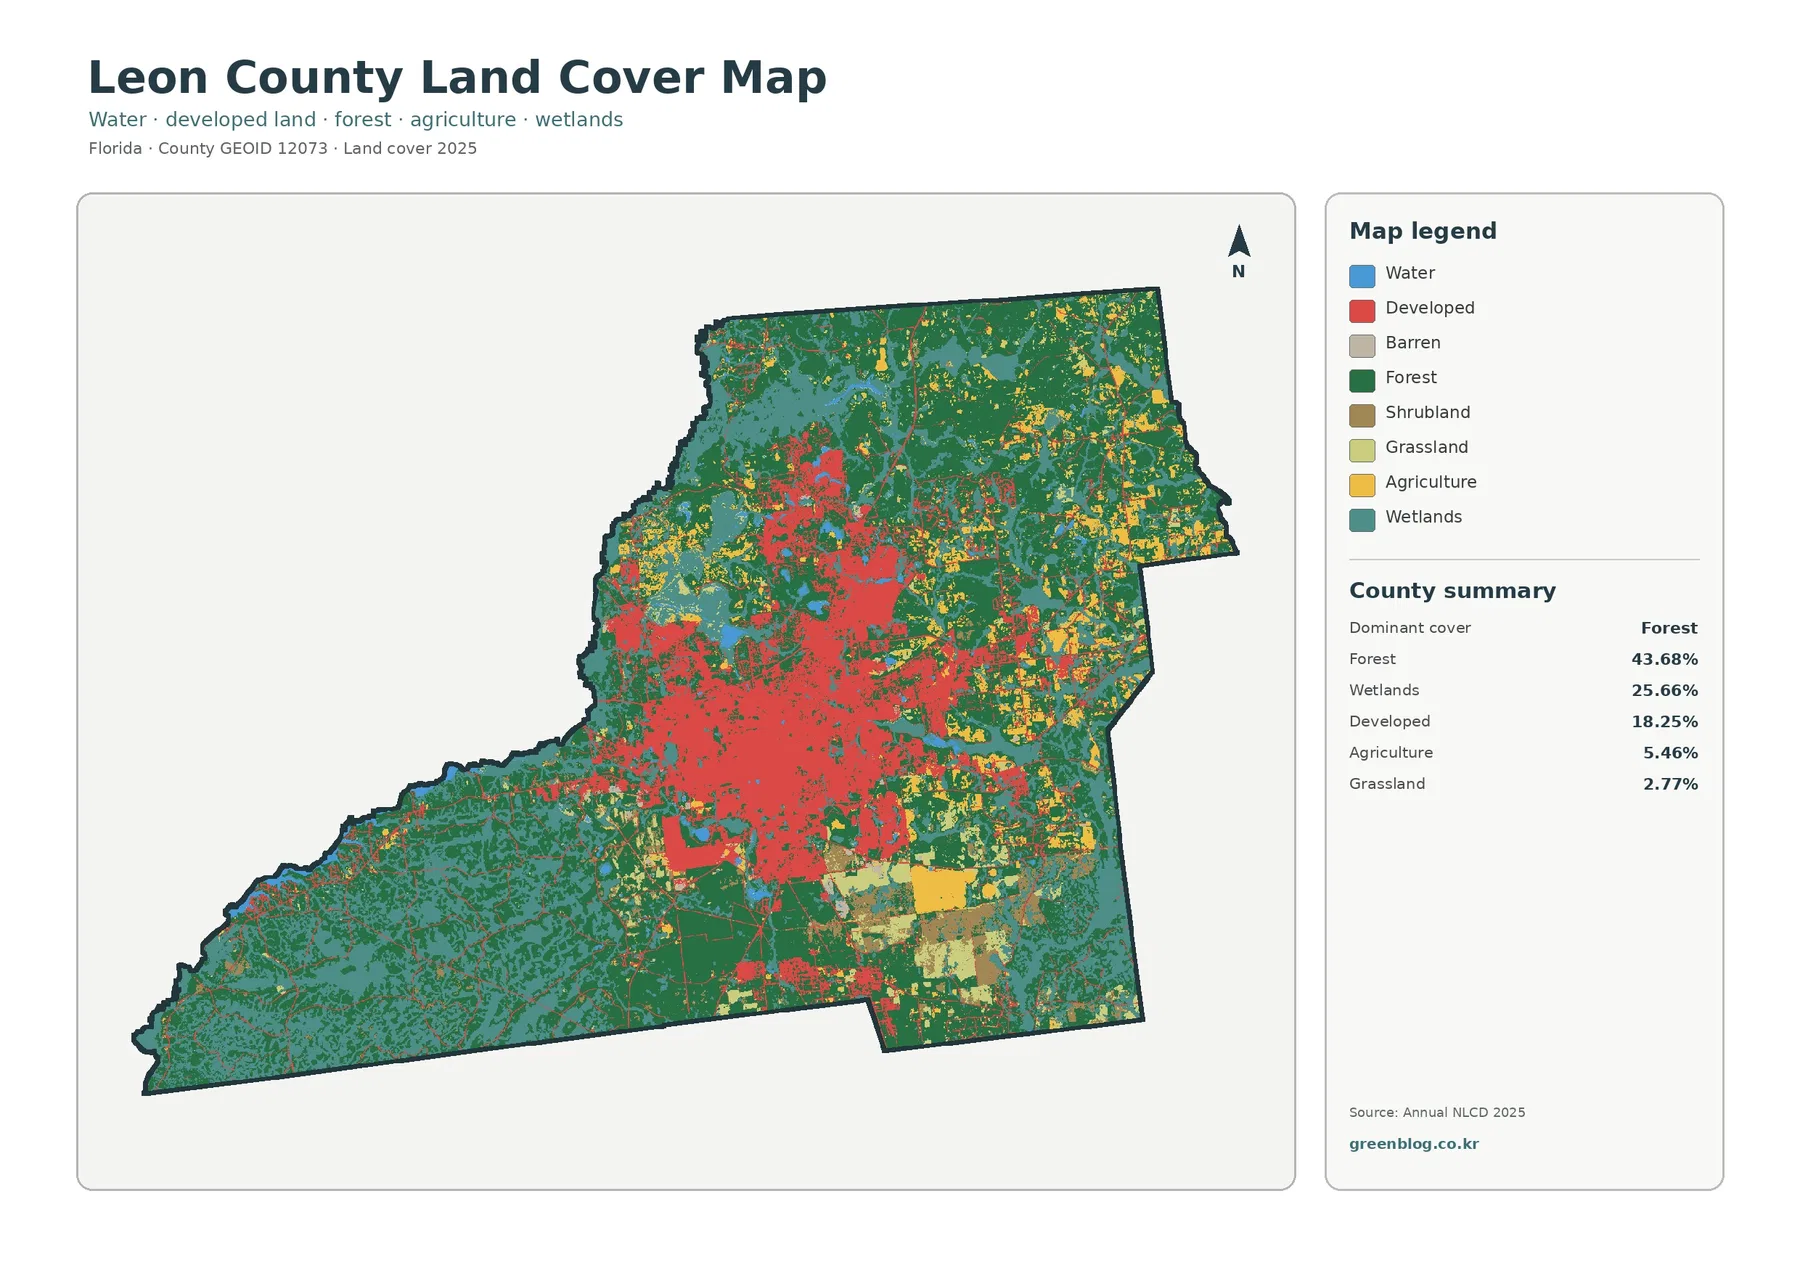
Dark green forest covers much of the northern edge, northeast, southwest, and outer southern portions of the county. The 43.68% summary makes forest the dominant 2025 class, but the map is not one continuous wooded block. Roads, wetland areas, agriculture, and developed land divide the forest into broad connected tracts and smaller pieces around the central urban area.
Wetlands account for 25.66% and are especially prominent through the southwest, north, and eastern parts of the county. Teal areas frequently sit next to forest, so Leon County’s natural cover is better described as a forest-wetland mixture than as forest alone. Some wetland areas are broad enough to be obvious even at the reduced preview size, while others thread between wooded or developed land.
Developed land makes up 18.25% and is concentrated in the center of the county. Leon County’s official About page identifies Tallahassee as both the county seat and Florida’s capital, which gives useful context to the large central red area. Development also follows several outward road corridors, but it drops off quickly toward the county edges. A developed classification still does not describe zoning, ownership, or parcel-level building rights.
Agriculture accounts for 5.46%, grassland for 2.77%, shrubland for 2.62%, and water for 1.29%. Agricultural color is easiest to notice in the east and southeast, with smaller areas toward the northeast. Blue water is scattered among the broader forest-wetland landscape. These smaller classes are best interpreted by looking at their position on the map rather than by percentages alone.
A simplified forest-and-farmland view separates the urban center from wooded and agricultural edges
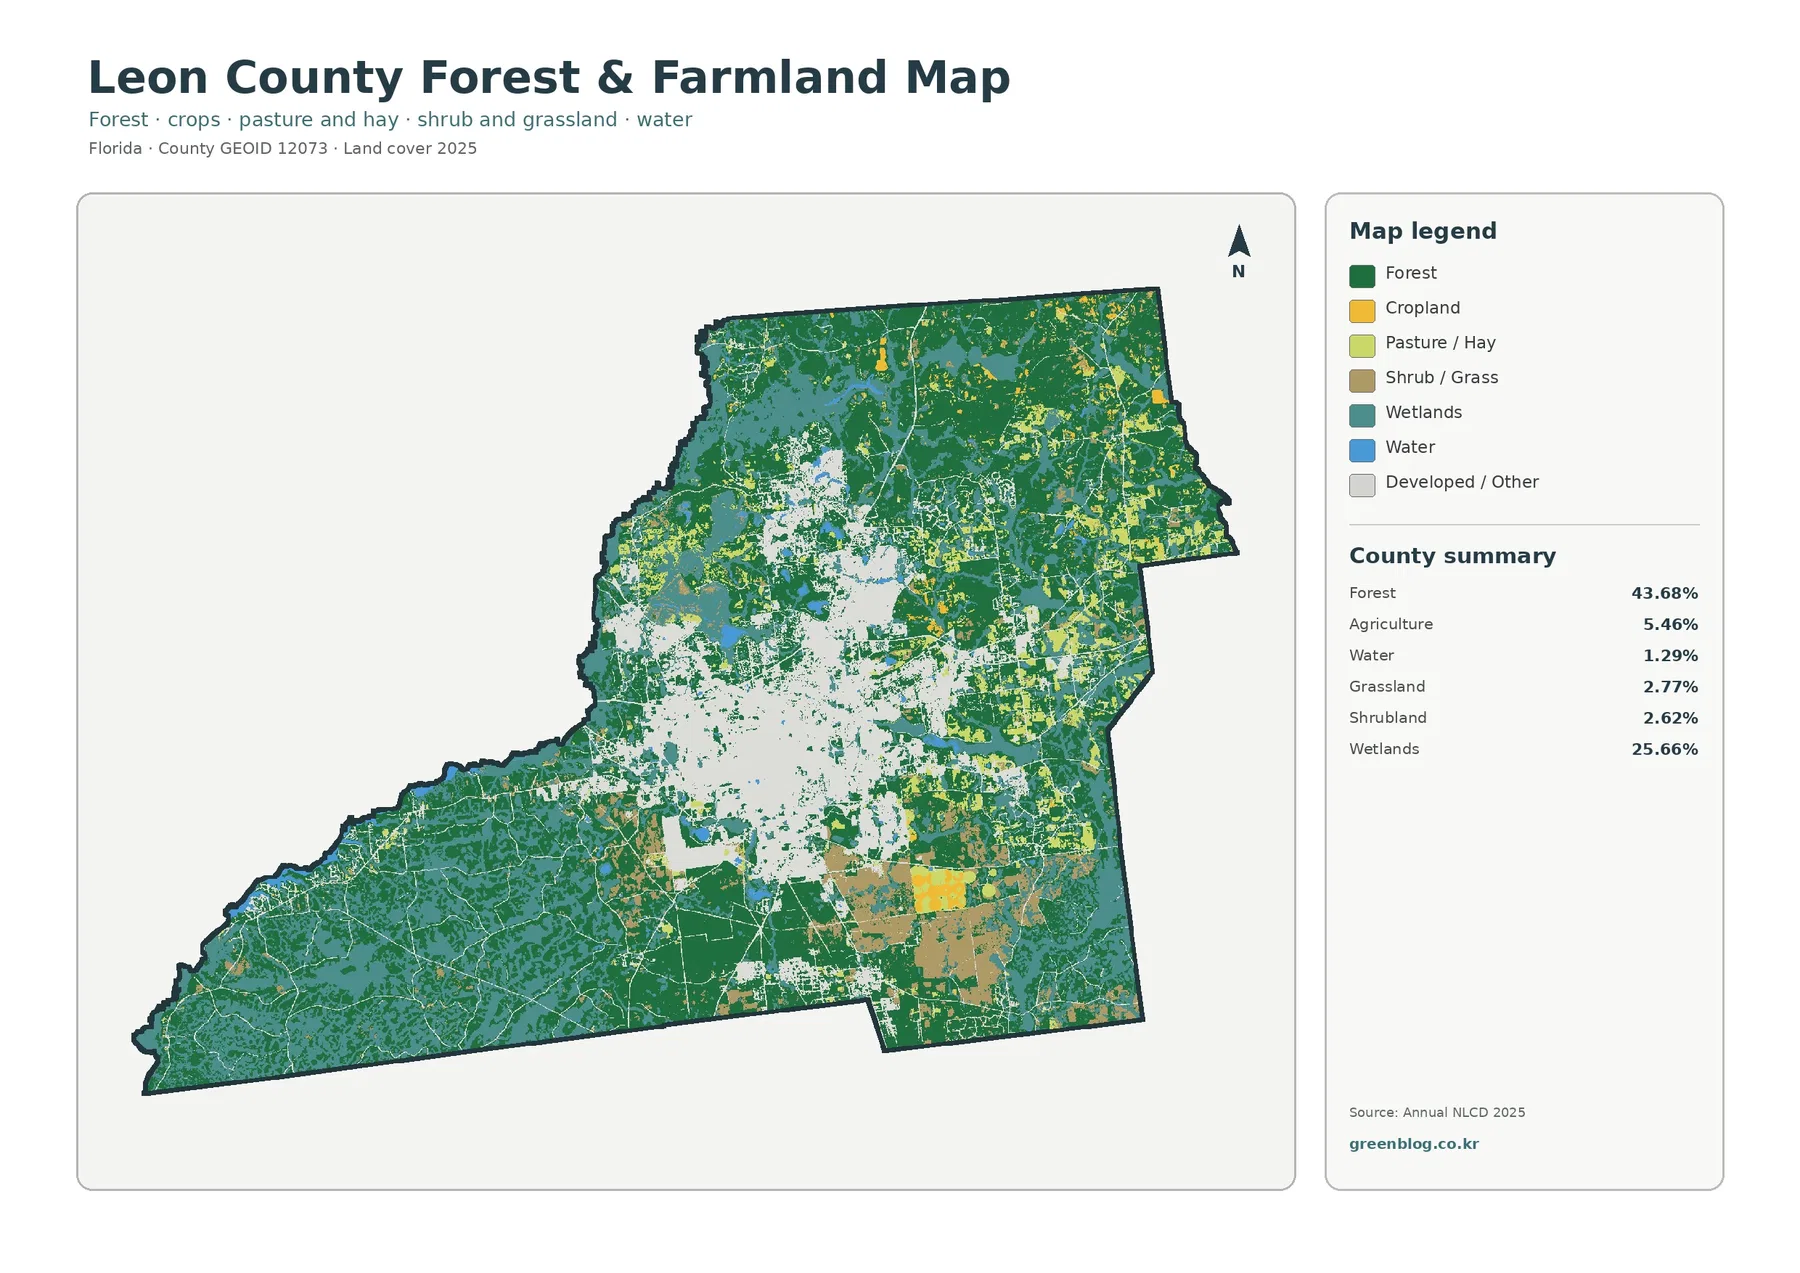
The forest-and-farmland map turns developed and other cover into a light background, making the central Tallahassee footprint immediately recognizable. Dark green forest surrounds much of that bright area, especially to the north, southwest, and south. Wetlands remain visible throughout the outer county, while agricultural yellow and tan are more noticeable on the eastern and southeastern side.
Agriculture is a relatively small countywide class at 5.46%, but its location is distinct enough to matter. Several blocks east and southeast of Tallahassee form the clearest agricultural concentration, with smaller farm areas scattered farther north. UF/IFAS Leon County Extension provides programs in agriculture and natural resources, offering local context for why working land and natural cover are both relevant in a county strongly influenced by an urban center.
Forest and wetlands together account for well over half of Leon County. In many places the two classes touch or alternate over short distances. That pattern helps explain why greenways, parks, and natural-resource stewardship appear prominently in county programs. Leon County’s greenway pages describe these spaces as areas managed for recreation, wildlife, and environmental stewardship, although the mapped forest class is not the same thing as an official park or conservation boundary.
This simplified map is particularly useful when a presentation needs one clear contrast: the light Tallahassee area versus darker outer forest, wetlands, and smaller agricultural blocks. Enlarging the original JPG makes the thin agricultural and grassland areas easier to distinguish. Keeping the legend visible is important because several natural classes use related green or tan shades.
Impervious cover reaches its highest values in Tallahassee and along a limited road network
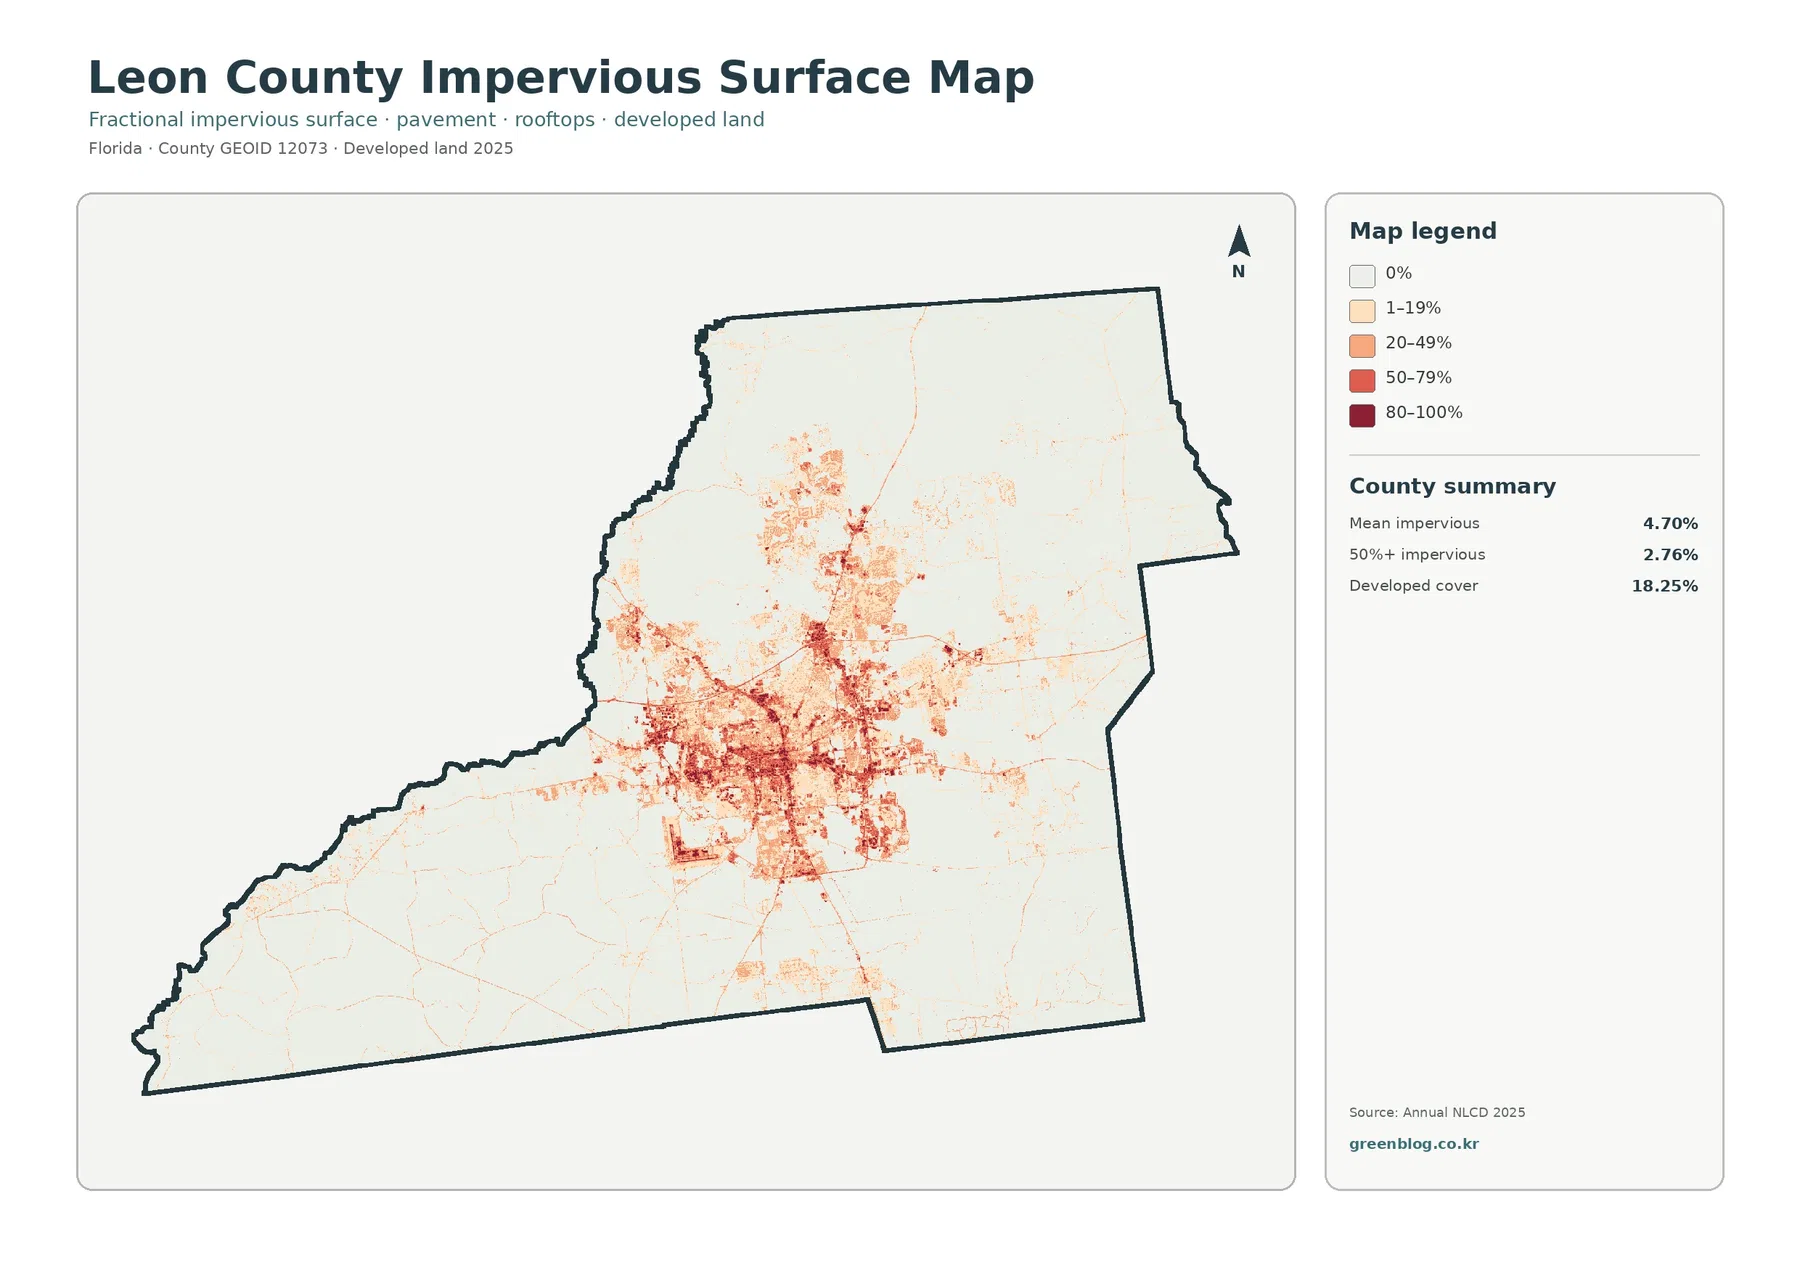
Impervious surface means hard cover such as pavement, parking areas, and rooftops that does not readily absorb rainfall. Leon County’s mean impervious value is 4.70%, and 2.76% of the county is mapped at 50% or greater imperviousness. Those values are far below the 18.25% developed-land share because developed areas can also contain lawns, trees, soil, and other permeable surfaces.
The strongest impervious colors form a compact cluster around Tallahassee. Higher values extend outward along several roads and settlement corridors, while the western, southwestern, northeastern, and far southern parts of the county are much paler. The pattern is therefore concentrated rather than countywide, which is consistent with a capital-city core surrounded by extensive lower-density land cover.
Leon County Environmental Services reviews issues such as natural features, stormwater management, flood protection, tree removal, landscaping, and natural-area preservation during its permitting process. That official role helps clarify the limits of this map. Impervious percentage is a surface-cover measure; it is not a permit map, zoning map, parcel survey, or legal statement about what may be developed.
For environmental education, the impervious map can be paired with the wetland and forest classes on the general map. Readers can trace how dark urban surfaces fade into the outer green and teal landscape. The map should not be used alone to determine drainage capacity, flood risk, or water quality because those questions also require elevation, soils, rainfall, infrastructure, and watershed data.
The 1985–2025 comparison highlights a 5.92% developed transition and 4.37% forest loss
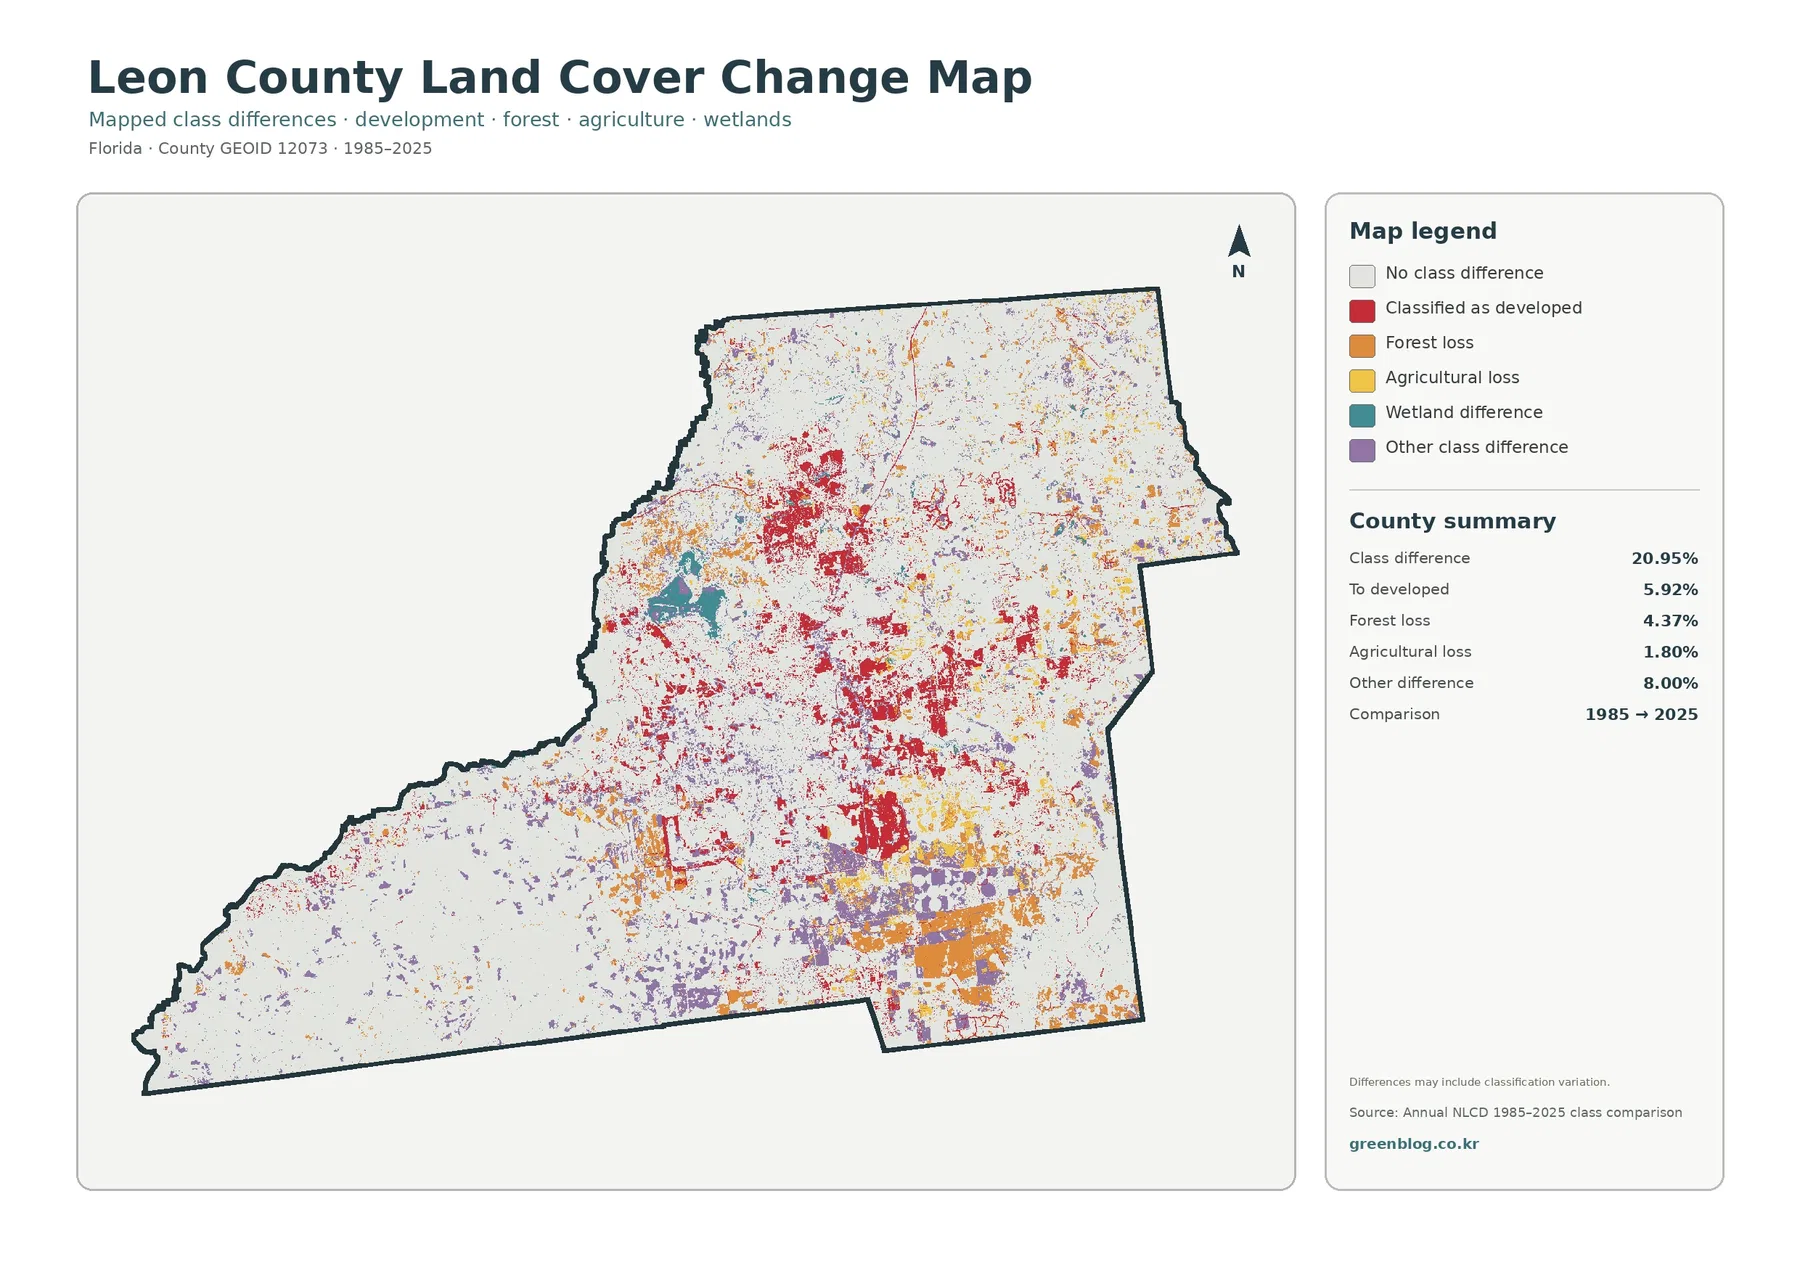
The comparison map reports class differences across 20.95% of Leon County. Areas classified as developed account for 5.92%, forest loss for 4.37%, agricultural loss for 1.80%, and other class differences for 8.00%. The change colors are not limited to the Tallahassee core; they also appear across the east, southeast, north, and several outer areas.
Red developed transitions are most noticeable in and around the current urban footprint and along outward corridors. Orange forest-loss areas and yellow agricultural-loss areas are scattered farther from the center. The southeast contains several larger patches of other class difference. Even when these colors sit close to today’s developed or agricultural land, the comparison does not prove a specific cause for each transition.
A note on the map warns that classification variation may be included. The 20.95% figure therefore should not be read as an exact physical-change rate. Imagery from different dates, mixed raster cells, and classification methods can assign different labels to the same place. Aerial photography or additional Annual NLCD years are better tools for confirming whether a mapped difference reflects a real ground change.
This layer compares only two endpoints, 1985 and 2025. It does not show the sequence of events during the forty years in between. A location may have changed more than once or remained stable for most of the period before a recent transition. The map is most useful for identifying places to investigate further rather than serving as a complete land-use history.
Reading Leon County as a whole means comparing the capital-city core with extensive natural cover
Leon County’s official About page describes Tallahassee as the county seat and Florida’s capital. That fact helps explain why the developed and impervious maps have such a strong center. At the same time, the outer county remains dominated by forest and wetlands, so the central city should not be treated as representative of the entire land-cover pattern.
A classroom or county-reference sequence can begin with the general land-cover map to compare forest, wetlands, and developed land. The forest-and-farmland map then clarifies the outer natural and agricultural pattern. The impervious map shows where hard surfaces are concentrated, and the change map identifies places where the 1985 and 2025 classifications differ. Using the maps in this order makes their different purposes easier to understand.
Land cover describes what appears on the ground, such as forest, water, agriculture, or developed surface. It does not describe legal land use, parcel ownership, zoning, or development rights. Leon County Development Services manages comprehensive planning and land-use rules separately, so anyone making a property or permitting decision should consult those official sources rather than relying on land-cover color alone.
The download ZIP contains the 2025 land-cover map, forest-and-farmland map, impervious/developed-land map, and 1985–2025 land-cover comparison map. Each JPG is 2480×1754 pixels. The original JPG files are more useful than the reduced WebP previews for enlarging legends, checking small patches, or placing a county map into a report or presentation.
Annual NLCD maps are raster data, meaning the landscape is represented as a grid and each cell receives a representative class or value. Real ground conditions can contain trees, pavement, grass, buildings, and water within the same local area. The colored boundaries should therefore be treated as generalized land-cover edges, not as surveyed parcel lines.
Frequently Asked Questions
What is the largest 2025 land-cover category in Leon County?
Forest is the largest category at 43.68%. Wetlands follow at 25.66%, and developed land accounts for 18.25%. The central Tallahassee area is visually prominent, but forest and wetlands together cover a much larger share of the county.
Why is developed land 18.25% while mean impervious cover is 4.70%?
The two measures describe different things. Developed land can include buildings and roads along with lawns, trees, soil, and other surfaces that absorb water. Impervious cover measures hard surfaces such as pavement and rooftops more directly, so the countywide mean is lower.
Does the 20.95% 1985–2025 class difference equal the true land-change rate?
No. The map specifically notes that classification variation may be included. Important locations should be checked with aerial imagery, additional years, or other official records before the class difference is treated as a confirmed physical change.
Map File Information
Download the four original Leon County land-cover JPG maps together in one ZIP file.
- Included Files: Use only the versions confirmed in the article and supplied images
- File Type: Use the confirmed download contents
- Intended Use: Printing, education, presentations, and map-based projects
Related Maps
- Alachua County Florida Land Cover Map
- Baker County Florida Land Cover Map
- Bay County Florida Land Cover Map
Sources and References
- MRLC Annual NLCD Data – Official source for Annual NLCD land-cover data.
- USGS Annual NLCD Land Cover Classification – Describes the primary Annual NLCD land-cover classes.
- U.S. Census Bureau TIGER/Line Shapefiles – Official geographic boundary data for county reference.
- Leon County – About Leon County – Official county background on Tallahassee and Leon County.
- Leon County Environmental Services – County information on environmental review, stormwater, natural features, and permitting.
- UF/IFAS Extension Leon County – Local agriculture and natural-resource education.
Green Map creates custom-edited map images using open geographic data sources such as geoBoundaries, Natural Earth, OpenStreetMap, and government open data.
These maps are edited visual materials, not raw data files, and are provided for education, documents, presentations, and graphic reference.