Lee County in Southwest Florida combines a large urban footprint with extensive wetlands and water. Developed land is the largest 2025 cover class at 48.15%, while wetlands account for another 32.86%. Water adds 9.14%, agriculture 7.12%, and forest 1.08%. The pattern is especially clear around the Caloosahatchee corridor, where large developed areas meet river and estuary waters, while wetter and more agricultural cover remains prominent toward the eastern and southeastern parts of the county.
This page includes four separate views: 2025 land cover, forest and farmland, impervious surface, and a 1985–2025 land-cover class comparison. The WebP versions are shown on the page for quick viewing, and the four original JPG maps can be downloaded together in one ZIP below. They are useful for comparing urban development, wetlands, water, agriculture, hard surfaces, and long-term class differences across Lee County.
Table of Contents
Developed cover dominates the 2025 summary, but wetlands remain extensive
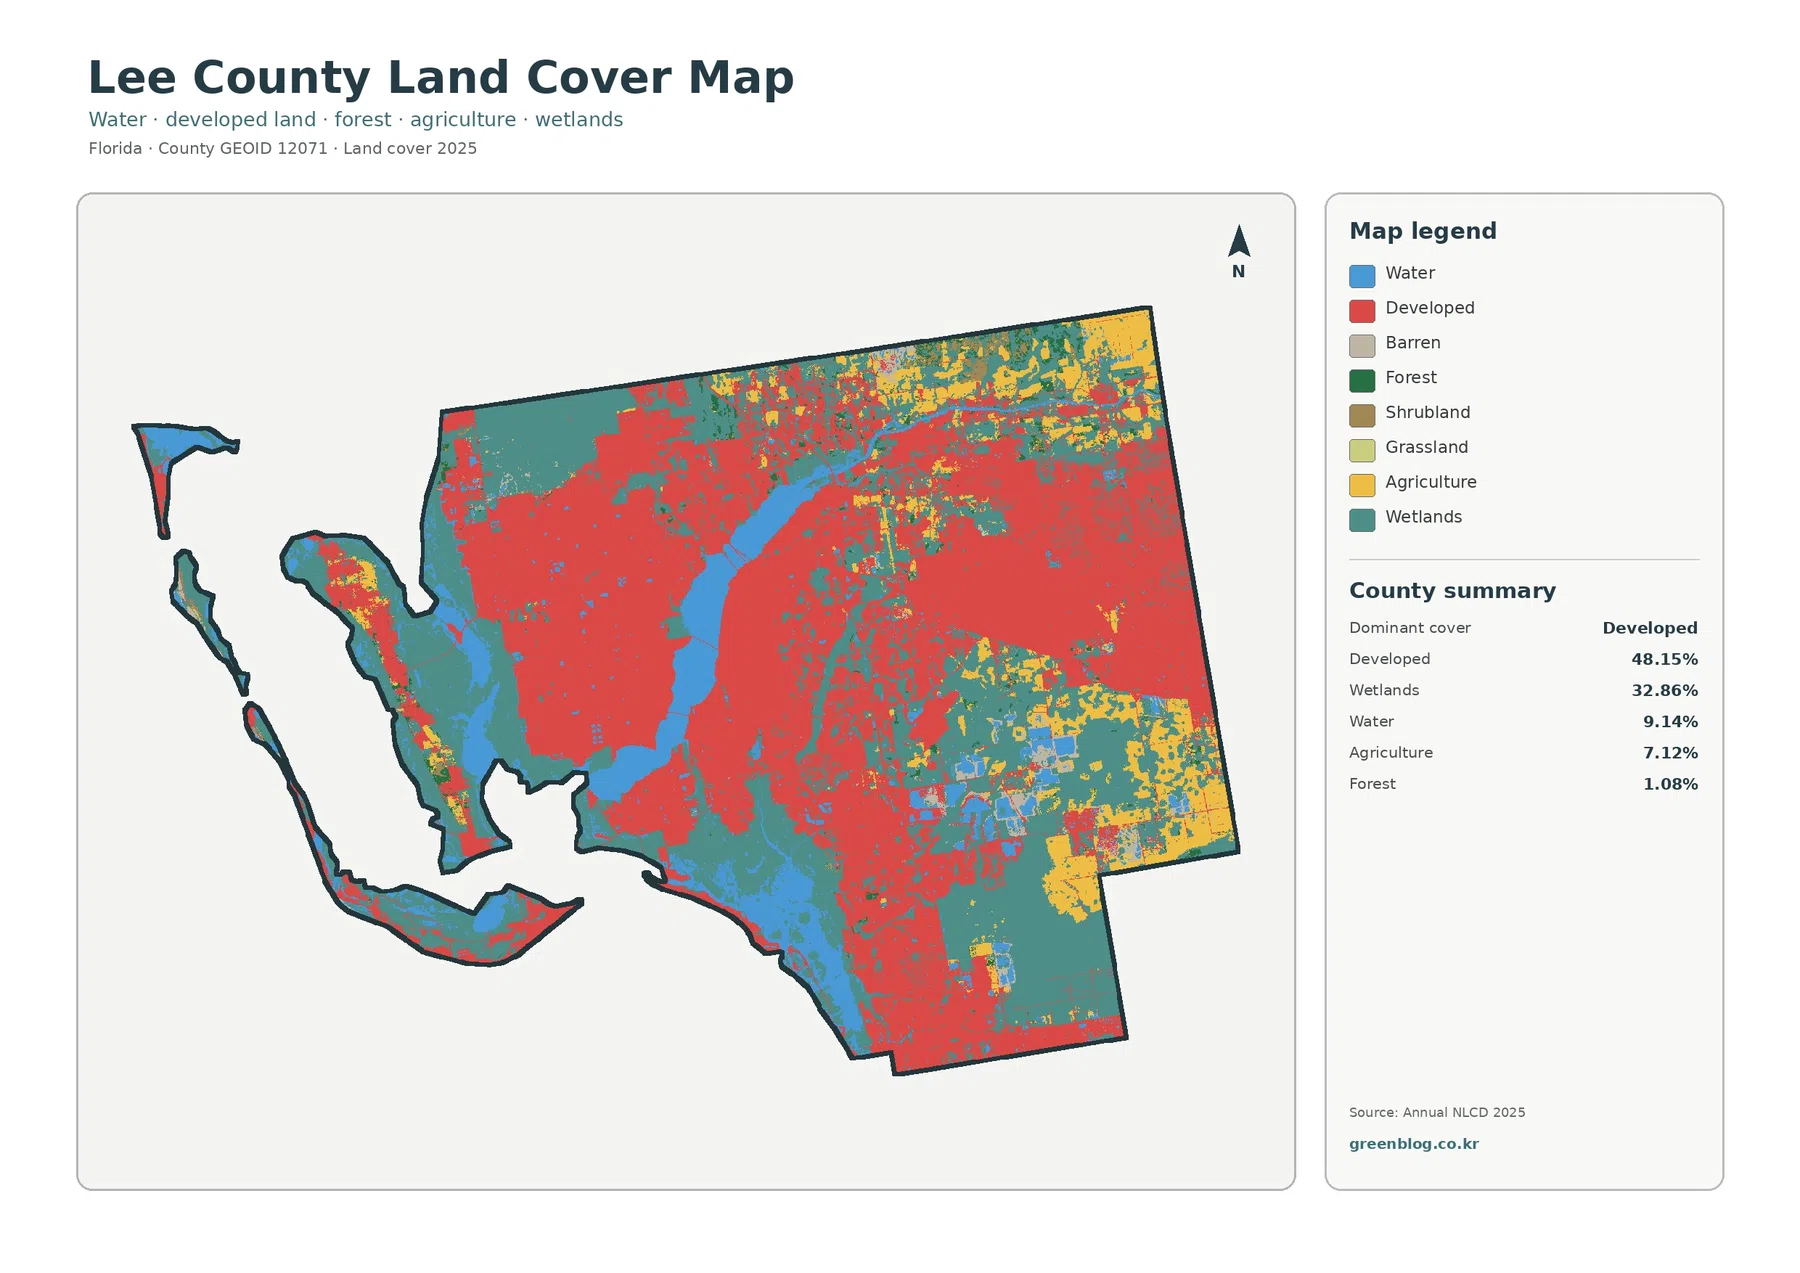
Red developed cover fills much of the western and central mainland on the general map. Large connected areas appear on both sides of the Caloosahatchee River, with additional development extending southward and across the northern part of the county. The 48.15% developed share is therefore not driven by one compact city center; built land occupies a broad portion of Lee County.
Wetlands are the second-largest category at 32.86%. Teal cover is especially extensive in the northwest, east, and southeast, and it also appears close to developed districts and coastal water. Lee County’s Conservation 20/20 program is designed to acquire and manage environmentally sensitive land, providing useful local context for a county where wetland and other natural cover remain substantial even beside major urban areas.
Water accounts for 9.14% of the mapped area. The Caloosahatchee River forms the most obvious inland water feature, and coastal waters surround the islands and shoreline to the west. Lee County Natural Resources describes the Caloosahatchee system as extending from Lake Okeechobee to San Carlos Bay. That official watershed context helps connect the large blue areas on the map with a major regional waterway.
Agriculture is 7.12% and is most visible in the eastern and northeastern portions of the county, with additional blocks farther south and east. Forest is only 1.08%, so dark green appears in comparatively small patches rather than in a large continuous forest region. These smaller categories are easier to inspect in the original JPG, where the legend and fine patches can be enlarged.
The forest-and-farmland map separates eastern agriculture from broad wetland areas
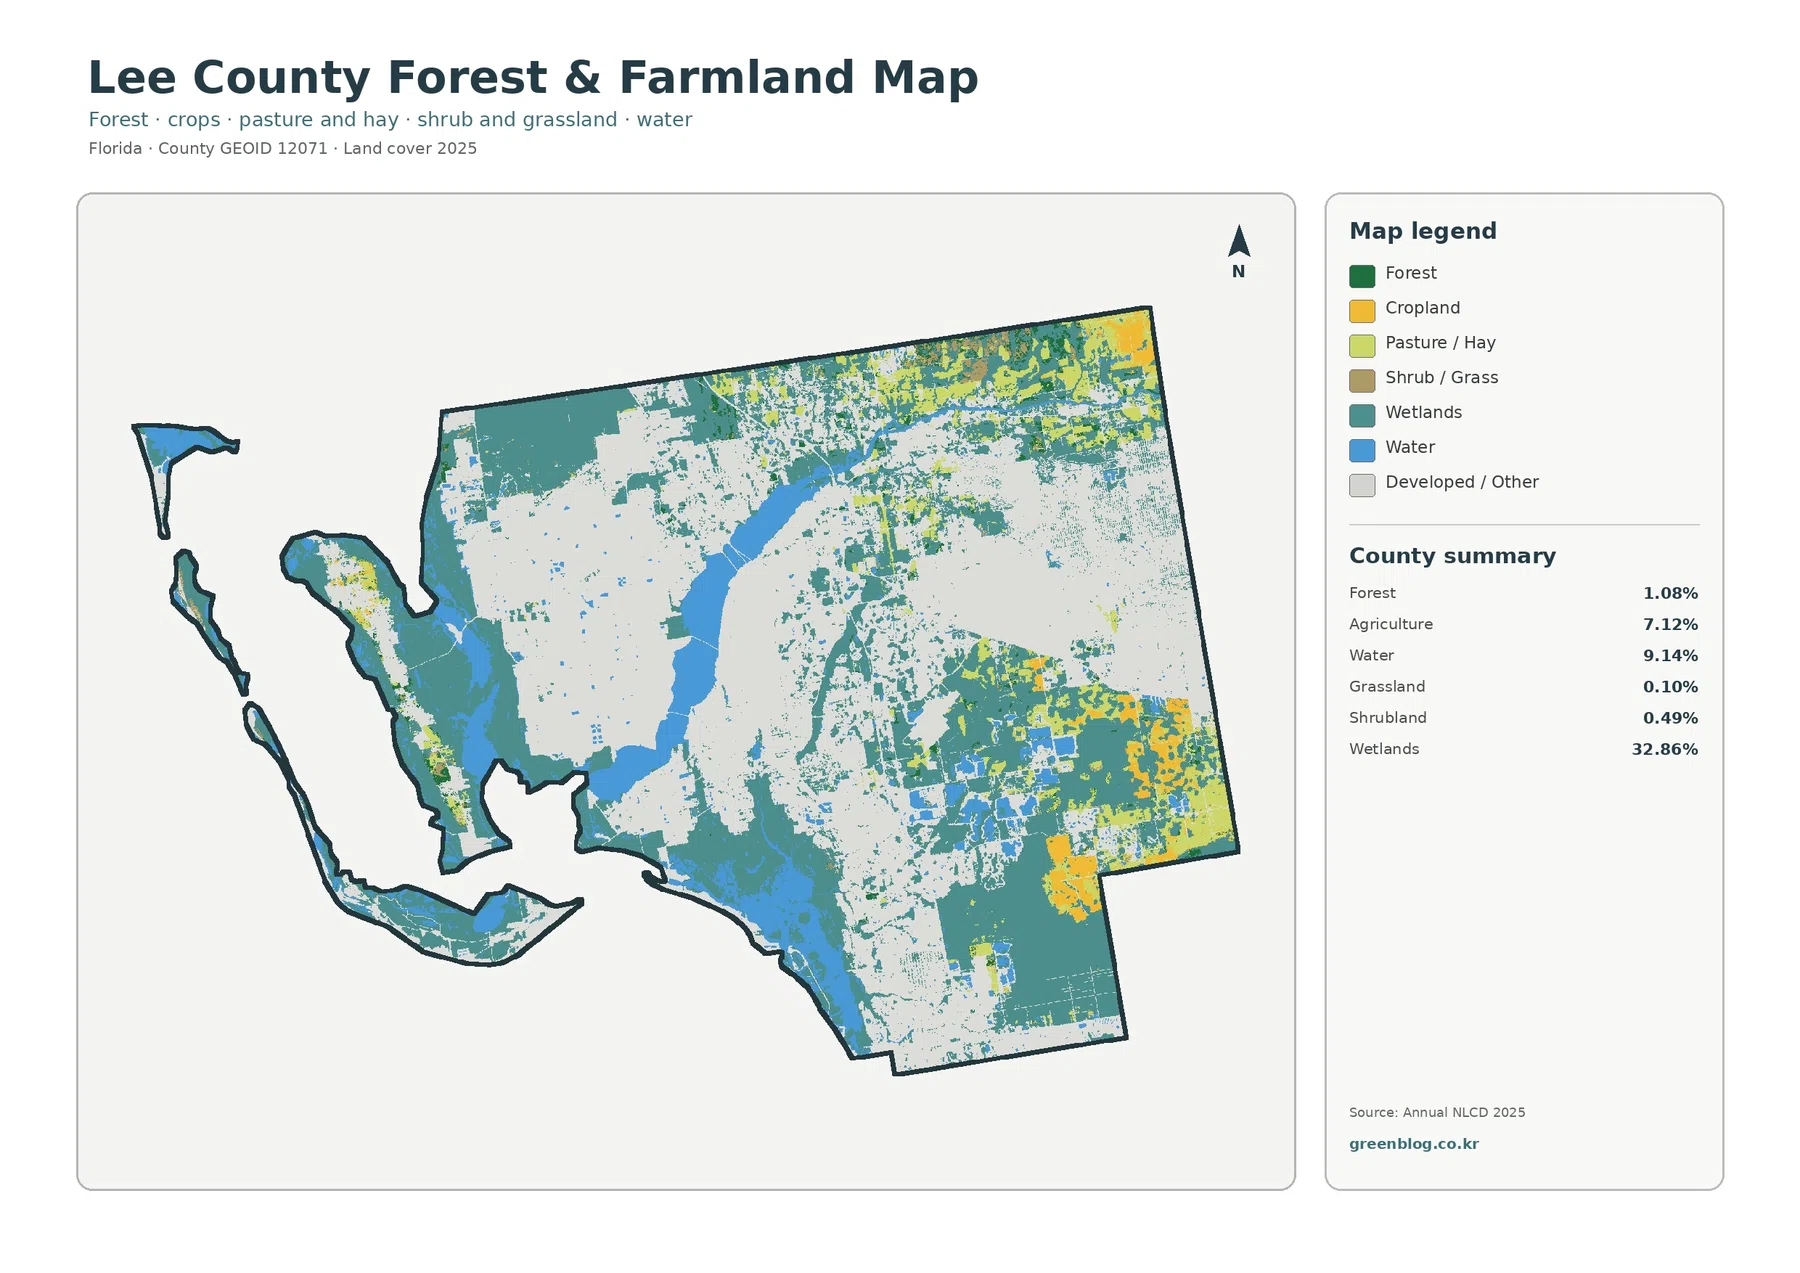
By fading much of the developed and other land into a light background, the forest-and-farmland view makes the natural and working-land classes easier to compare. Wetlands stand out strongly in the northwest and southeast, while agricultural blocks are more obvious toward the eastern side. The western mainland remains dominated by developed or other cover rather than farms or large forest tracts.
Agriculture occupies 7.12% of the county, which is modest compared with developed land and wetlands but still forms distinct blocks. UF/IFAS Extension Lee County maintains agriculture and natural-resources programs that address crop production, livestock, range management, and environmental practices. This local program provides useful background, although the yellow land-cover class does not identify crop type, farm ownership, or agricultural zoning.
Forest cover is only 1.08%. On the simplified map, green areas are scattered among wetlands, agricultural land, and developed or other surfaces. This makes the forest map more useful for locating remaining wooded patches than for describing a single forested region. The county’s natural land pattern is much more strongly defined by wetlands than by forest percentage.
Grassland is 0.10% and shrubland 0.49%, both very small shares. Small classes can disappear visually when the map is reduced to browser size, so close inspection is best done with the original JPG. Their boundaries should still be treated as generalized raster classification rather than exact field or parcel lines.
An 18.18% mean impervious share reveals a broad network of hard surfaces
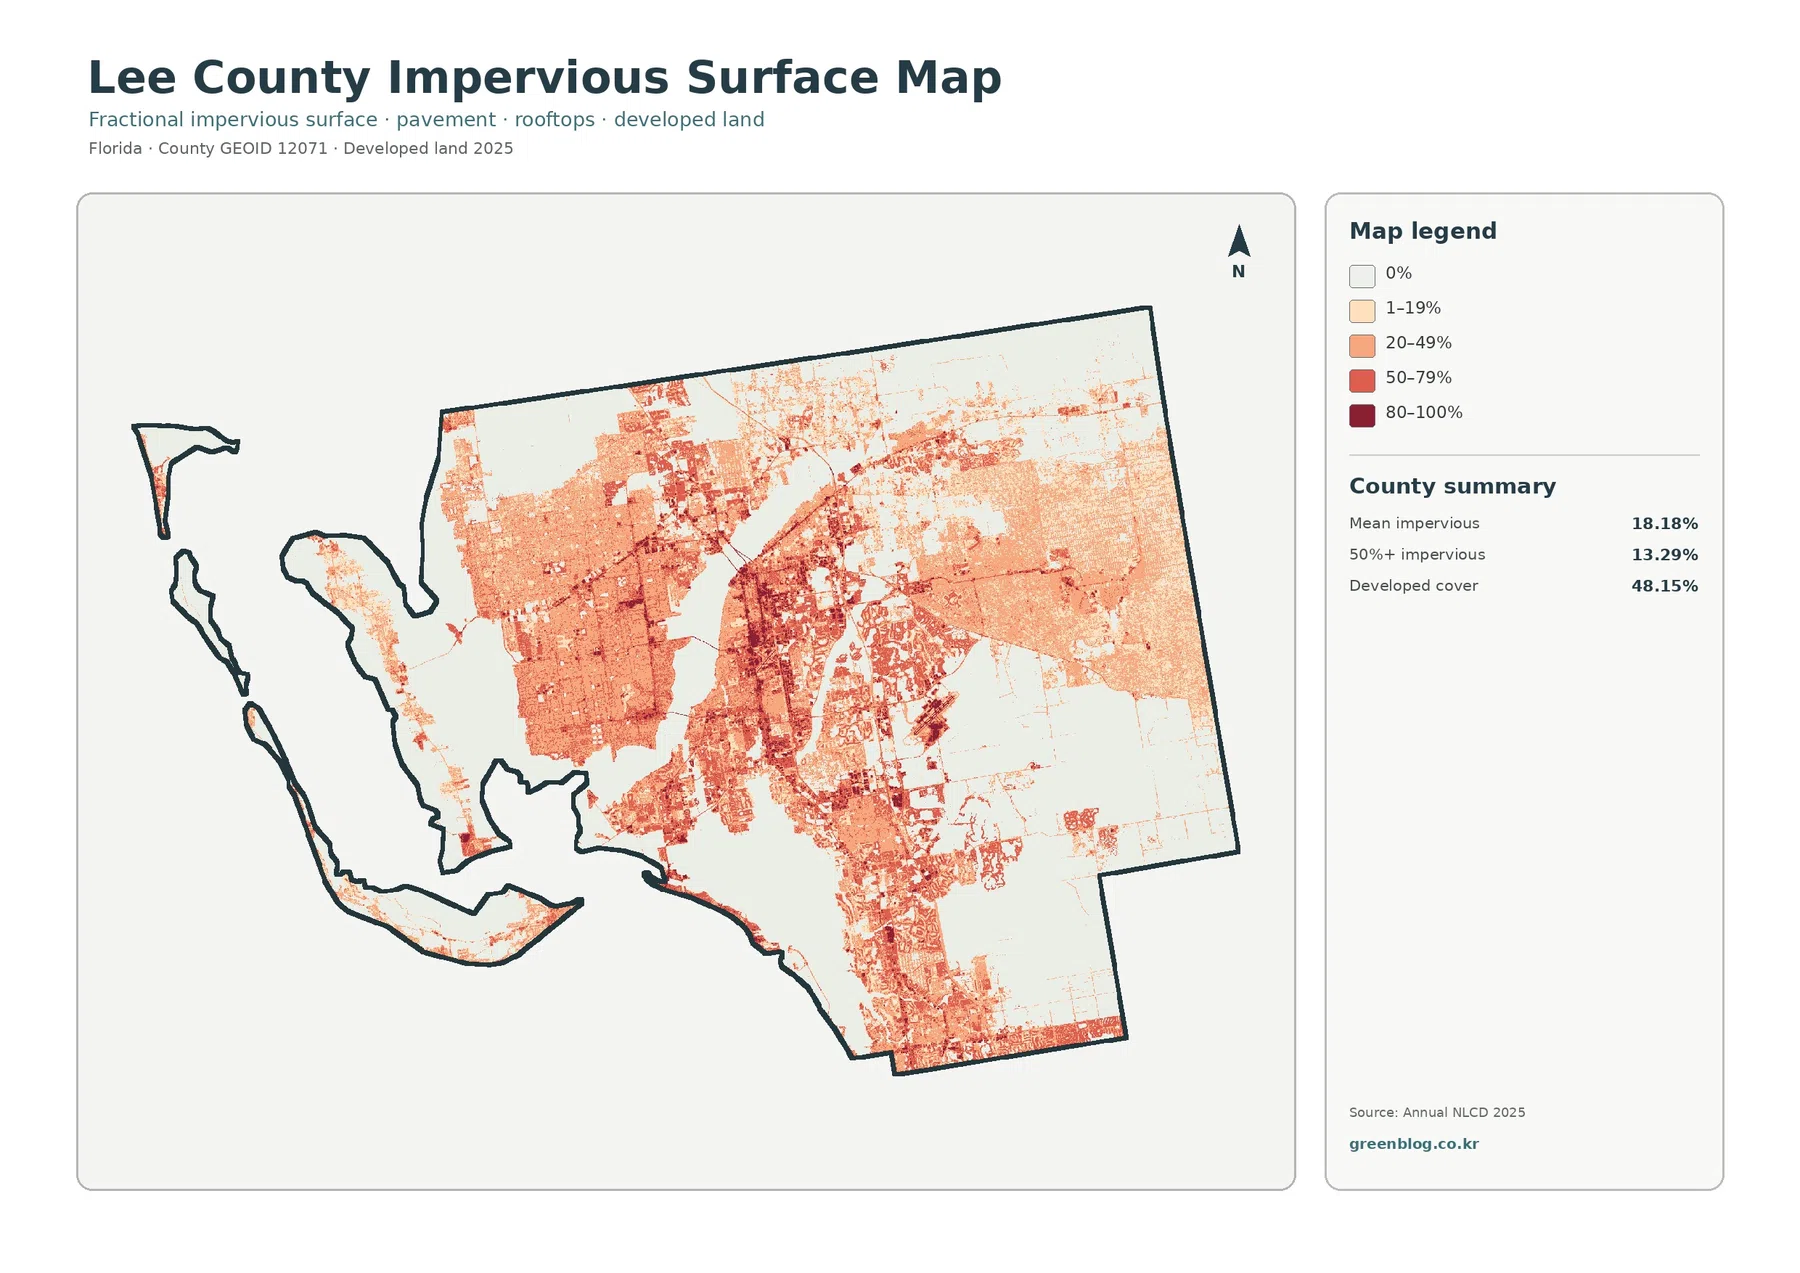
Impervious surface means pavement, rooftops, parking areas, and similar hard cover that does not readily absorb rainfall. Lee County’s mean impervious value is 18.18%, and 13.29% of the county is mapped at 50% or greater imperviousness. Those figures are lower than the 48.15% developed-cover share because developed land can also contain lawns, trees, soil, canals, ponds, and other permeable or water surfaces.
The darkest impervious colors are widespread through the central and western developed areas, including both sides of the Caloosahatchee corridor. Additional high-value zones extend southward, while the northwestern wetland area and parts of the eastern county remain much lighter. The contrast shows that even a county with nearly half its area classified as developed still contains large places with little hard surface.
Lee County Planning guides growth and development in unincorporated areas through the Lee Plan and related regulatory standards. The impervious map can show where hard surfaces are concentrated, but it cannot answer zoning, permitting, density, ownership, or parcel questions. Legal land use must be checked through the county’s planning and permitting resources rather than inferred from map color.
For watershed or environmental education, it is useful to compare impervious intensity with the general wetland and water map. Developed areas sit close to the Caloosahatchee and other wetland-rich landscapes in several parts of the county. Proximity alone does not prove a specific cause or impact, so drainage, rainfall, water-quality, and historical-development data are needed for any detailed environmental conclusion.
The 1985–2025 comparison reports a 13.99% transition to developed classification
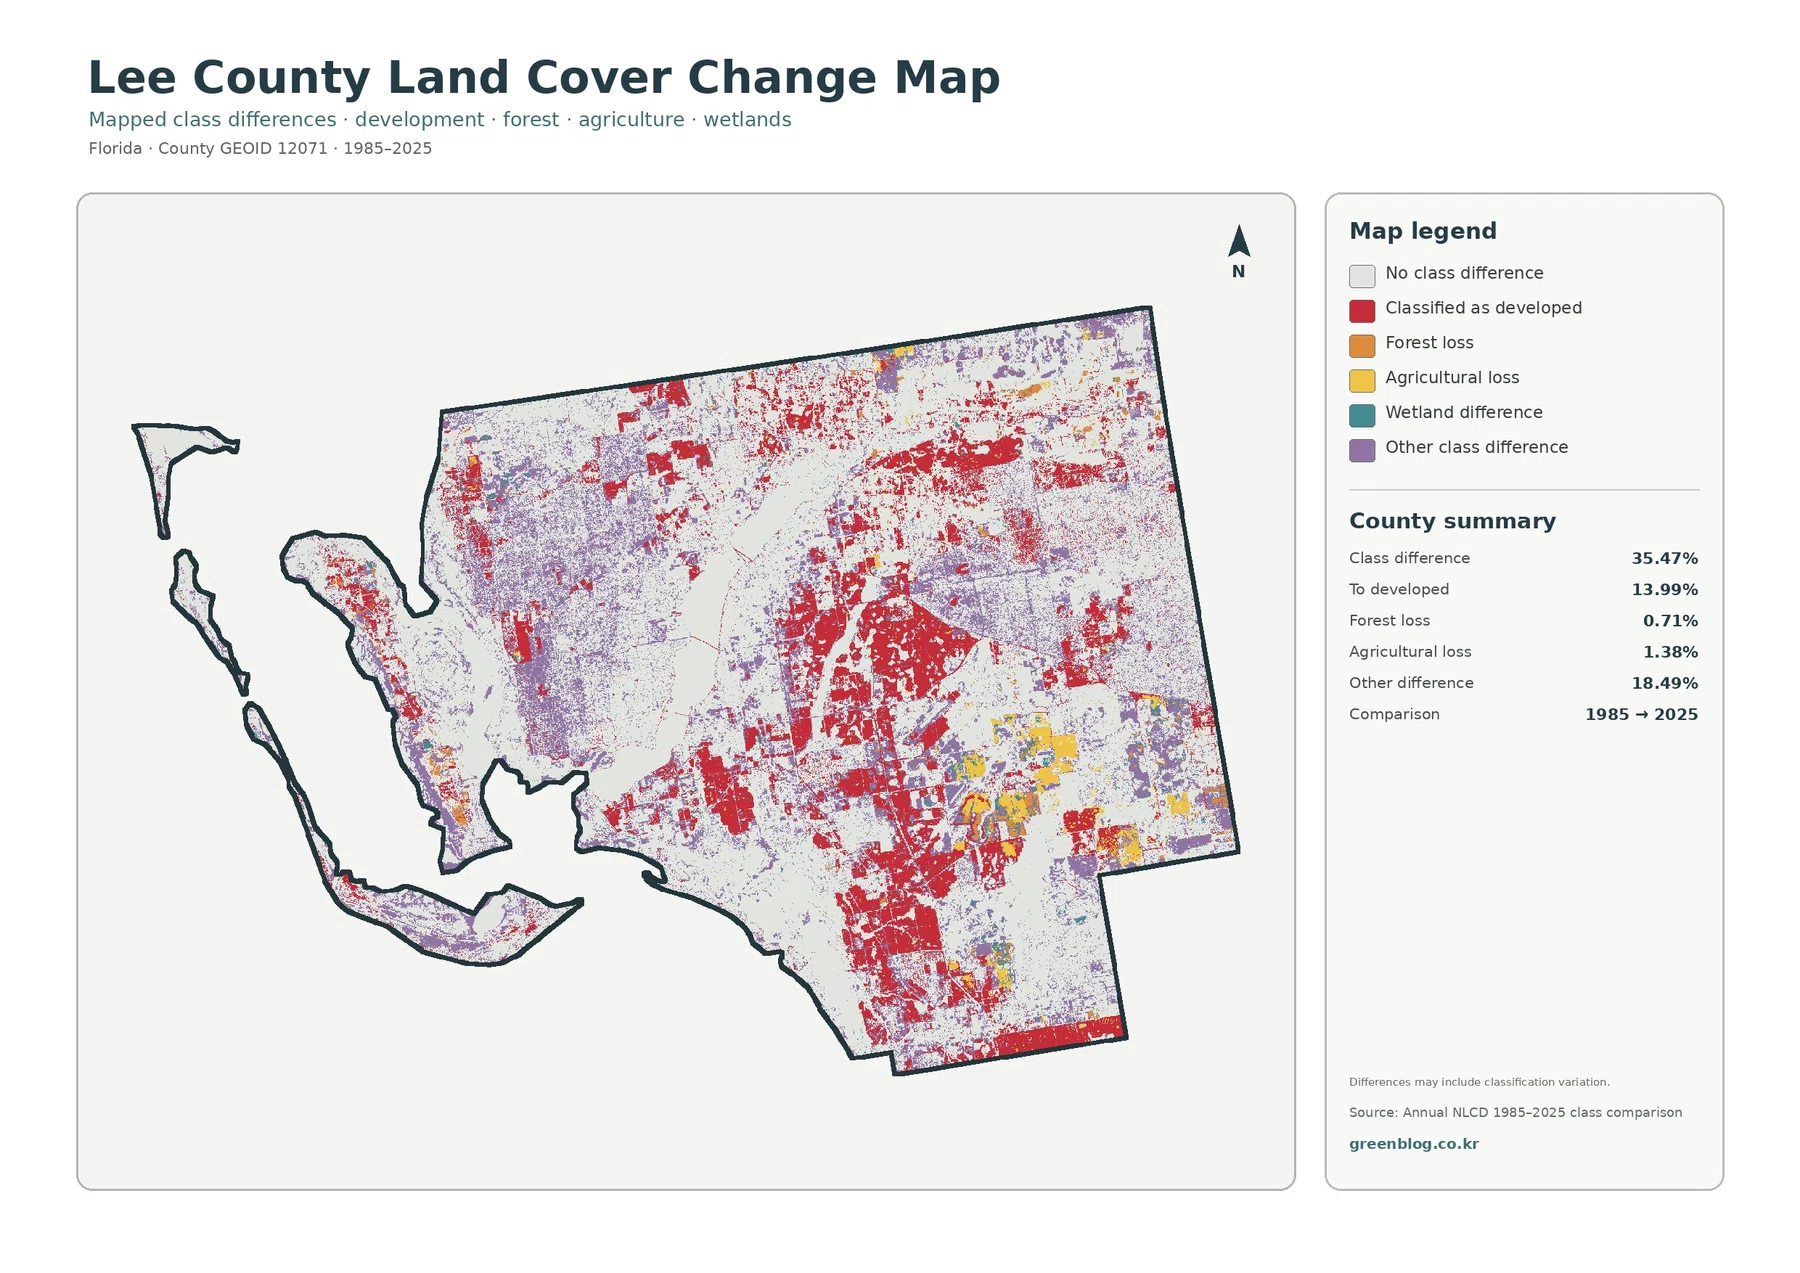
The 1985–2025 comparison reports class differences across 35.47% of Lee County. Areas classified as a transition to developed cover account for 13.99%, forest loss for 0.71%, agricultural loss for 1.38%, and other class differences for 18.49%. Red developed-transition areas are prominent through the central and southern mainland and also appear in other developed parts of the county.
Some of the largest red areas occur near places that now show high impervious intensity, but the two maps should not be treated as the same measurement. Imperviousness describes the fraction of hard surface in the 2025 developed landscape, while the change map compares class labels between two years. One can help contextualize the other, but it does not prove the timing or cause of a specific transition.
A note on the comparison map states that the differences may include classification variation. The 35.47% figure should therefore not be interpreted as a literal percentage of Lee County that physically changed on the ground. Differences in imagery, season, classification rules, and mixed pixels can assign different classes to the same location even when the landscape change is more subtle.
Only the endpoints 1985 and 2025 are shown. The map does not describe what happened in the intervening years or whether a location changed more than once. Anyone studying development history or wetland change in detail should compare additional Annual NLCD years, aerial photography, and local records. The two-date map works best as a screening tool for locations that merit closer review.
The Caloosahatchee and Estero Bay help explain why water, development, and wetlands sit so close together
Lee County Natural Resources describes the Caloosahatchee River Basin as following the river from Lake Okeechobee to San Carlos Bay. On the land-cover map, the river cuts through a heavily developed part of the county before reaching coastal waters. This creates one of the clearest visual relationships in the map set: extensive built land lies directly beside a major river and estuarine system.
Farther south, the county’s Estero Bay watershed page describes a low, flat landscape historically dominated by wetlands and slow drainage. The 2025 map still shows broad wetland cover through the southern and southeastern portions of Lee County, even as developed land is extensive nearby. This makes the county a useful example for comparing urbanized areas with wetland-rich lowlands on the same map.
Conservation 20/20 is Lee County’s official environmentally sensitive land acquisition and stewardship program. The county states that the program protects about 30,000 acres of conservation land. That acreage is not a land-cover percentage and should not be substituted for the wetland figure, but it provides policy context for why natural land management is a significant local issue.
Cape Coral and Fort Myers are associated with the developed Caloosahatchee corridor, yet the map does not display municipal boundaries. A red developed pixel should not be read as a city-limit line. The county-wide map is intended to show land-cover classes, while city boundaries, parcels, zoning, and ownership require separate administrative maps.
The four-map set works best when each layer answers a different question
Start with the general land-cover map when the goal is to understand the county-wide balance between developed land, wetlands, water, and agriculture. The 48.15% developed and 32.86% wetland shares immediately show that Lee County is both highly urbanized and still extensively wet. That combination is more informative than describing the county with either urban or natural cover alone.
Next, the impervious map can refine the developed-land picture by showing where hard surfaces are most concentrated. The forest-and-farmland map is better for finding agricultural blocks and the limited forest patches within a wetland-rich county. The change map then adds a historical comparison, identifying places whose class labels differ between 1985 and 2025.
Land cover is a description of what physically covers the ground, not a statement about legal land use. A place classified as developed is not automatically zoned for additional construction, and a wetland-classified pixel is not by itself a regulatory wetland boundary. Planning, permitting, ownership, and parcel decisions require official legal and cadastral records.
The original JPG files are useful for close inspection and presentation graphics
The download ZIP contains four 2480×1754 pixel JPG files: 2025 land cover, forest and farmland, impervious/developed land, and the 1985–2025 land-cover comparison. The original files make it easier to enlarge legends, inspect small agricultural or wetland patches, and place the maps into documents or slides without relying on the reduced WebP previews.
These are raster maps, meaning the landscape is represented as a grid of cells and each cell receives a representative class or value. Real ground conditions are more complicated than the sharp color boundaries suggest. A single cell may include pavement, vegetation, water, and structures, so the map should be used for county-scale comparison rather than parcel surveying.
At 2480×1754 pixels, the JPG files are useful for screens and many documents, but they are below the pixel dimensions normally associated with a full A3 print at 300 dpi. If the map will be enlarged for printing, check the legend and small labels at the intended output size before relying on it for a large poster.
Frequently Asked Questions
What is the largest 2025 land-cover class in Lee County?
Developed land is the largest category at 48.15%. Wetlands follow at 32.86%, with water at 9.14%, agriculture at 7.12%, and forest at 1.08%. The county therefore combines a very large developed footprint with extensive wetland and water cover.
Why is developed cover 48.15% while mean impervious cover is 18.18%?
The two measurements are different. Developed land can include rooftops and pavement along with lawns, trees, soil, canals, and other permeable or water surfaces. Impervious cover focuses on hard surfaces that do not readily absorb water, so its county-wide average is lower.
Does the 35.47% 1985–2025 class difference equal the true physical change rate?
No. The map notes that classification variation may be included. Different imagery and classification can assign different labels without representing the same amount of physical landscape change. Important locations should be checked with aerial imagery, additional years, and local records.
Map File Information
Download the four original Lee County land-cover JPG maps together in one ZIP file.
- Included Files: Use only the versions confirmed in the article and supplied images
- File Type: Use the confirmed download contents
- Intended Use: Printing, education, presentations, and map-based projects
Related Maps
- Alachua County Florida Land Cover Map
- Baker County Florida Land Cover Map
- Bay County Florida Land Cover Map
Sources and References
- MRLC Annual NLCD Data – Official source for Annual NLCD land-cover data.
- USGS Annual NLCD Land Cover Classification – Explains the major Annual NLCD land-cover classes.
- U.S. Census Bureau TIGER/Line Shapefiles – Official geographic boundary data for county reference.
- Lee County Caloosahatchee Watershed – Official county background on the river and watershed.
- Lee County Conservation 20/20 – Official conservation-land acquisition and stewardship information.
- UF/IFAS Extension Lee County Agriculture & Natural Resources – Local agriculture and natural-resource education.
Green Map creates custom-edited map images using open geographic data sources such as geoBoundaries, Natural Earth, OpenStreetMap, and government open data.
These maps are edited visual materials, not raw data files, and are provided for education, documents, presentations, and graphic reference.