Lake County is one of the clearest examples in central Florida of water, wetlands, development, and working land sharing the same county at a large scale. Wetlands are the largest 2025 class at 30.95%, but developed land at 20.16% and agriculture at 20.09% are nearly equal to each other. Water also occupies 11.43%, and the map is filled with lakes through the central and southern portions. Forest becomes more prominent in the long northern extension and along several outer edges.
The page includes four complementary views: 2025 land cover, forest and farmland, impervious surface, and a 1985–2025 land-cover class comparison. The WebP maps are optimized for reading on the page, while all four original JPG files are available together in the download box below. The set can be used for county reference, environmental education, planning context, presentations, and broad comparisons of water, wetlands, built cover, agriculture, and forest.
Table of Contents
A lake-rich landscape puts wetlands and open water at the center of the 2025 pattern
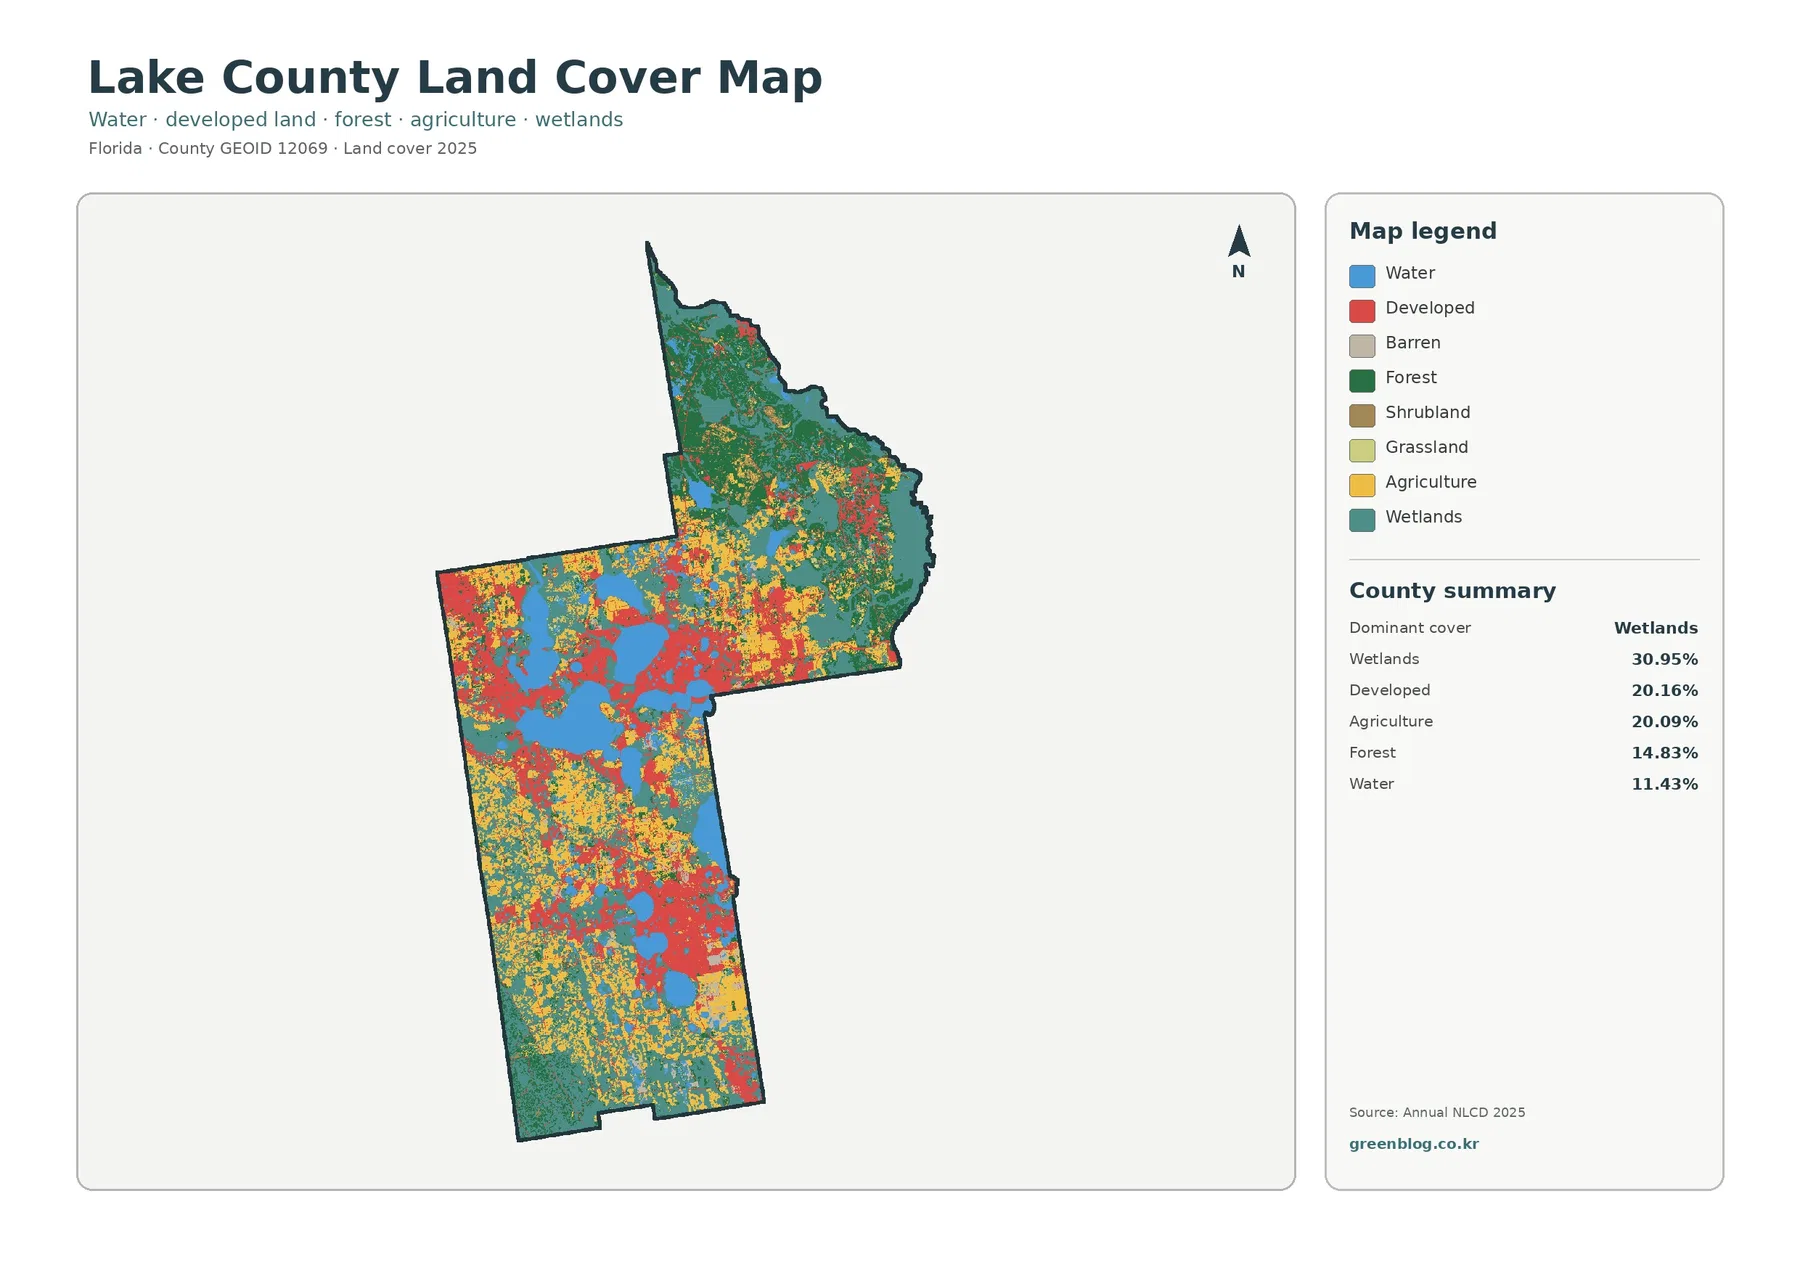
Wetlands are the dominant class at 30.95%, shown in teal across much of the county. They are especially extensive through the northern extension, eastern side, and around many of the central lakes. Wetland patches also continue through the south, often separating developed or agricultural areas. The statewide land-cover categories used here describe surface cover from raster classification and should not be treated as legal wetland boundaries.
Water accounts for 11.43%, which has a strong visual effect even though it ranks below several land classes. Large blue lakes cluster through the west-central and central parts of the county, while additional water bodies continue southward. Because these lakes occupy so much visible space, development, agriculture, and wetlands often appear as bands or patches around water rather than as one continuous block. Reading the map from the lakes outward is an effective way to understand Lake County’s overall pattern.
Developed land represents 20.16%, only slightly more than agriculture at 20.09%. Red developed cover is concentrated through central and southern settlement areas and around several larger lakes. Yellow agricultural cover is mixed among those developed zones and extends into broader open areas away from the strongest built concentrations. Similar countywide percentages therefore produce different shapes: development is more clustered, while agriculture often forms wider areas between water, wetlands, and forest.
Forest makes up 14.83%. Dark green is most continuous in the northern extension and around several outer parts of the county. Through the central and southern sections, forest is more frequently divided by lakes, farms, and developed cover. This distribution helps explain why Lake County does not fit neatly into a single urban, agricultural, or forested description. Several major cover types are close to one another throughout much of the county.
Impervious cover reveals where built surfaces are truly concentrated
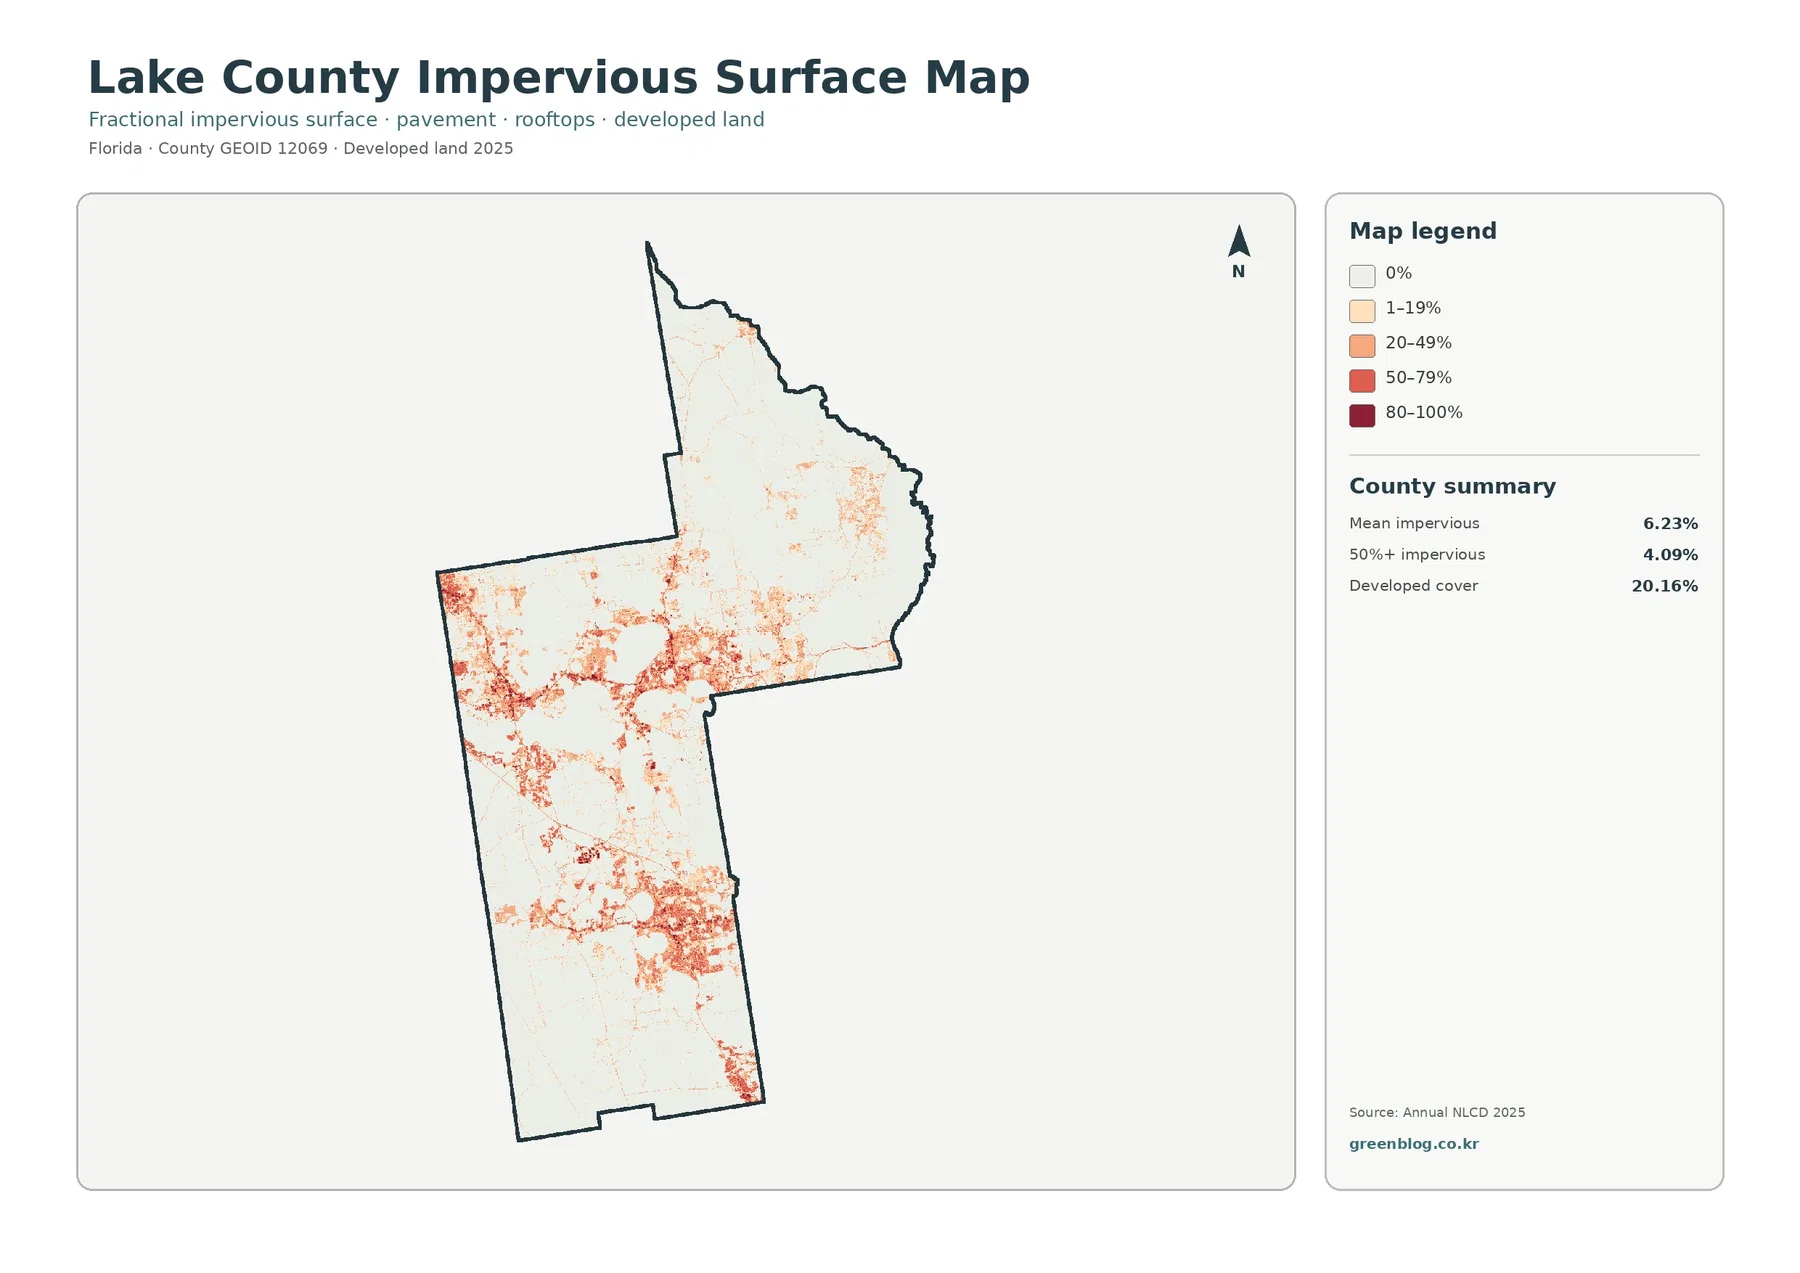
Impervious surface means pavement, rooftops, parking lots, and other hard cover that does not readily absorb rainfall. Lake County’s mean impervious value is 6.23%, while 4.09% of the county is mapped at 50% or greater imperviousness. Those numbers are well below the 20.16% developed-land share because developed classes can also include lawns, trees, bare ground, and other surfaces that remain permeable.
The darkest impervious colors are not spread evenly across the county. They form several clusters through the center and south, with additional concentrations around lake-adjacent settlement areas and connecting roads. The northern extension is much lighter overall. This contrast makes the impervious map useful for separating the broad developed class from the places where hard surfaces are actually most concentrated.
Lake County’s Office of Planning & Zoning separately handles current and long-range planning, development review, permitting, and consistency with the Comprehensive Plan in unincorporated areas. That distinction matters when using a land-cover map. A high impervious value does not establish zoning, development rights, parcel ownership, or future land use. Those legal and planning questions require the county’s official records rather than satellite land-cover classes.
The impervious view becomes especially useful when compared with the many lakes and wetlands on the general map. A reader can see where hard surfaces sit close to large water bodies or wet areas and where the surrounding landscape remains more permeable. The map alone cannot determine flood risk, drainage performance, or water quality. Those questions also depend on elevation, soils, stormwater infrastructure, rainfall, and watershed conditions.
Working land and forest shift noticeably between the north and the lake-filled center
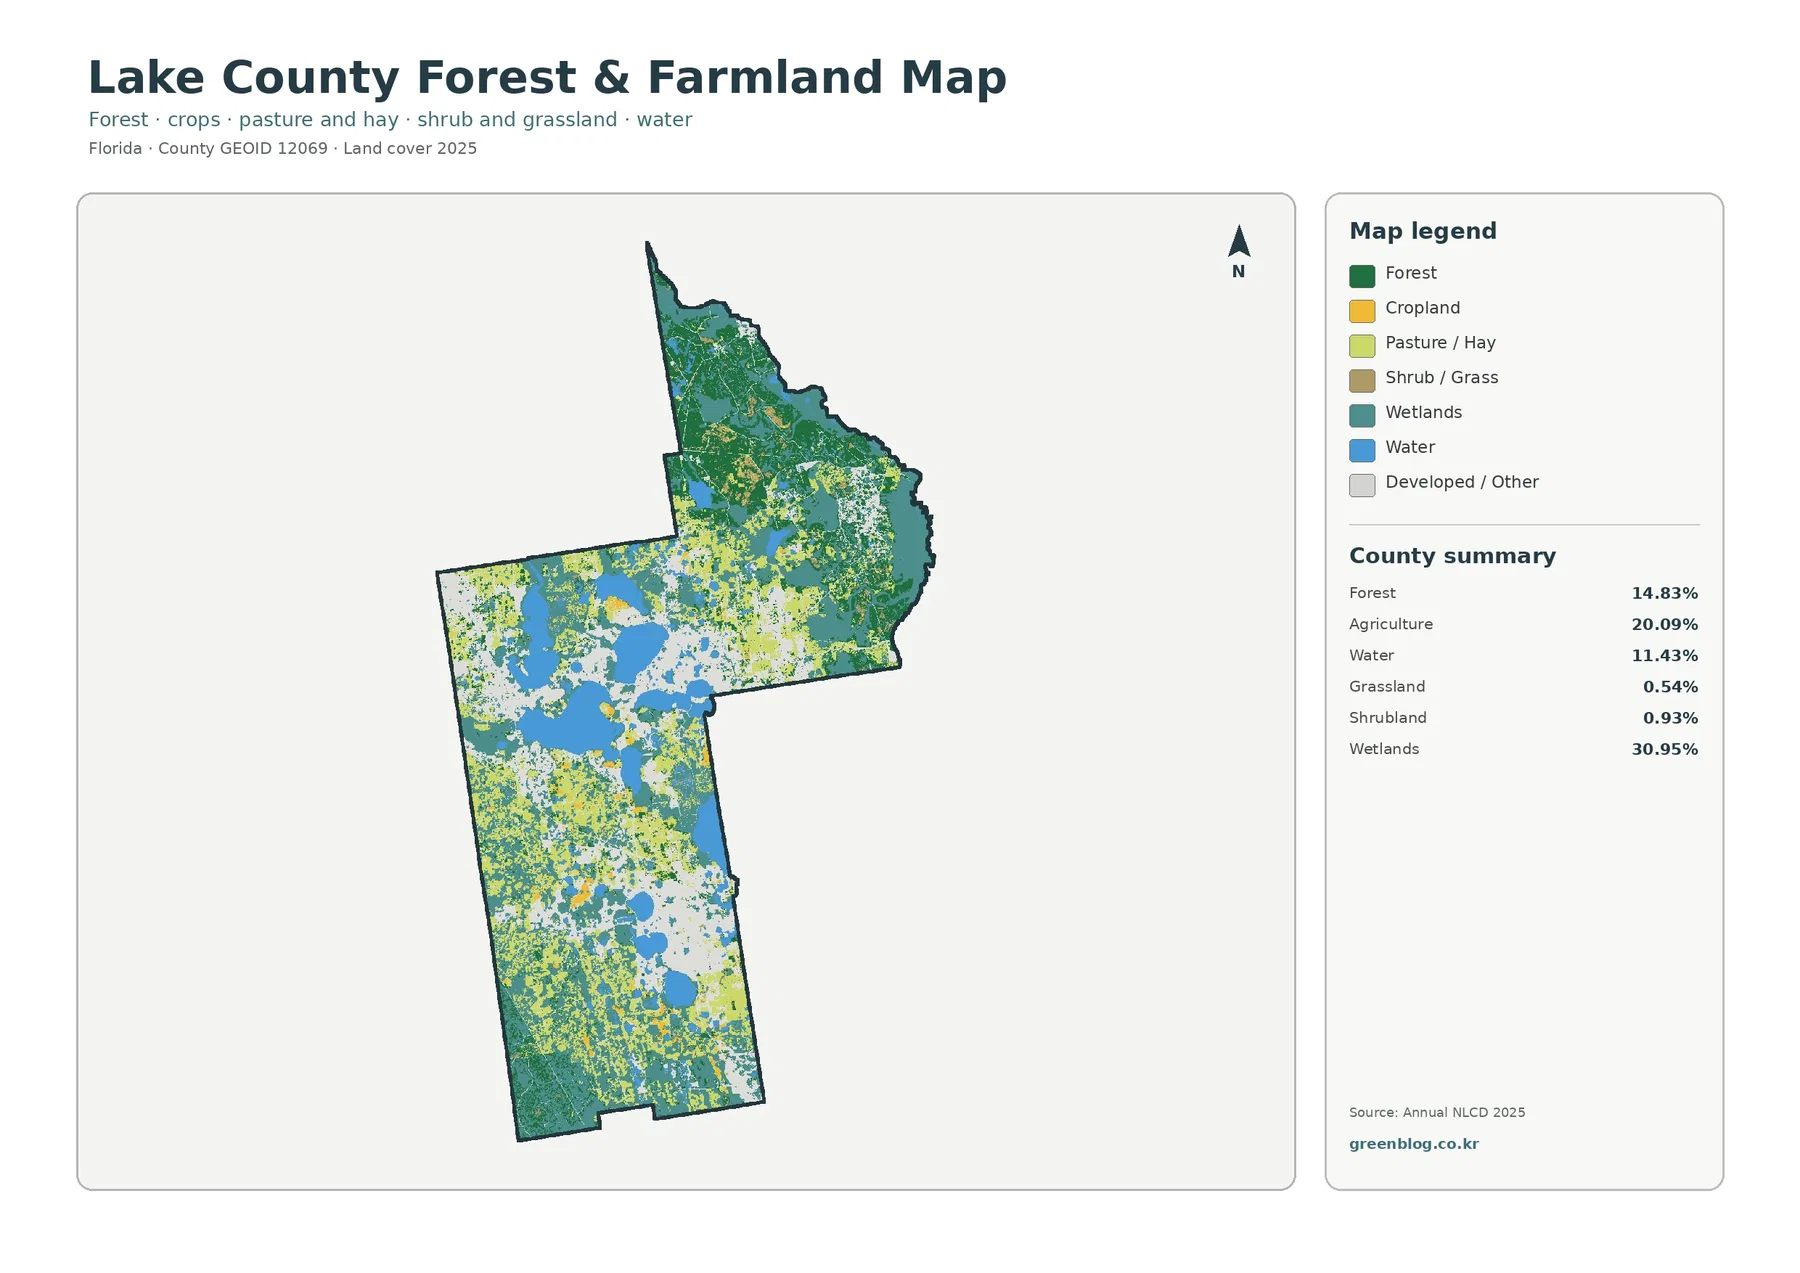
The forest-and-farmland map simplifies developed and other classes so that working land and wooded cover are easier to compare. Forest is most continuous through the northern extension, where it repeatedly meets wetlands. Agriculture is more visible through the central and southern parts of the county, mixed among lakes and developed areas. This north-to-center shift is easier to see here than on the general land-cover map.
Agriculture covers 20.09% of Lake County, a substantial share despite the county’s large amount of water and development. UF/IFAS Extension Lake County provides education related to livestock, forage, small farms, and natural resources, offering useful local context for the role of working lands. The map does not identify crop types, ownership, or agricultural zoning. Yellow areas simply show places classified as agricultural land cover in the source dataset.
Forest accounts for 14.83%, while grassland is 0.54% and shrubland is 0.93%. The smaller grass and shrub classes appear as scattered pieces rather than large continuous regions. Enlarging the original JPG makes those small categories easier to distinguish from neighboring agriculture or wetlands. For a classroom or presentation, keeping the legend beside any cropped map section is important because several land-cover colors can look similar at reduced size.
Wetlands remain the largest element even in this simplified view. Around the northern forest and throughout the lake-rich center, teal wet areas repeatedly separate or border farms and developed/other cover. A useful interpretation is therefore not simply that Lake County has both farms and forest, but that those land covers are arranged within a landscape strongly shaped by water and wet ground.
The 1985–2025 comparison highlights development as the largest named transition
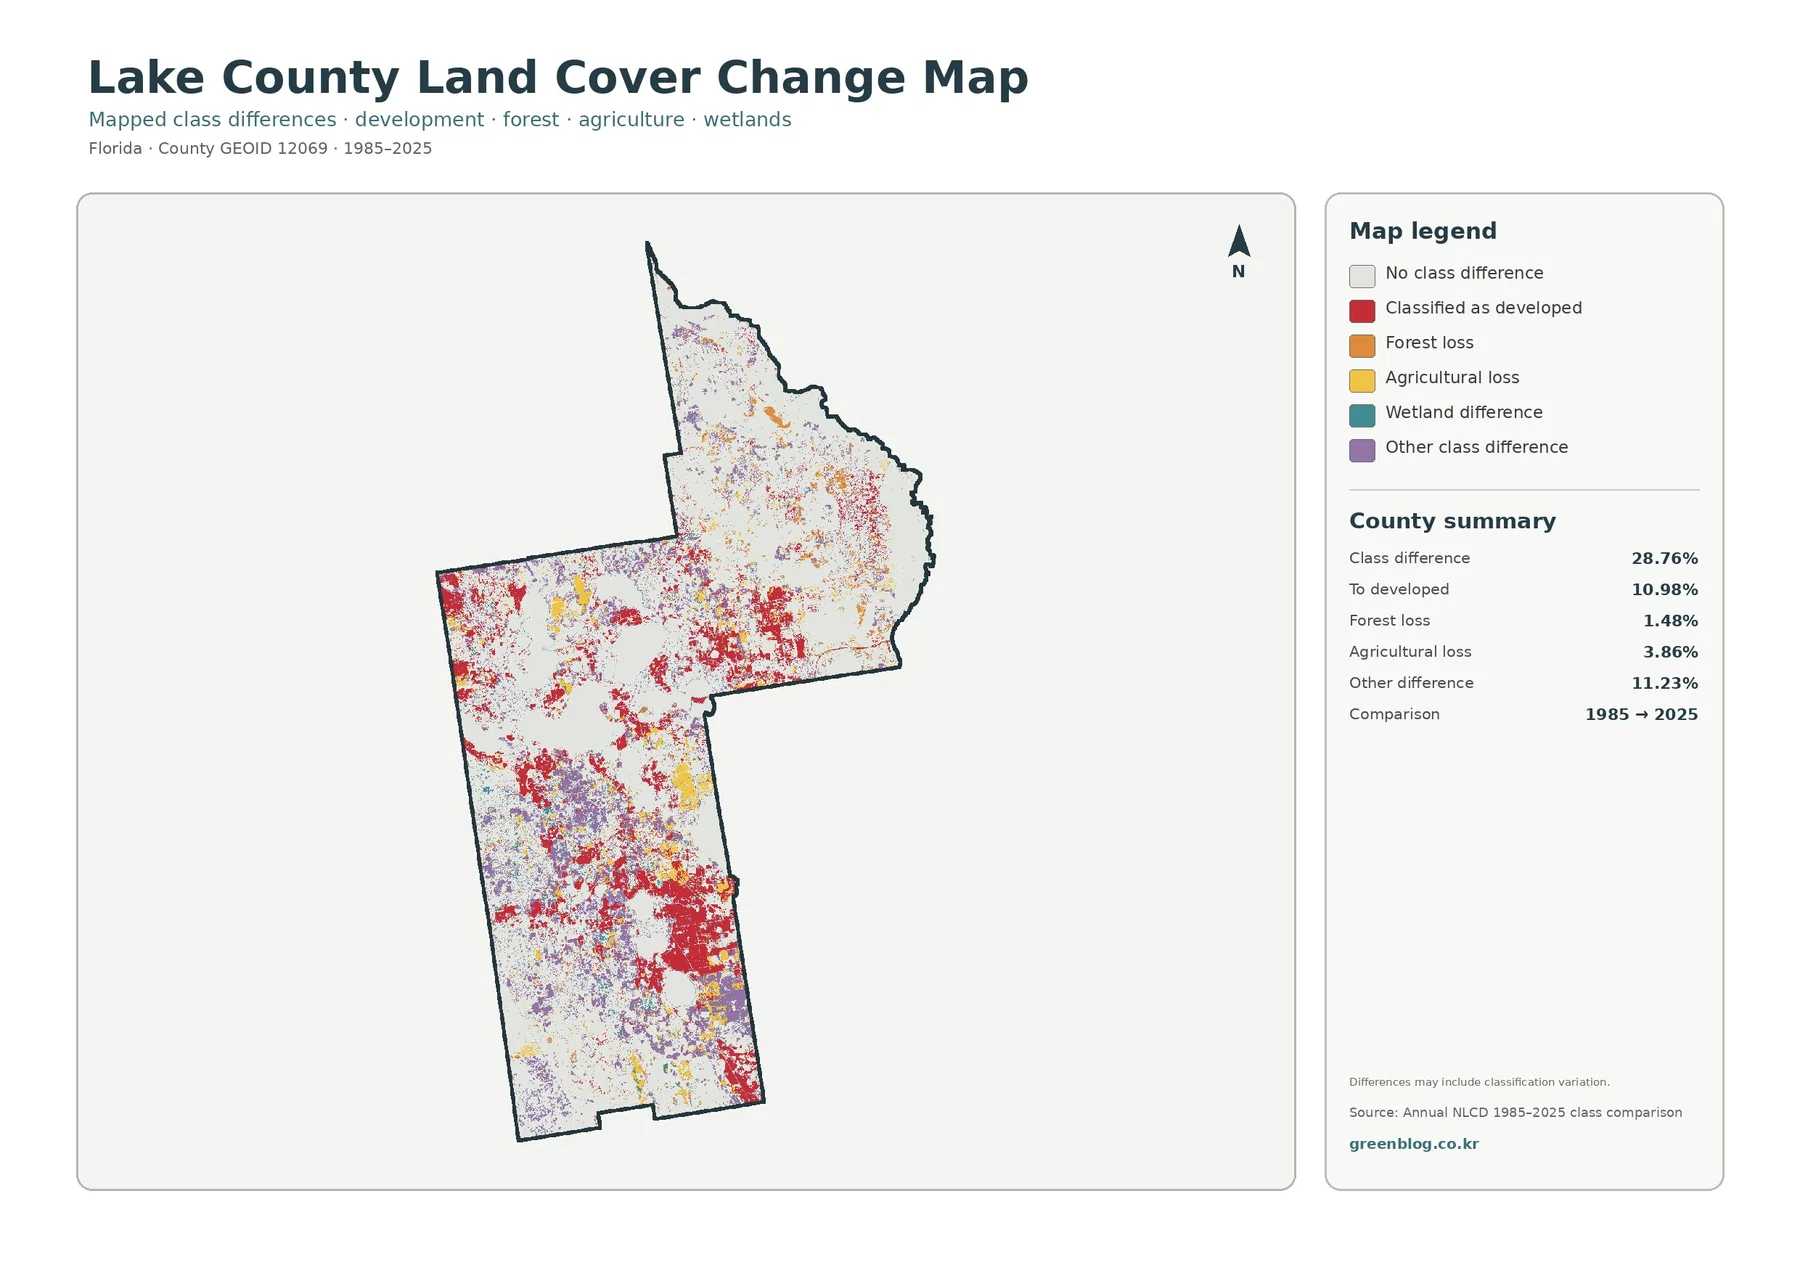
The two-date comparison reports class differences across 28.76% of Lake County. Areas classified as developed account for 10.98%, agricultural loss for 3.86%, forest loss for 1.48%, and other class difference for 11.23%. Red developed transitions are the most visually prominent named category, especially through central and southern parts of the county where current development and impervious cover are also concentrated.
Around the large central lakes, red and purple change colors form a complicated mosaic rather than a single outward edge. Southern Lake County also contains broad zones of developed-class transition, while the northern extension generally shows fewer dense change clusters. Agricultural-loss colors are dispersed through several farming areas. Forest-loss values are smaller countywide and appear in more limited patches.
A note printed on the change map warns that differences may include classification variation. The 28.76% figure therefore should not be treated as a literal rate of physical land conversion. Imagery dates, classification methods, and mixed pixels can produce a different class label without an equivalent change on the ground. Important locations should be checked against aerial photography or additional Annual NLCD years before drawing a detailed conclusion.
Only the 1985 and 2025 endpoints are compared here. The map cannot show when a transition happened during the forty-year interval, whether a location changed more than once, or whether an earlier class later returned. It works best as a screening layer that identifies places for follow-up rather than as a complete development or environmental history.
Lake County’s map set is most useful when water, development, and planning context are kept separate
The county’s many lakes make it tempting to connect every nearby developed or agricultural area directly to water-related causes, but the maps only show spatial association. Development, farms, wetlands, and water often occur close together; the images do not explain why each pattern formed. Keeping observation separate from explanation is especially important in a county where several major land-cover classes occupy similar shares.
UF/IFAS Extension Lake County offers programs in agriculture and natural resources, including livestock, forage, small farms, invasive species, and resource management. That range reflects the variety of land-cover questions that can arise in the county. The four maps can provide a broad visual starting point, while county or Extension sources are better for questions about management practices, specific resources, or local regulations.
For classroom use, starting with the general map makes it easy to identify wetlands and the large number of lakes. The impervious map can then show where the strongest hard-surface clusters occur. The forest-and-farmland map provides a clearer view of the northern forest and agricultural areas, and the change map can be used last to find places where the 1985 and 2025 classifications differ. This sequence keeps each layer’s purpose distinct.
For property or planning research, land cover should remain only one part of the evidence. A raster class describes how the surface was classified, not who owns a parcel, what zoning applies, where a surveyed boundary lies, or whether a proposed use is permitted. Lake County Planning & Zoning maintains separate land-development and comprehensive-planning information for those questions.
The four original JPG maps support closer inspection and presentation use
The download ZIP includes the 2025 land-cover map, forest-and-farmland map, impervious/developed-land map, and the 1985–2025 land-cover comparison. Each original JPG is 2480×1754 pixels. Compared with the reduced WebP previews, the JPG files make it easier to enlarge legends, inspect smaller lake-edge patterns, and place the maps into documents or slides.
These products are raster maps. A raster divides the landscape into cells and assigns each cell a representative land-cover class or impervious value. Real sites are more complicated, and one cell can contain trees, grass, pavement, buildings, or water. For that reason, a sharp color boundary on the map should not be interpreted as a surveyed parcel boundary or a precise edge visible on the ground.
The strongest approach is to cross-check the four views. A developed patch on the general map can be compared with impervious intensity, an agricultural area can be viewed alongside surrounding forest and wetlands, and a class-difference location can be flagged for review in other years or imagery. Using the maps together reduces the risk of turning one color or one percentage into a conclusion the data do not support.
Frequently Asked Questions
What is the largest 2025 land-cover class in Lake County?
Wetlands are the largest class at 30.95%. Developed land is 20.16%, agriculture 20.09%, forest 14.83%, and water 11.43%. The high water share and the large number of visible lakes make water and wetlands especially important when interpreting the county.
Why is developed land 20.16% but mean impervious cover only 6.23%?
The two measurements describe different aspects of the surface. Developed land can include lawns, trees, soil, and other permeable areas in addition to buildings and roads. Impervious cover focuses on hard surfaces such as pavement and rooftops, so the countywide average can be much lower than the developed-land share.
Does the 28.76% 1985–2025 class difference equal the true physical change rate?
No. The map explicitly notes that classification variation may be included. A different class label can result from imagery or classification differences as well as real land-cover change. Aerial photography, additional years, and official local records are appropriate for confirming important locations.
Map File Information
Download the four original Lake County land-cover JPG maps together in one ZIP file.
- Included Files: Use only the versions confirmed in the article and supplied images
- File Type: Use the confirmed download contents
- Intended Use: Printing, education, presentations, and map-based projects
Related Maps
- Alachua County Florida Land Cover Map
- Baker County Florida Land Cover Map
- Bay County Florida Land Cover Map
Sources and References
- MRLC Annual NLCD Data – Official source for Annual NLCD land-cover data.
- USGS Annual NLCD Land Cover Classification – Describes the principal Annual NLCD land-cover classes.
- U.S. Census Bureau TIGER/Line Shapefiles – Official geographic boundary data used for county reference.
- Lake County Planning & Zoning – Official county information on planning, development review, permitting, and the Comprehensive Plan.
- UF/IFAS Extension Lake County – Livestock and Natural Resources – Local programs covering livestock, small farms, forage, and natural-resource management.
Green Map creates custom-edited map images using open geographic data sources such as geoBoundaries, Natural Earth, OpenStreetMap, and government open data.
These maps are edited visual materials, not raw data files, and are provided for education, documents, presentations, and graphic reference.