Pima County stretches across a large part of southern Arizona, with the Tucson urban area concentrated in the east and much more open desert country extending west toward Ajo. The supplied Pima County Map set makes that contrast easy to see. Roads and communities cluster around Tucson, Marana, Oro Valley, and Sahuarita, while the western half contains long road segments, scattered place labels, and many desert washes. The article also includes a terrain-and-water view and an elevation map, and you can download the four matching high-resolution JPG files in one ZIP for printing or closer inspection.
Tucson is the simplest point of reference when first opening the maps. Interstate 10 approaches from the Marana side, passes the Tucson area, and continues east. Interstate 19 runs south from Tucson toward Sahuarita. Farther west, State Route 86 crosses the broad middle of the county toward Ajo, where Route 85 becomes an important north-south reference. Reading those roads together with the county outline immediately shows that Pima County is not one continuous urban landscape: the dense eastern side and the wide western desert look very different at the same scale.
Table of Contents
Start with Tucson, then follow the road network outward
The general county map carries the most useful combination of place names, roads, boundary lines, and drainage. Tucson occupies the busiest part of the map. Catalina Foothills and Oro Valley sit to the north, Marana lies northwest of Tucson, and Tanque Verde appears to the east. Sahuarita is south of the main Tucson area. These places form a relatively tight cluster compared with the long, lightly labeled western portion of the county, so the map gives a strong visual sense of how unevenly development is distributed.
Interstate 10 is the major east-west reference through the Tucson side, while Interstate 19 provides a clear southbound route from the city toward Sahuarita. Route 77 leaves the Tucson area toward the north, and Route 83 is marked in the southeast. Route 86 heads west through the middle of the county near Three Points, eventually reaching the Ajo side, while Route 85 is the prominent north-south road near Ajo. Routes 286 and 386 add useful reference points in the southern and central portions of the map.
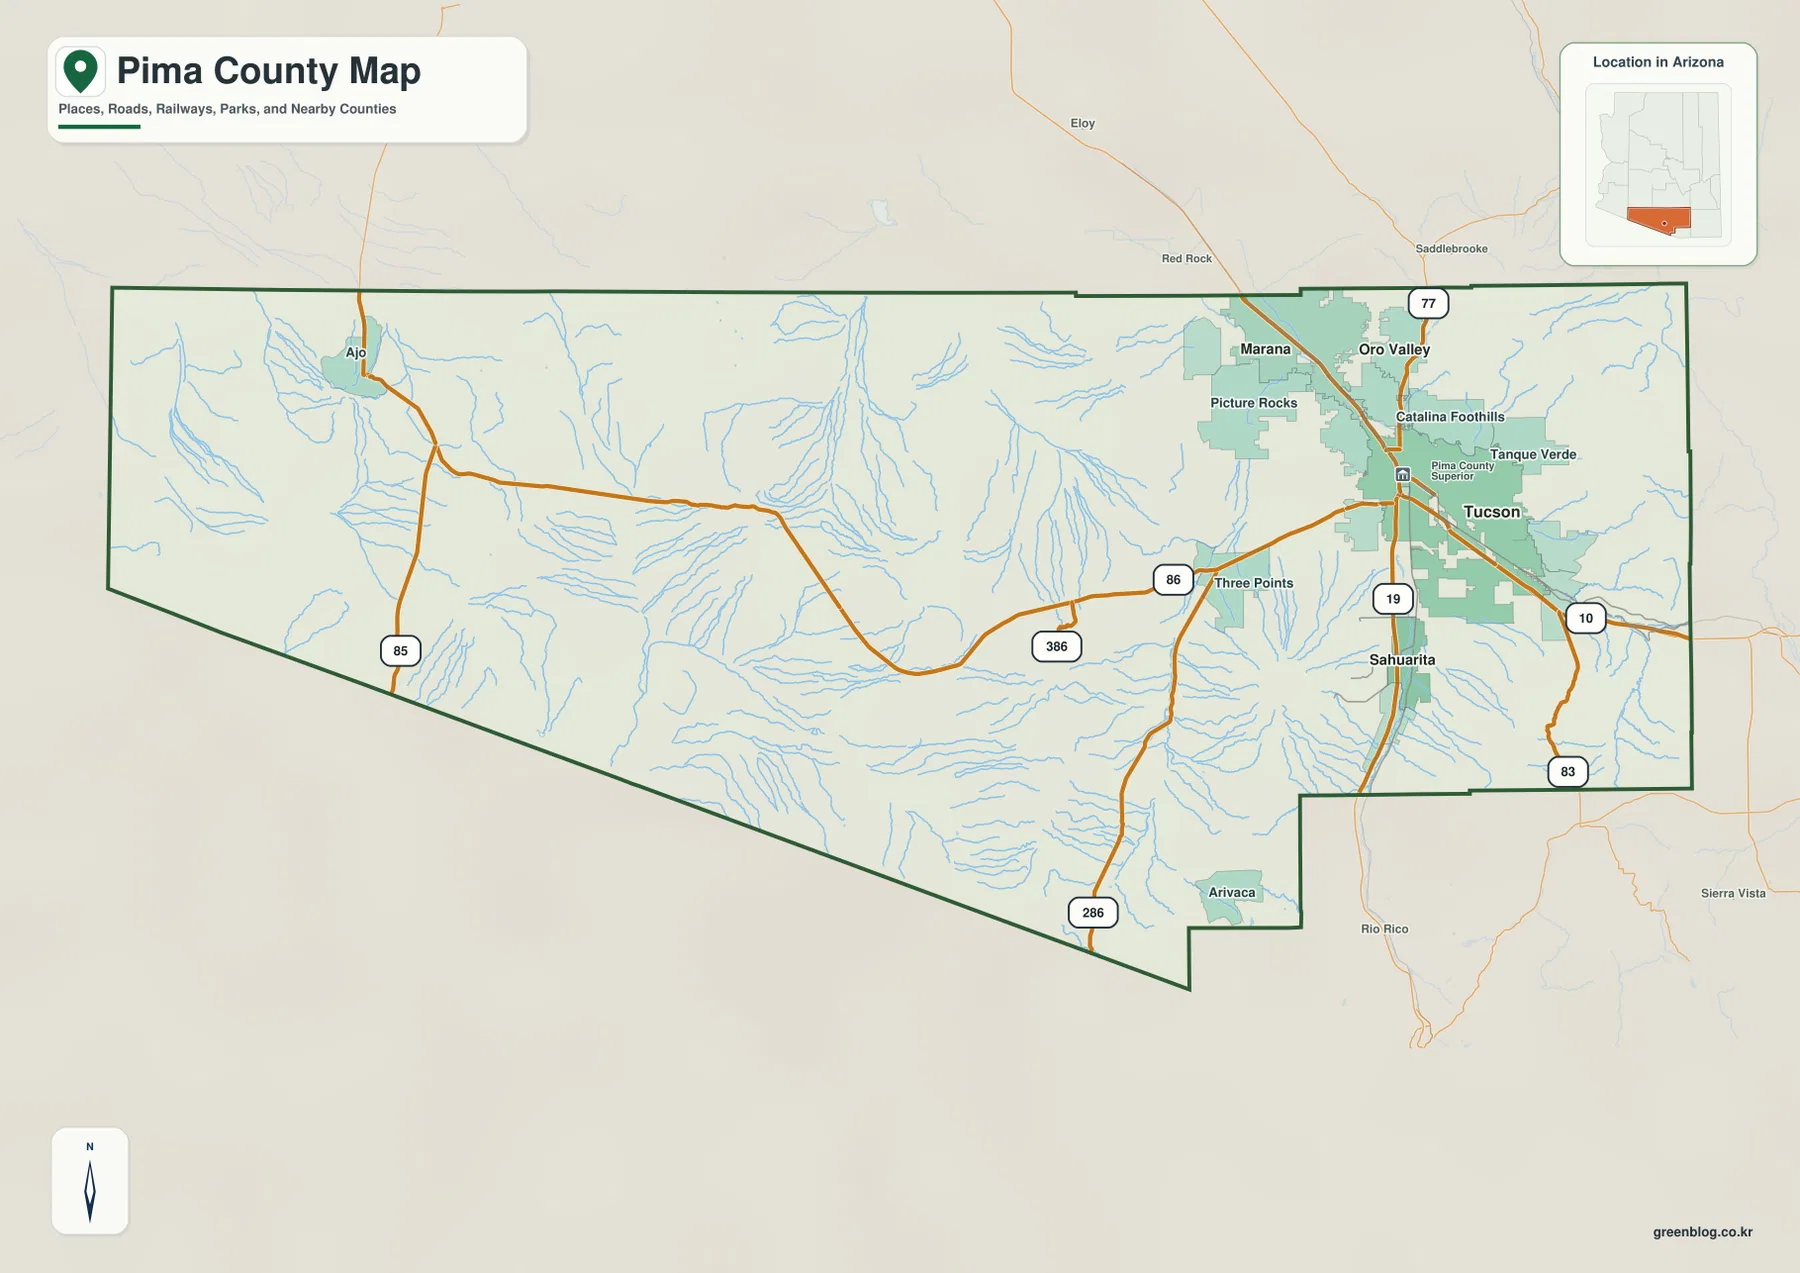
Ajo stands far from the Tucson cluster on the western side, with a broad stretch of desert between the two. Three Points is a useful intermediate label along the Route 86 corridor, and Arivaca appears in the southern part of the county. Those place names help prevent the western and southern sections from being treated as empty space simply because they contain fewer city labels. The map is intended for county-scale orientation, not for current travel time, road closures, parcel boundaries, or turn-by-turn navigation.
The ranked city view shows how strongly the population centers lean east
The simplified city map highlights five ranked places: Tucson, Marana, Oro Valley, Sahuarita, and South Tucson. The printed city index shows Tucson at 547,073, Marana at 56,938, Oro Valley at 48,162, Sahuarita at 35,862, and South Tucson at 4,550. Those figures should be treated as the values embedded in the supplied map, not as a guarantee of the latest population estimates. For this page, their greatest value is that they identify which locations were emphasized by the city-map source.
All five markers lie in the eastern half of the county. Marana is northwest of Tucson, Oro Valley is north of it, Sahuarita is to the south, and South Tucson sits very close to Tucson itself. The western half has no marker in this ranked set even though the general map includes places such as Ajo. This difference is useful because it shows why the city map and the general map answer different questions: one emphasizes a selected group of larger population centers, while the other keeps a broader range of place and road labels.
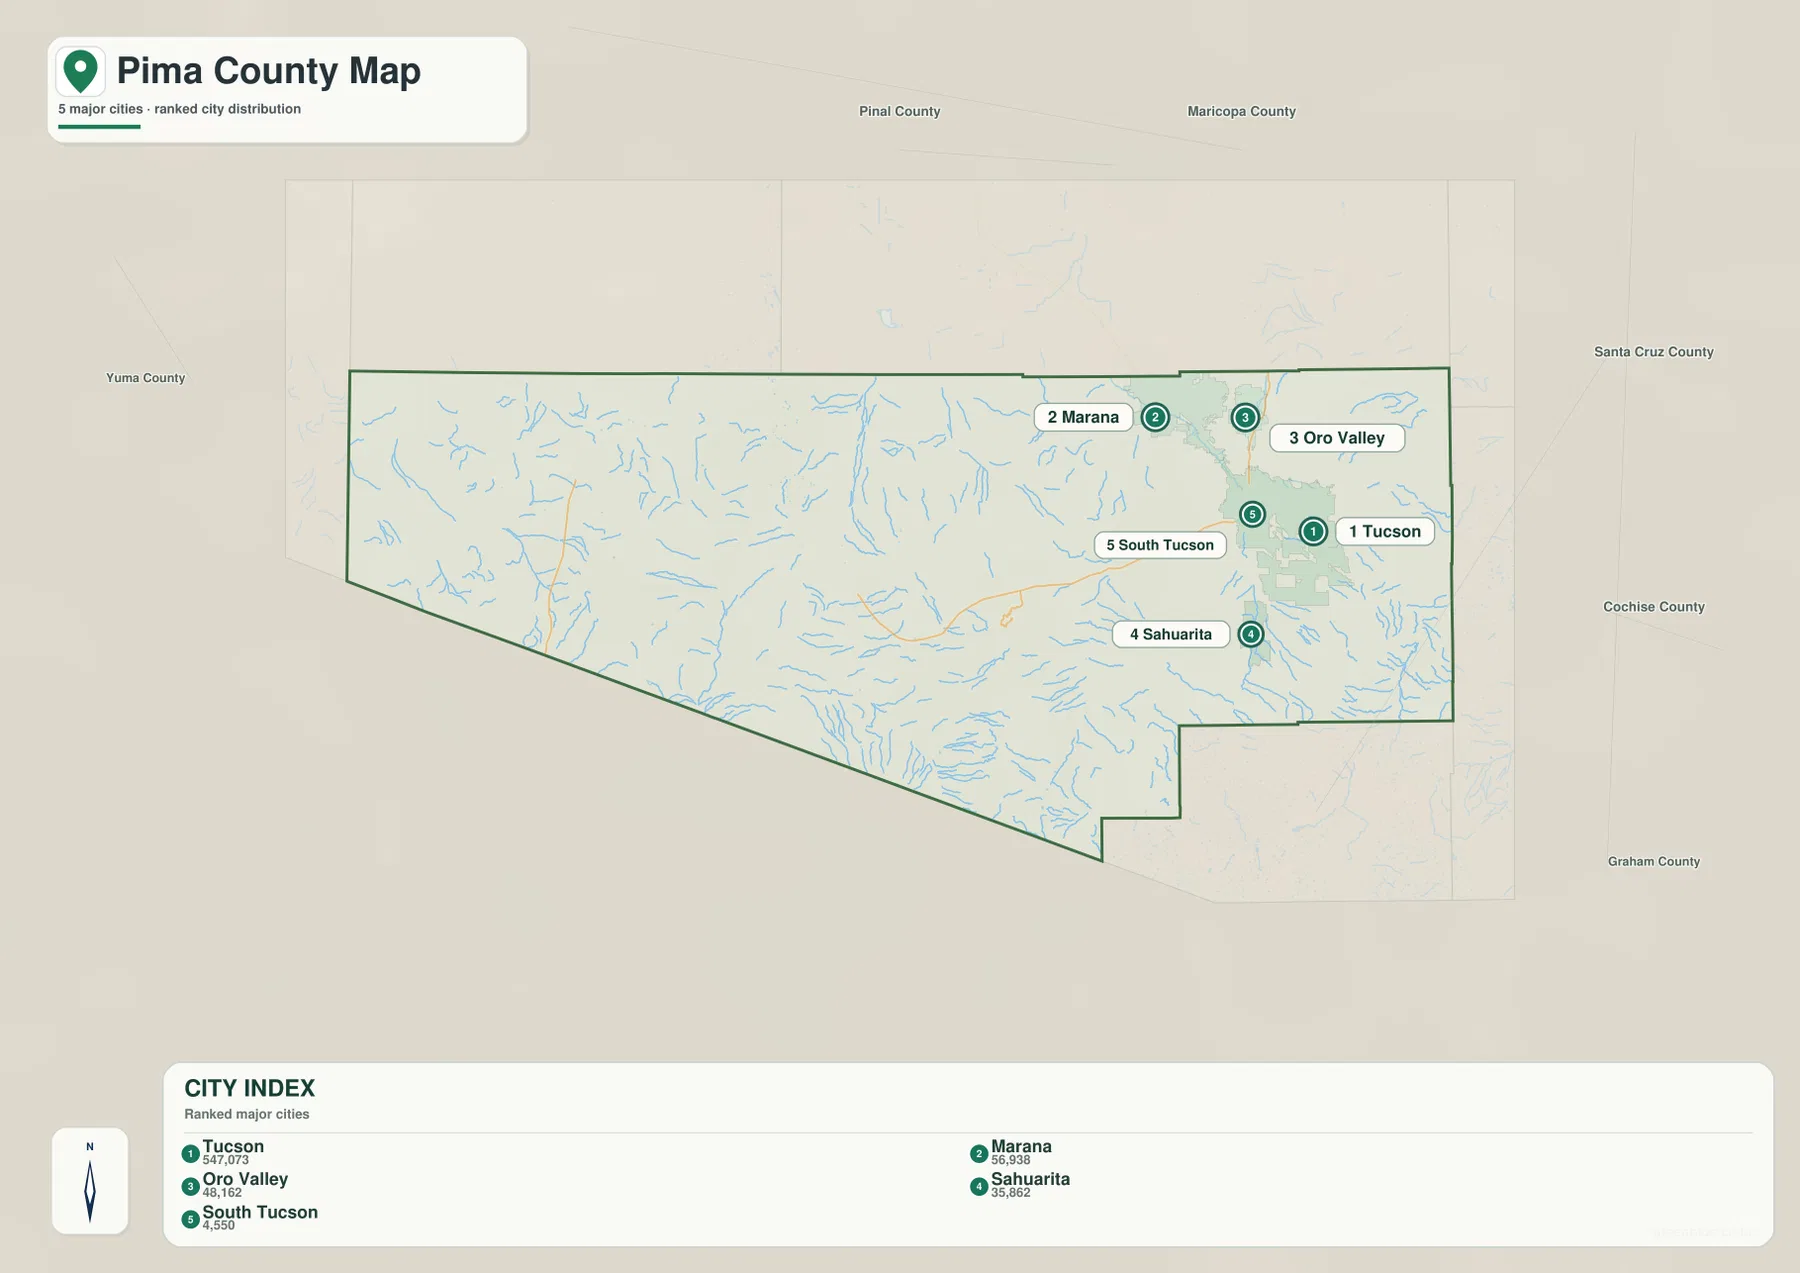
This cleaner view works well when a presentation or worksheet needs only the relative position of the main mapped cities. It is less useful for explaining how those cities are connected because most road detail has been removed. Pairing it with the general county map solves that problem: the city view keeps the labels readable, while the road map provides I-10, I-19, Route 77, and the other routes that give those locations travel context.
Santa Cruz River and desert washes reveal a different side of the county
The terrain-and-water map removes much of the urban emphasis and makes drainage lines easier to follow. Santa Cruz River is the clearest named watercourse in the eastern portion, running through the broad Tucson-side valley. Cienega Creek appears farther southeast. In the central part of the county, Mendoza Wash, Fresnal Wash, and San Juan Wash are labeled among many thinner blue lines, showing how drainage spreads across terrain that may look nearly empty on the road map.
The western half contains additional named washes, including San Simon Wash, Gu Vo Wash, San Cristobal Wash, and Grover Wash. Arroyo Seco is labeled farther south-central. These features are especially important to read carefully in an arid landscape: a wash shown as a blue line should not automatically be interpreted as a continuously flowing stream. The map describes the location of drainage features and terrain, not the amount of water present on a particular day.
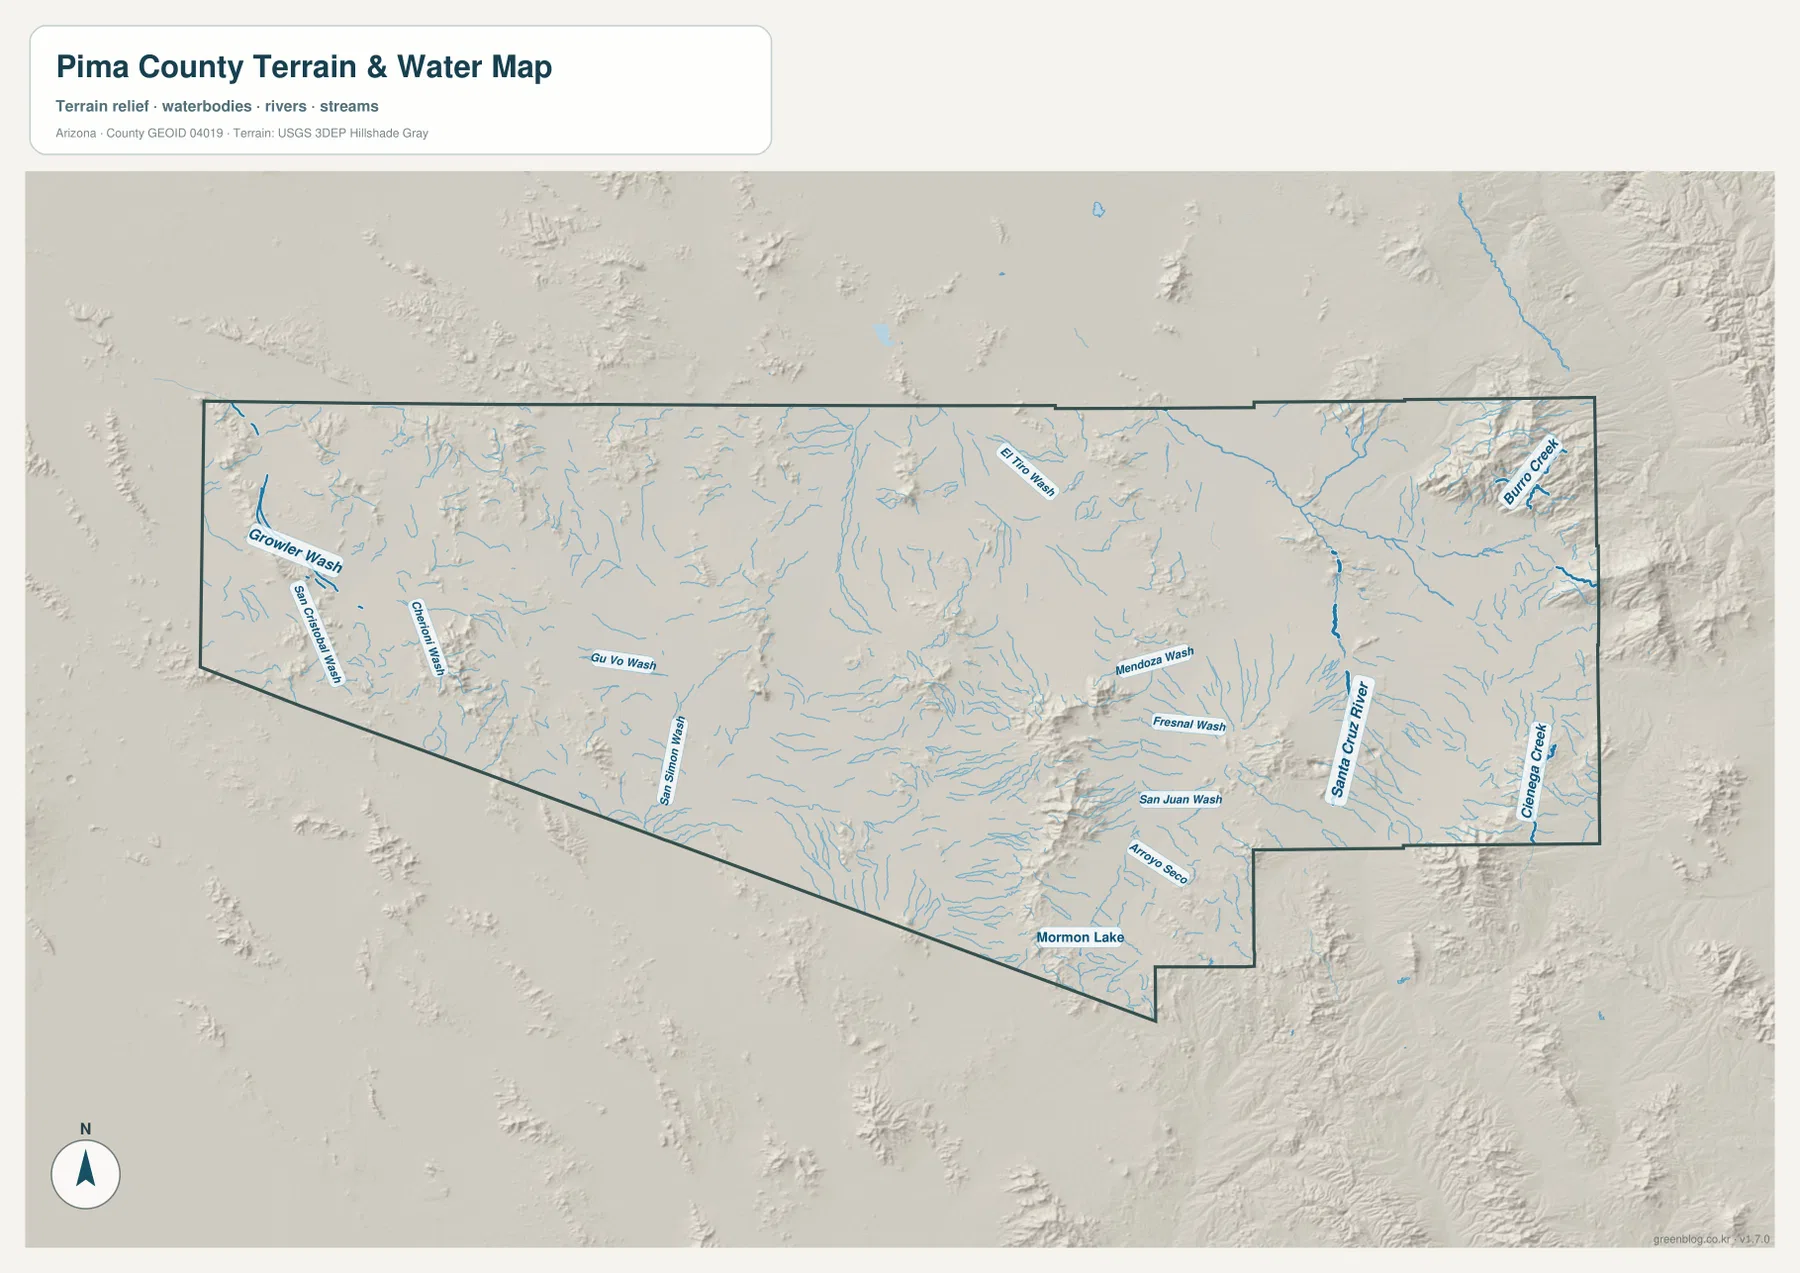
This map should not be used as a flood-hazard, water-depth, navigation, or legal-boundary product. The many blue lines are useful for understanding where named channels and washes lie, but they do not report current flow conditions or flood probability. Anyone making a safety, building, drainage, or land-development decision should use the current official products designed for that purpose, including relevant Pima County and federal data.
Elevation rises sharply from the western desert to the eastern mountains
The supplied elevation map reports an actual range of about 202 to 2,773 meters and a mean elevation of 807 meters. Green represents lower terrain, with yellow, tan, and brown marking progressively higher ground. Much of the western half is green, indicating a broad low-elevation desert area. The central part remains relatively low overall but contains isolated ridges and mountain blocks that rise above the surrounding floor.
The strongest elevation contrast appears on the eastern side. High brown terrain rises abruptly east and northeast of the Tucson basin, and additional high ground appears in the southeast. A separate mountain mass stands out in the south-central area, surrounded by lower terrain. The map therefore makes the county’s large vertical range much easier to understand than a road map alone: Pima County includes both low desert areas and mountain terrain that reaches well above 2,000 meters.
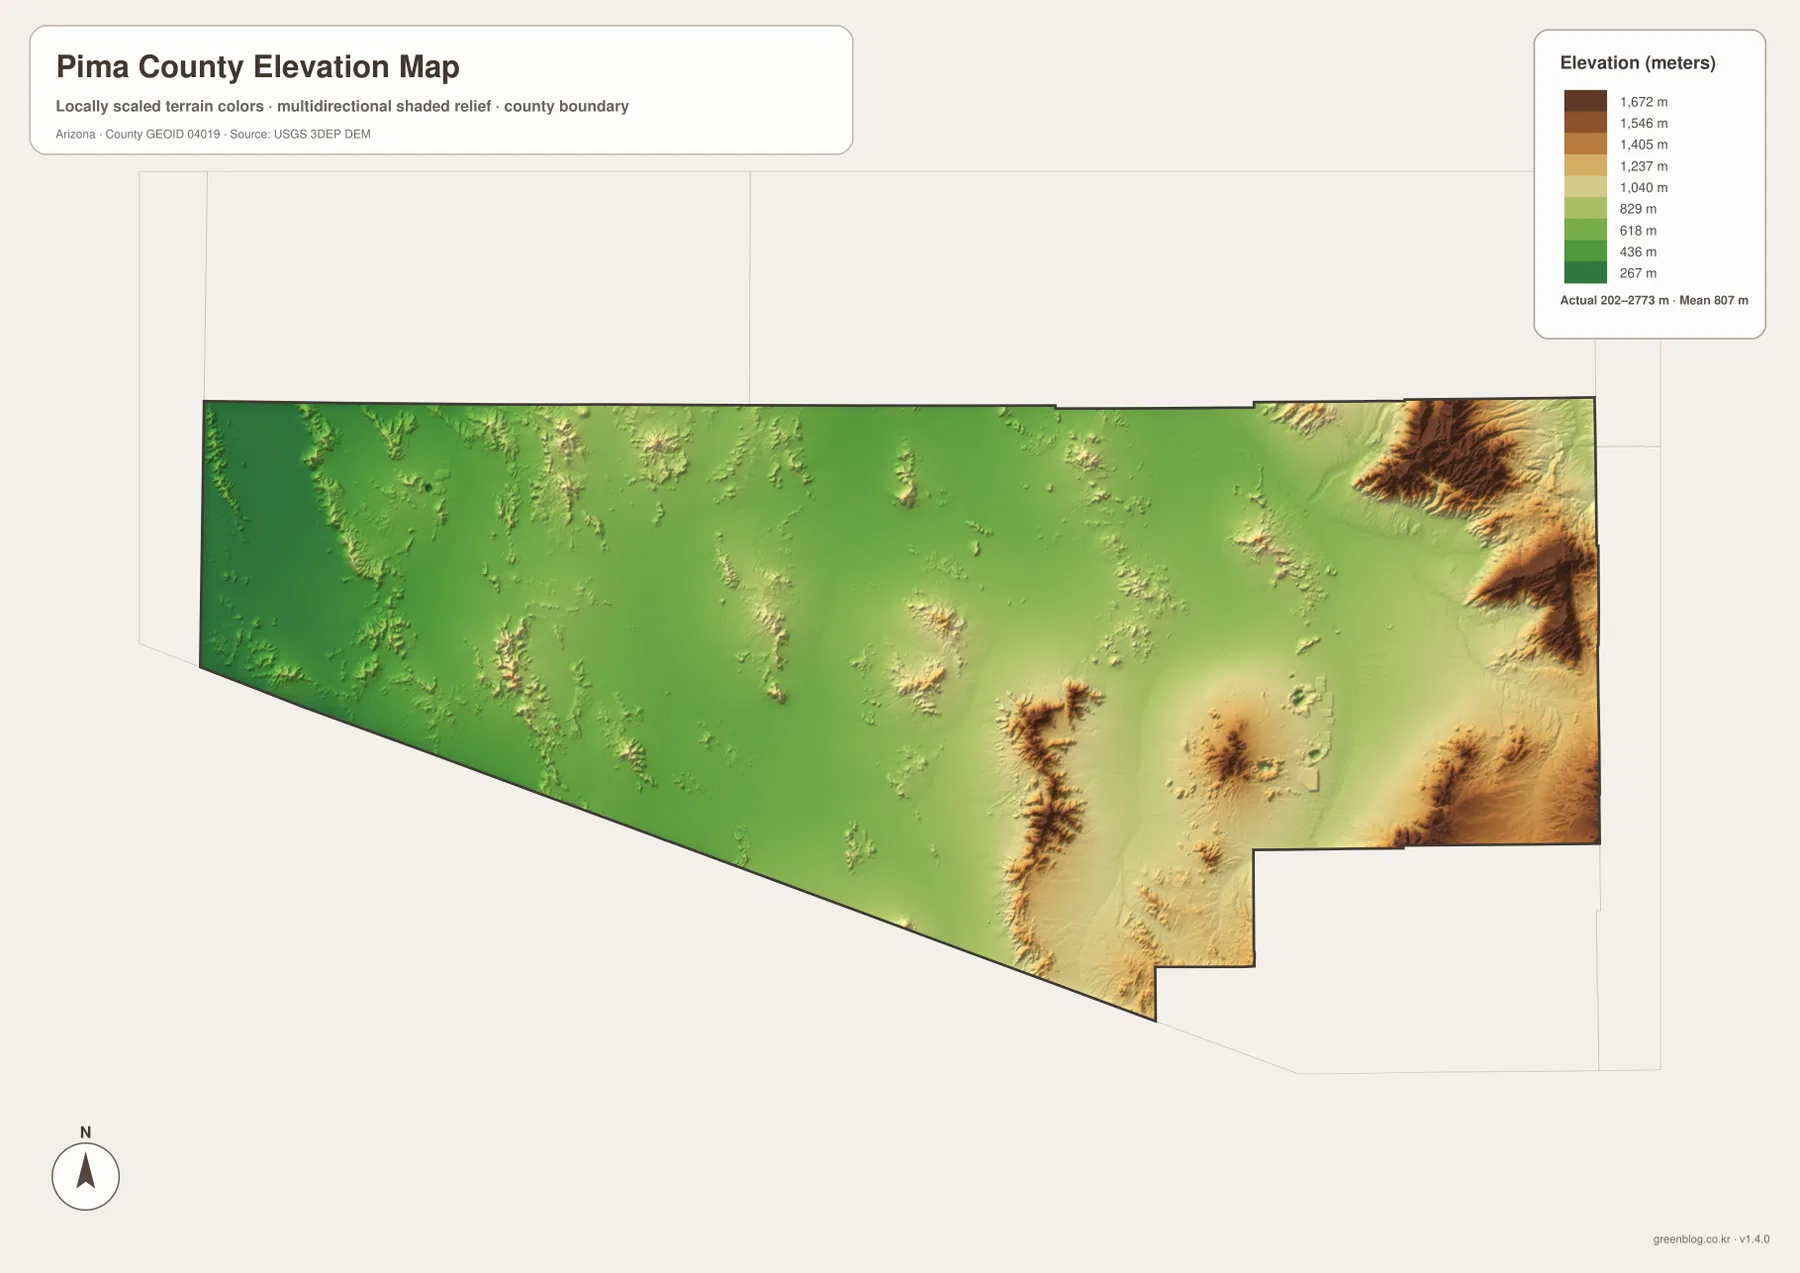
The elevation colors are intended for countywide comparison rather than survey-grade measurement. Elevation still varies within each color band, and small ridges or gullies can be generalized at this scale. The image is useful for explaining where the broad lowlands and high mountain blocks occur. Construction, engineering, precise drainage analysis, or parcel-level elevation work should use original USGS elevation data or an appropriate professional survey.
Use each map for the question it answers best
The general county map is the most useful starting point when you need roads, community names, and the full boundary in one view. The ranked city map is cleaner when Tucson, Marana, Oro Valley, Sahuarita, and South Tucson are the main subject. The terrain-and-water map is better for Santa Cruz River and the county’s many washes, while the elevation view shows the broad contrast between low western desert and high eastern terrain. Separating these topics keeps the labels readable and makes it easier to choose only the information needed for a project.
The WebP images above are optimized for quick viewing on the page. For printing, presentations, or a closer look at labels, download the original high-resolution JPG files from the ZIP below. The archive contains four separate files matching the county, city, terrain-and-water, and elevation views. If you crop or resize a map for a handout, keeping the county boundary, legend, and north arrow visible will help other readers understand what area and scale they are seeing.
What the maps do not show
The general map is a county-scale reference, so it does not contain every local street, building, or parcel line. Values printed in the ranked city index belong to the supplied map and should not automatically be treated as the newest population estimates. The water map does not measure flood risk or current streamflow, and the elevation surface does not replace detailed topographic or survey data. Address research, property ownership, legal boundaries, construction, and hazard planning all require current authoritative sources for those specific tasks.
The official Pima County website provides current county government and service information and is a useful companion when a map question turns into an administrative one. U.S. Census Bureau TIGER/Line data provide authoritative geographic boundary resources, while USGS maintains national hydrography and elevation programs. The purpose of this page is narrower: to help a visitor understand the supplied Pima County maps quickly and obtain the matching map files without confusing a reference map with a specialized legal, engineering, or hazard product.
Frequently Asked Questions
Which Pima County map is best for finding Tucson and the major highways?
Use the general county map. It shows Tucson together with I-10, I-19, Route 77, Route 86, and other numbered roads, plus nearby places such as Marana, Oro Valley, Sahuarita, and Ajo. The ranked city map is simpler but removes much of the road detail.
Do the blue wash lines mean water is always flowing there?
No. The terrain-and-water map is a geographic reference showing named drainage features. In an arid area, a wash can be dry for long periods, so a blue line should not be read as a statement of current flow, depth, or flood risk. Use current official hydrologic and flood information for safety decisions.
Can the 202–2,773 meter elevation range be used for an exact site elevation?
No. The displayed range is appropriate for comparing broad high and low areas across the county. A specific parcel, structure, road, or construction site requires original elevation data or survey-grade measurements appropriate to that location.
Map File Information
Download the high-resolution Pima County JPG files in one ZIP. The county, city, terrain-and-water, and elevation maps are stored as separate files.
- Included Files: county map, city map, terrain-and-water map, elevation map
- File Type: ZIP containing 4 high-resolution JPG files
Related Maps
Sources and reference data
- Official Pima County website – county government and service information.
- U.S. Census Bureau TIGER/Line Shapefiles – county boundaries and geographic data.
- USGS National Hydrography – river, stream, and hydrographic reference data.
- USGS 3D Elevation Program – elevation data and 3DEP program information.
Green Map creates custom-edited map images using open geographic data sources such as geoBoundaries, Natural Earth, OpenStreetMap, and government open data.
These maps are edited visual materials, not raw data files, and are provided for education, documents, presentations, and graphic reference.