You can download high-resolution JPG map files for Brule County, South Dakota, from this page after reviewing the map views below. The county is easiest to recognize by the Missouri River along its western edge and by Chamberlain, which sits beside the river near the county courthouse. I-90 runs east from Chamberlain toward Pukwana and Kimball, while smaller places such as Ola and Bijou Hills appear farther south. The maps also show Red Lake, named creeks, and an elevation range of 413 to 643 meters, so the page can be used for more than simply locating towns.
A practical way to use the page is to start with the place you need rather than trying to read every layer at once. Chamberlain works well as a starting point because the river, county edge, and interstate are all easy to see nearby. If your question is about water, Red Lake and the named creeks stand out much more clearly in the terrain-and-water view. For relief, the elevation image shows a strong contrast between the low Missouri River edge and higher ground farther south.
Table of Contents
Start with Chamberlain on the Missouri River
The general county map places Chamberlain immediately inside the curved western boundary, with the Brule County Courthouse labeled close by. Oacoma appears across the river, making the river crossing and the county’s western position easy to understand. The boundary bends repeatedly with the Missouri River instead of following the straighter lines seen on much of the eastern and southern sides. Once Chamberlain is located, the rest of the map becomes easier to orient.
I-90 crosses the river at Chamberlain and then continues east through the northern part of the county. Pukwana sits along the same broad east-west route, and Kimball is farther east. The map also includes route markers such as 50, 45, and 3, but it should not be treated as a live navigation product. Its strength is showing where communities and major roads sit in relation to the county outline.
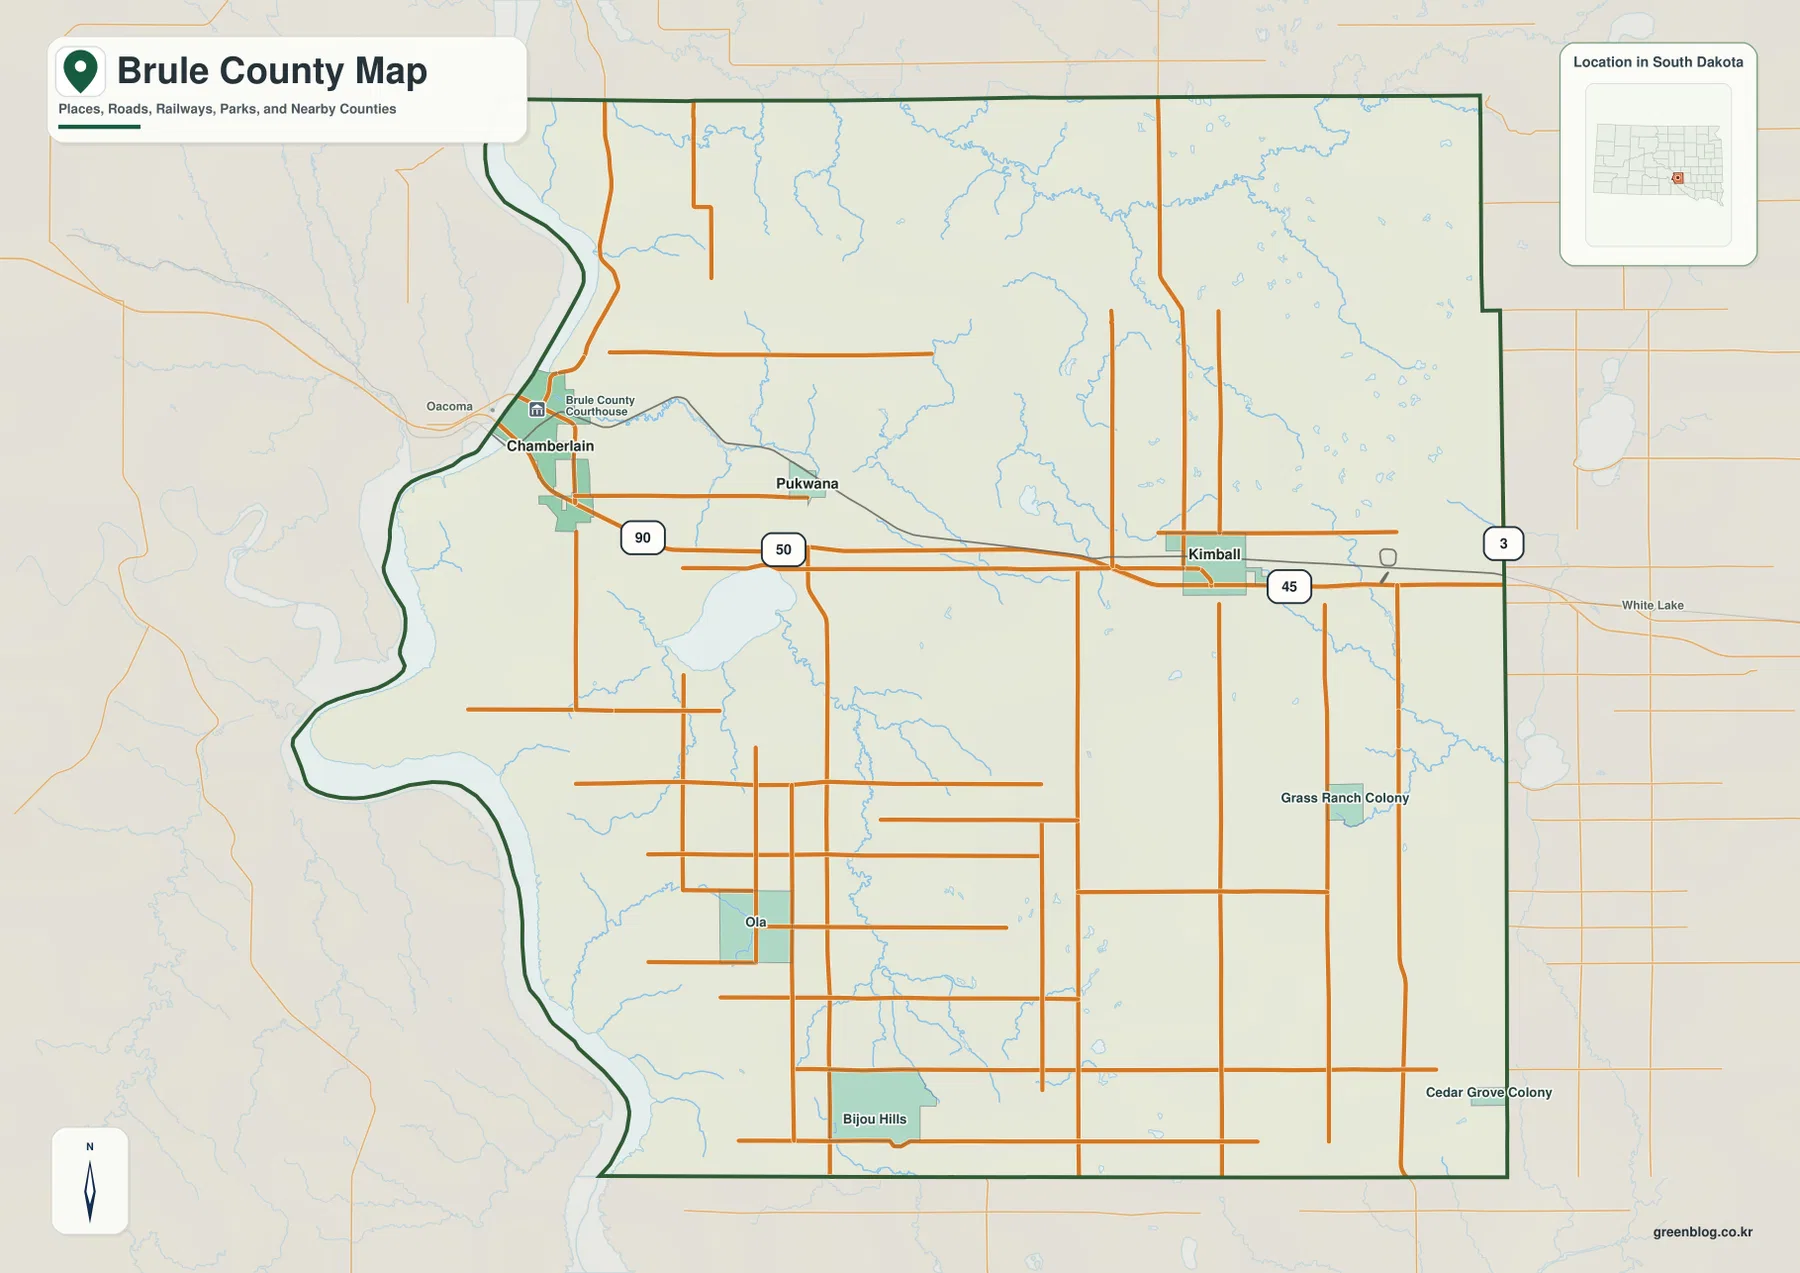
South of the interstate corridor, the pattern becomes much more rural. Ola and Bijou Hills are separated from the three northern communities, and Grass Ranch Colony and Cedar Grove Colony appear in the southeastern part of the county. These labels matter because a quick glance at the I-90 corridor alone can make Brule County look more concentrated than it really is. The full county map is therefore the best first choice when you need settlements, roads, and the outer boundary in one image.
I-90 organizes the north, but the county extends well beyond it
Chamberlain, Pukwana, and Kimball form an easy sequence from west to east. Chamberlain is beside the river, Pukwana lies between the other two, and Kimball is closer to the eastern side of the county. That order is useful for quickly checking a location in the northern half of Brule County. It does not, however, tell you how long a drive will take or how busy a road is, so current travel planning still requires an up-to-date road or navigation service.
Farther south, roads are more widely spaced and the labeled places are smaller. Ola and Bijou Hills help anchor the southwest and southern interior, while the two colonies provide reference points farther east. This north-south contrast is one of the clearest features of the general map: the interstate corridor provides a simple line of reference in the north, but much of the county lies away from that route.
What the Chamberlain hub diagram actually measures
The city-connections view simplifies the county so that the spacing among Chamberlain, Pukwana, and Kimball is easier to compare. Chamberlain is the hub. Pukwana is labeled about 7 miles away and Kimball about 19 miles away. Those figures are straight-line distances, not driving distances, so a road trip between the same places will not necessarily match the numbers printed on the image.
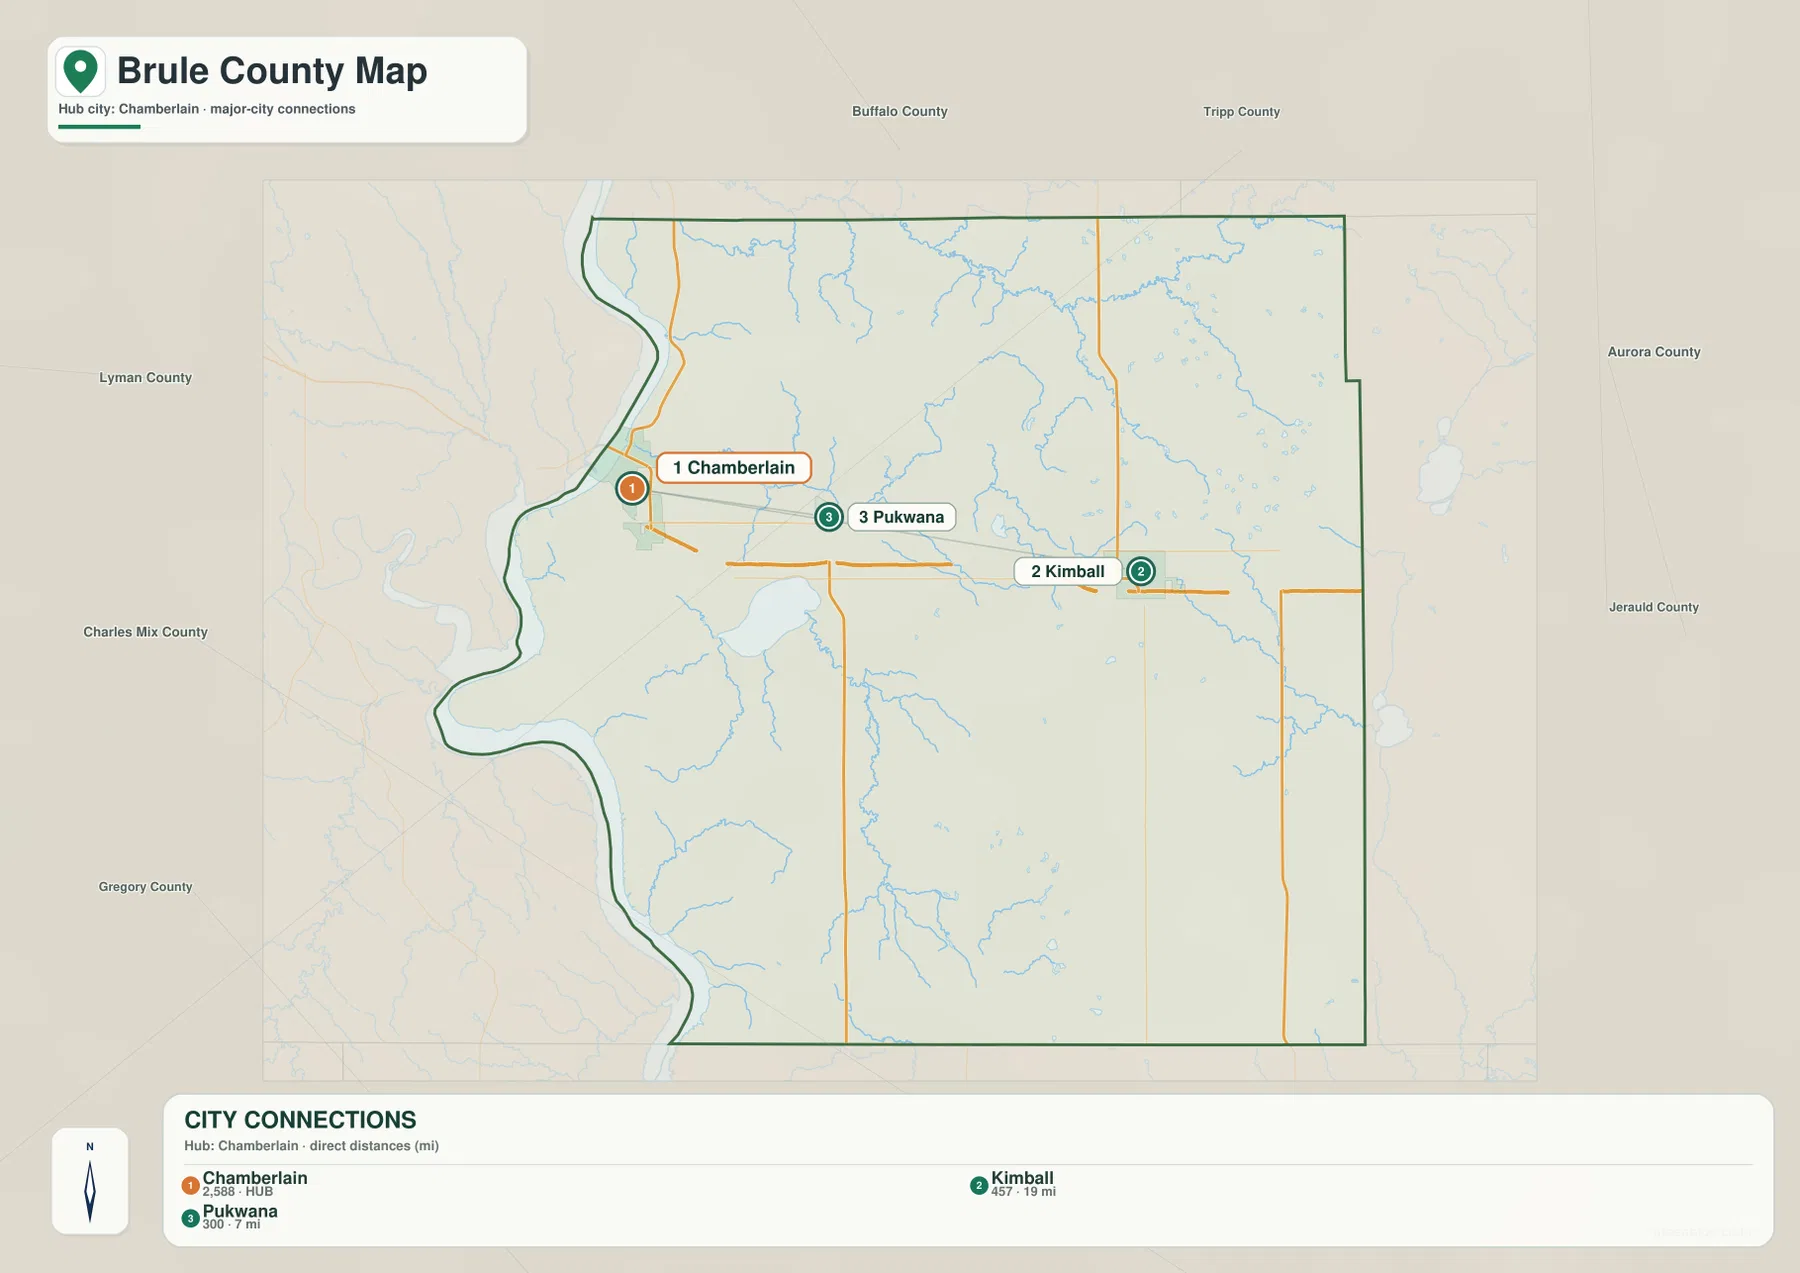
The simplified diagram also helps show that Pukwana sits between Chamberlain and Kimball. Around the outside of the county, labels identify neighboring counties including Lyman, Buffalo, Tripp, Aurora, Jerauld, Charles Mix, and Gregory. That surrounding context is useful when you are trying to understand which side of Brule County a community lies on. For turn-by-turn travel or an exact jurisdictional boundary, use current official road and boundary sources instead.
Red Lake and named creeks fill in the area away from the river
The terrain-and-water view makes the Missouri River the dominant feature along the west side. Moving inland, Red Lake is one of the most noticeable named water bodies in the west-central part of the county. Smith Creek runs across the north, while Reimer Creek and Nelson Creek are labeled near the Red Lake area. Elm Creek appears farther south, and American Creek is labeled closer to the Missouri River south of Chamberlain.
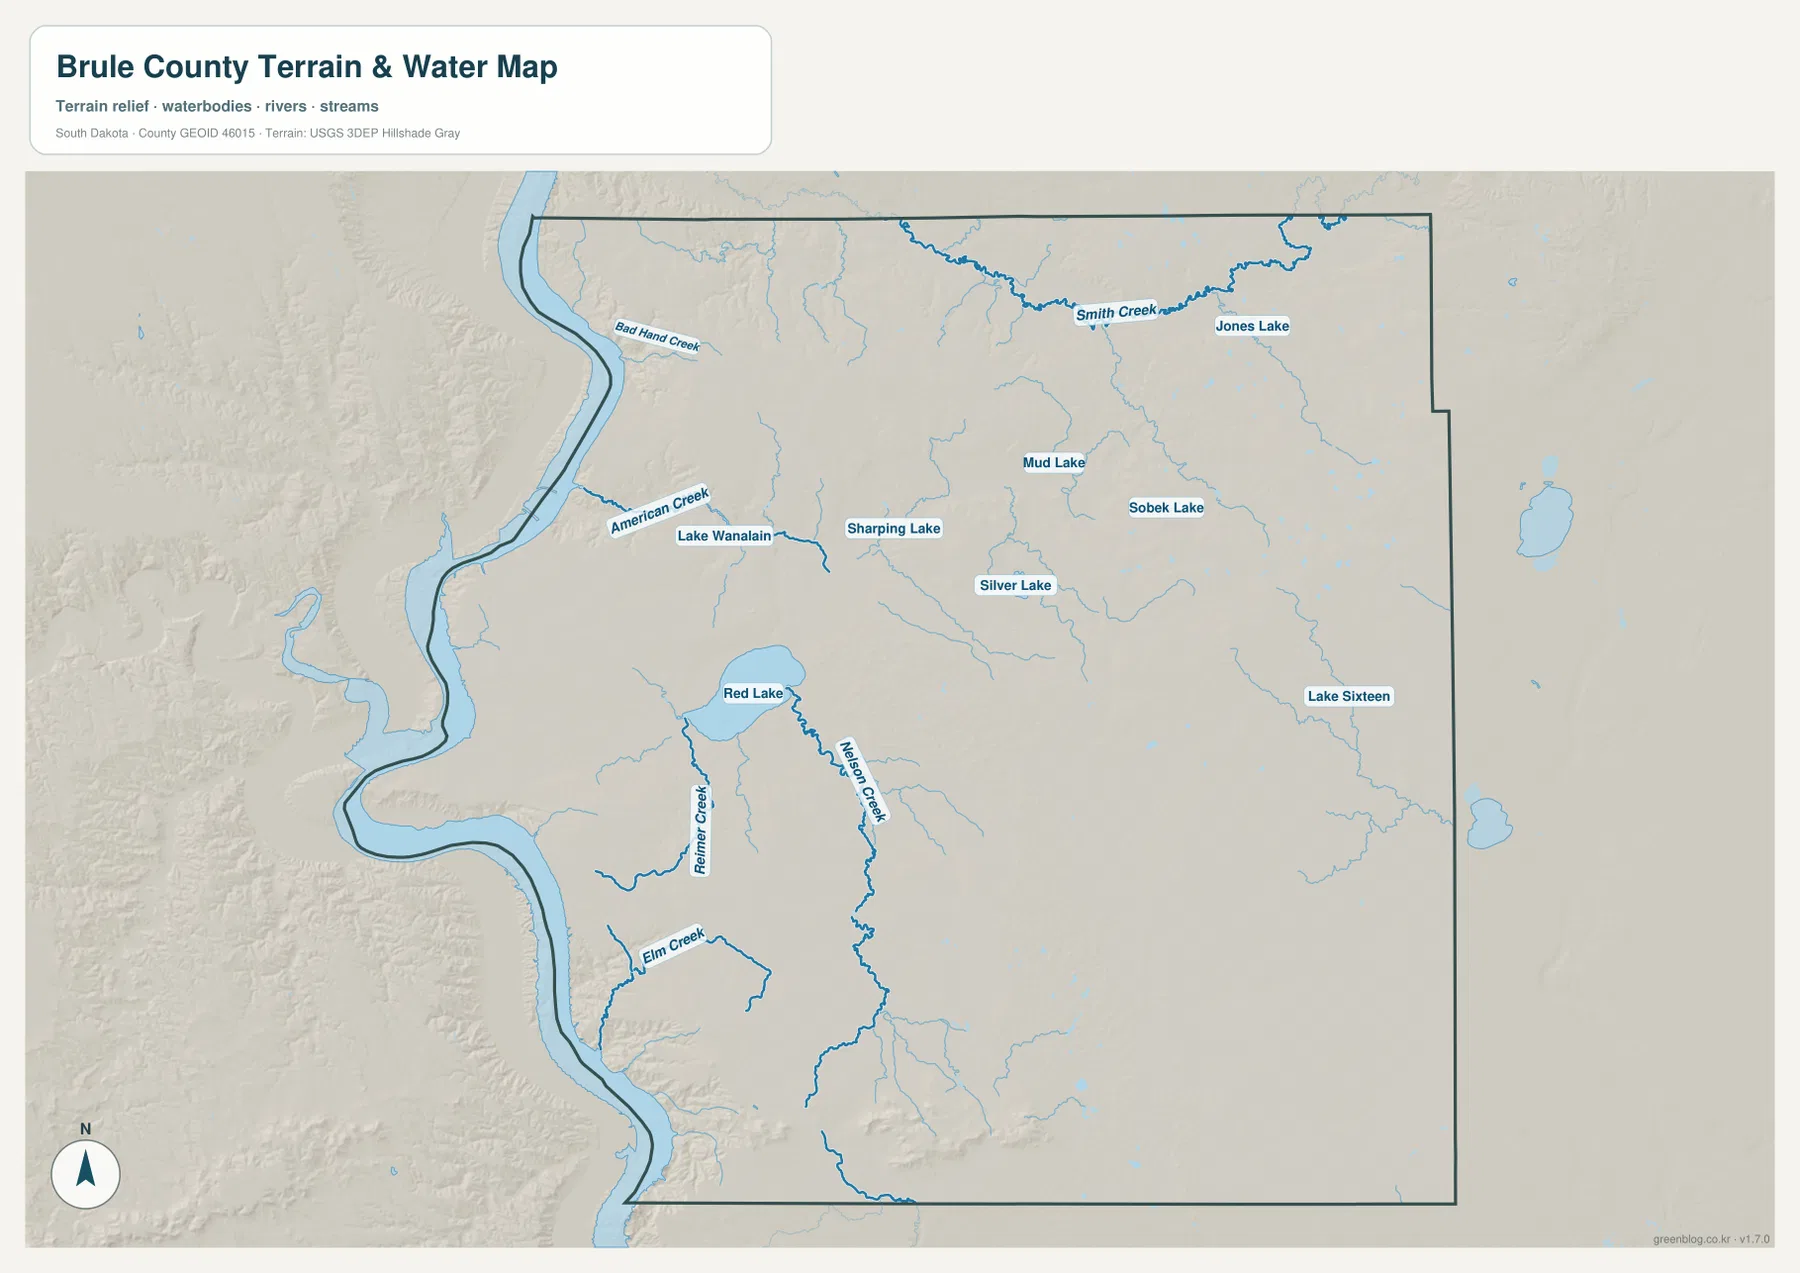
Several smaller lakes are labeled as well, including Jones Lake, Mud Lake, Sobek Lake, Silver Lake, and Lake Sixteen. These names are much easier to pick out here than on the road-focused county map. The image is useful for identifying water features and comparing their positions, but it is not a flood-risk map, a current water-level report, or a navigation chart. Anyone who needs current streamflow, water quality, or safety conditions should consult the appropriate official source.
The map should also be read as a reference to named features rather than a complete explanation of how water behaves throughout the year. A creek that is drawn on the map may vary greatly by season, and the image does not show discharge or flow direction in enough detail for field decisions. Its value is in answering a simpler question: where are the river, lakes, and named creeks in relation to the county boundary and the places shown on the other maps?
Elevation rises sharply away from parts of the Missouri River edge
The elevation view reports an actual county range of 413 to 643 meters and a mean of 507 meters. Green shades dominate much of the narrow western edge beside the Missouri River, indicating lower ground there. Higher brown shades become more common inland, with especially strong high areas in the south and additional higher ground toward the northeast. This makes the difference between the river corridor and the county interior easy to see without needing a list of spot elevations.
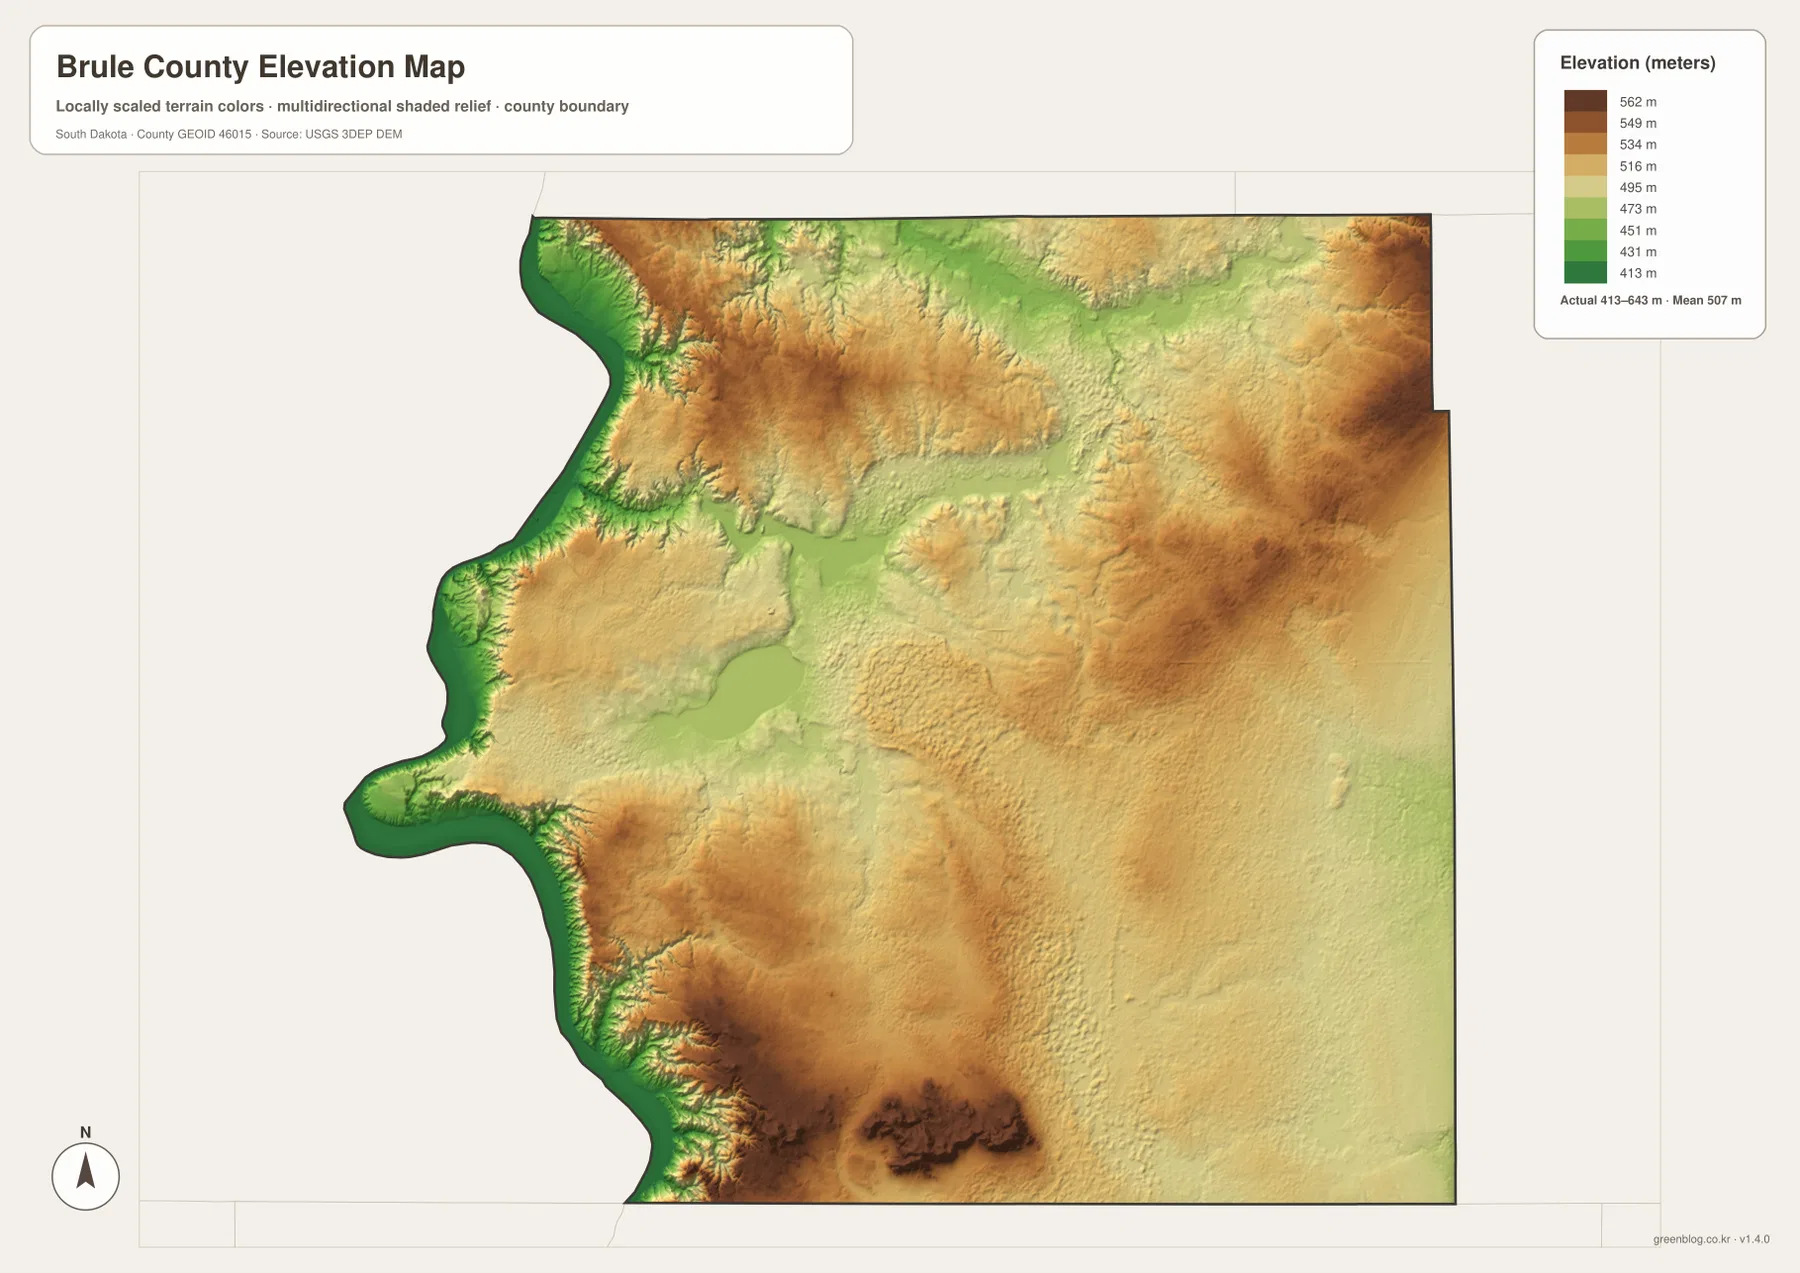
The elevation image is intended for county-scale comparison. It can show that Chamberlain lies close to lower river terrain and that parts of southern Brule County rise much higher, but it should not be used as the exact elevation of a parcel, building, or road point. For surveying, construction, or a location-specific elevation value, a more detailed USGS 3DEP source or professional survey is the appropriate choice.
Using the elevation image with the other maps makes individual places easier to remember. Chamberlain can be tied to the low river edge, while Ola and Bijou Hills can be located farther south where higher colors appear more often. Red Lake sits within a different band of relief than the strongest southern high ground. Comparing one named place at a time keeps the map reading straightforward and avoids treating the entire county as if it had the same terrain.
Choose the view that matches the question you are asking
For a quick look at communities and roads, begin with the general county map. Use the city-connections view when the main question is how far Pukwana and Kimball are from the Chamberlain hub in straight-line terms. The terrain-and-water image is the clearest choice for the Missouri River, Red Lake, and named creeks. The elevation image is better when the question is why the river edge and the southern interior look different in height.
This approach also works well for classroom handouts, local-reference notes, and printed reports. Find the place first, then add the water or elevation view only if it helps explain that location. The WebP images on the page are optimized for viewing online, while the ZIP below contains larger JPG versions for printing or document use. For legal boundaries, parcel work, engineering, live road conditions, or current water conditions, use the latest authoritative data rather than these reference maps alone.
The download contains four high-resolution JPG files matching the map views used in the article. Each original JPG is 3638 × 2572 pixels, which provides more room for printing, presentations, and close viewing than the page previews.
Frequently Asked Questions
Are the 7 miles to Pukwana and 19 miles to Kimball driving distances?
No. The city-connections image identifies Chamberlain as the hub and labels the figures as direct distances, so they should be read as straight-line distances. Driving mileage can be longer because actual travel follows the road network.
Which image is best for the Missouri River, Red Lake, and named creeks?
Use the terrain-and-water view. It shows the Missouri River along the western boundary and labels Red Lake, Smith Creek, Nelson Creek, Reimer Creek, Elm Creek, American Creek, and several smaller lakes. It does not show current flood risk, streamflow, or water quality.
Can the 413–643 meter range be used as the exact elevation of a property?
No. That range describes the county-wide elevation surface shown in the map. It is useful for comparing lower and higher parts of Brule County, but a parcel-specific or engineering elevation requires a more detailed source such as USGS 3DEP data or a professional survey.
Map File Information
The Brule County general, city-connections, terrain-and-water, and elevation views are packaged as high-resolution JPG files.
- Included Files: Use only the versions confirmed in the article and supplied images
- File Type: Use the confirmed download contents
- Intended Use: Printing, education, presentations, and map-based projects
Related Maps
Sources and References
The article is based first on the names, roads, water features, and elevation values visible in the supplied Brule County maps. The following official sources provide additional county, hydrography, elevation, and historical context.
- Brule County official website
- U.S. Census Bureau QuickFacts – Brule County
- South Dakota State Historical Society – Brule and Lyman Counties survey report
- USGS National Hydrography
- USGS 3D Elevation Program
Green Map creates custom-edited map images using open geographic data sources such as geoBoundaries, Natural Earth, OpenStreetMap, and government open data.
These maps are edited visual materials, not raw data files, and are provided for education, documents, presentations, and graphic reference.