You can download the Robertson County Tennessee Map files on this page as one ZIP containing high-resolution JPG versions of the county, city, water, and elevation maps. Springfield is the main interior reference, while White House, Greenbrier, Coopertown, Ridgetop, and Cross Plains show how the county’s population centers spread toward different edges. The water and relief sheets add Red River tributaries, small lakes, and a clear rise from lower western valleys toward the rolling southeast. The files are prepared for A3 printing, presentations, classroom work, and general county reference.
Robertson County lies along Tennessee’s northern border with Kentucky. That state-line setting matters because the county does not radiate evenly from Springfield. The western and northern sides are shaped by the Red River drainage, the eastern side has a strong north-south highway corridor near White House and Cross Plains, and the southern edge contains several separate towns that connect toward the Nashville area.
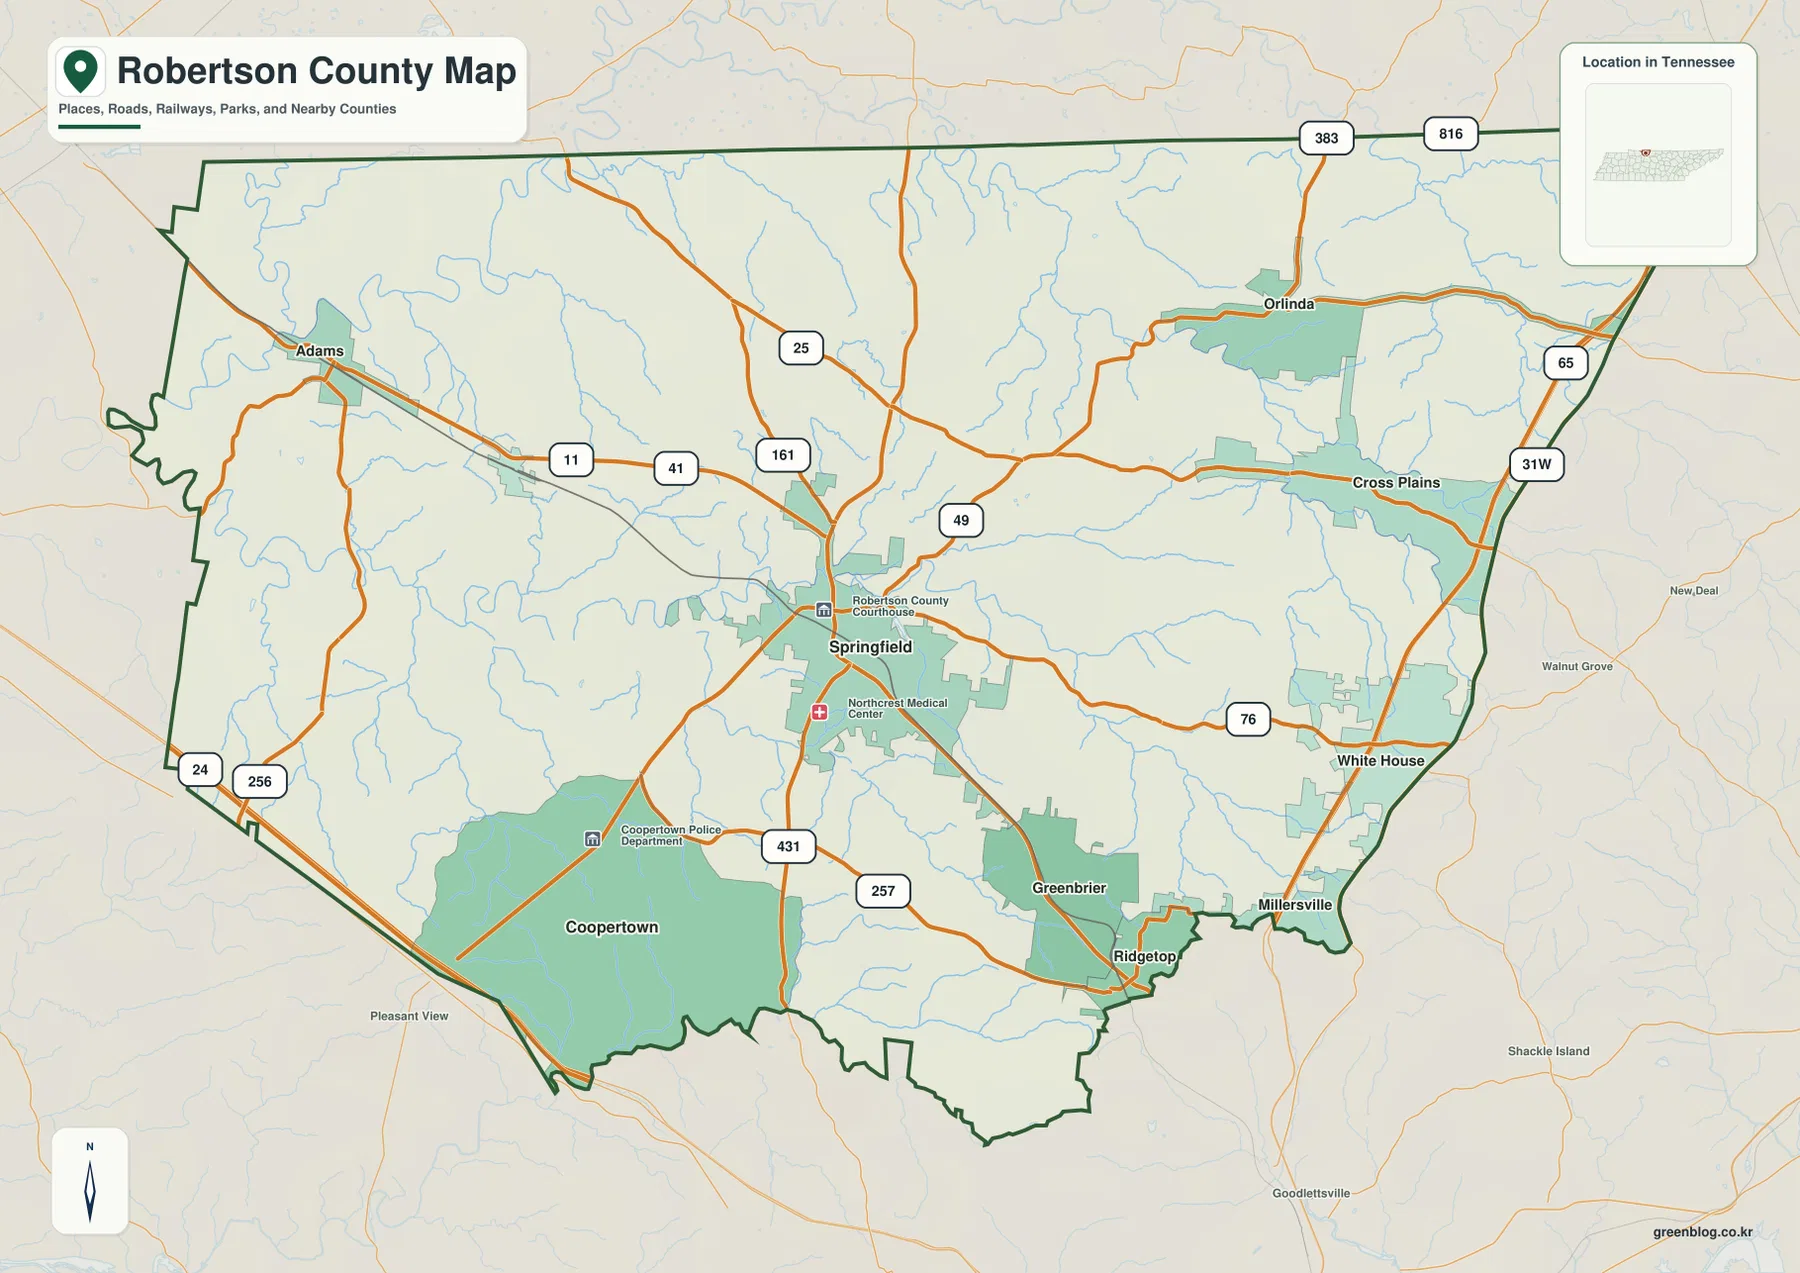
Table of Contents
Springfield connects the interior while the strongest highway corridor stays east
Springfield sits slightly west of the county’s middle and is the easiest starting point for road orientation. SR 49 crosses the Springfield area in an east-west direction, SR 76 leads toward White House, and US 431 continues south. US 41 and SR 11 provide references toward Adams and the northwestern side, while SR 25 and SR 161 help locate the northern part of the county close to the Kentucky line.
The eastern edge works differently. I-65 and US 31W run close to White House and Cross Plains, creating a strong north-south route that does not pass through Springfield itself. That separation is important on a county map: Springfield is the administrative center, but some of the most direct regional highway access is farther east. SR 76 links the two areas and makes White House a useful bridge between the internal road network and the eastern corridor.
South of Springfield, Greenbrier, Ridgetop, and Coopertown occupy different parts of the county rather than one continuous line of development. Greenbrier is in the southeast near the US 41 corridor, Ridgetop sits close to the southeastern boundary, and Coopertown spreads across the southwest near US 431 and SR 257. Their placement makes the southern edge look more like several connected local centers than one single suburb.
Six ranked cities show a split between the interior and the county edges
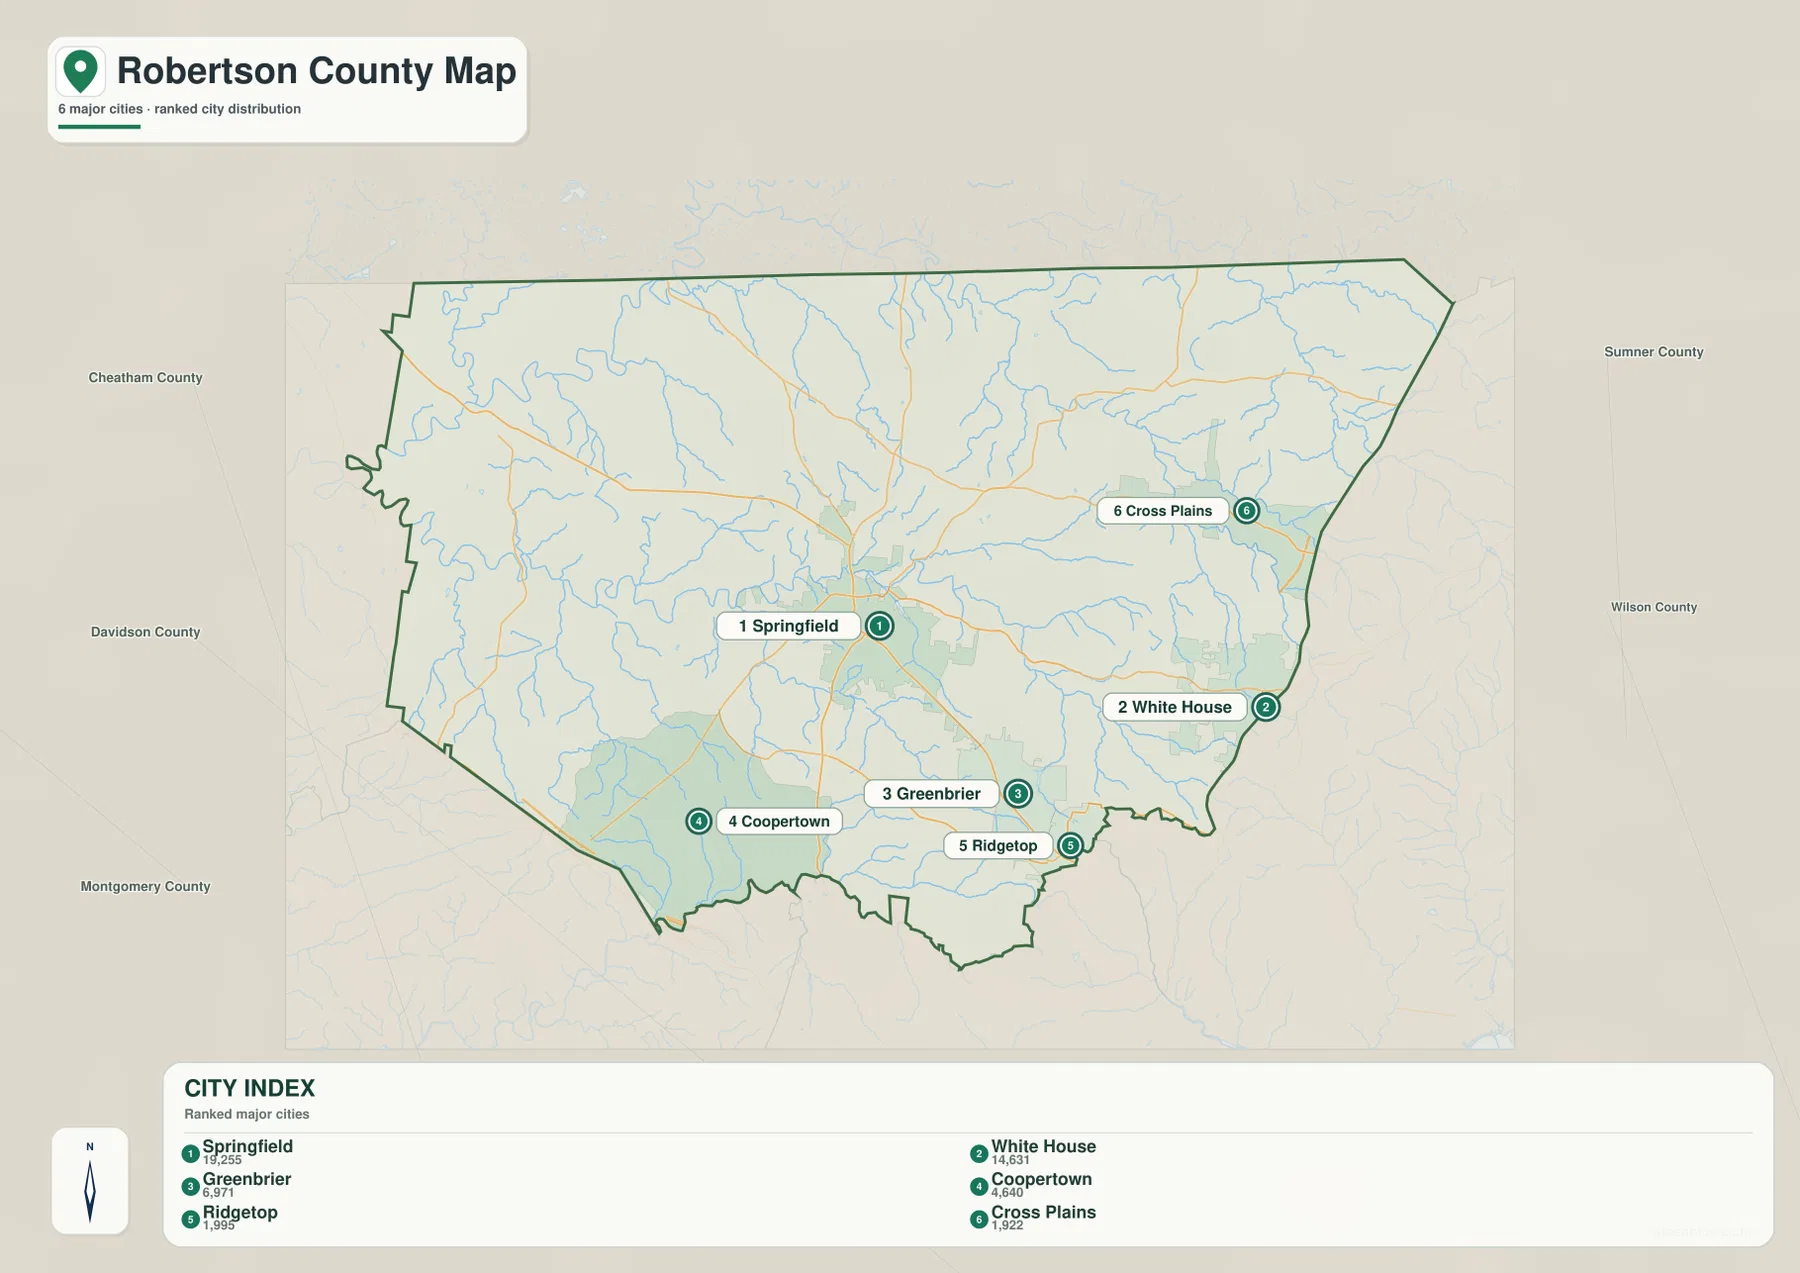
The city sheet ranks six major cities. Springfield is first at 19,255, followed by White House at 14,631, Greenbrier at 6,971, Coopertown at 4,640, Ridgetop at 1,995, and Cross Plains at 1,922. These are the values printed on the supplied city map and are best used for comparing the mapped cities with one another rather than replacing countywide Census totals.
The most useful contrast is between Springfield and White House. Springfield is well inside the county and functions as the county seat. White House is close to the eastern boundary and the I-65 corridor. Greenbrier, Ridgetop, and Coopertown form additional references along the southern half, while Cross Plains is farther north on the east side. The pattern makes clear that Robertson County has more than one population and travel direction.
The outer county context also matters. Kentucky counties such as Logan, Simpson, and Todd touch the northern or northwestern side, while Sumner, Davidson, Cheatham, and Montgomery counties surround different Tennessee sides. Communities and roads near those edges should be read with the county outline visible, especially around White House and Ridgetop where a familiar city name may extend beyond a single county boundary.
Red River, Sulphur Fork, and spring-fed creeks shape the western half
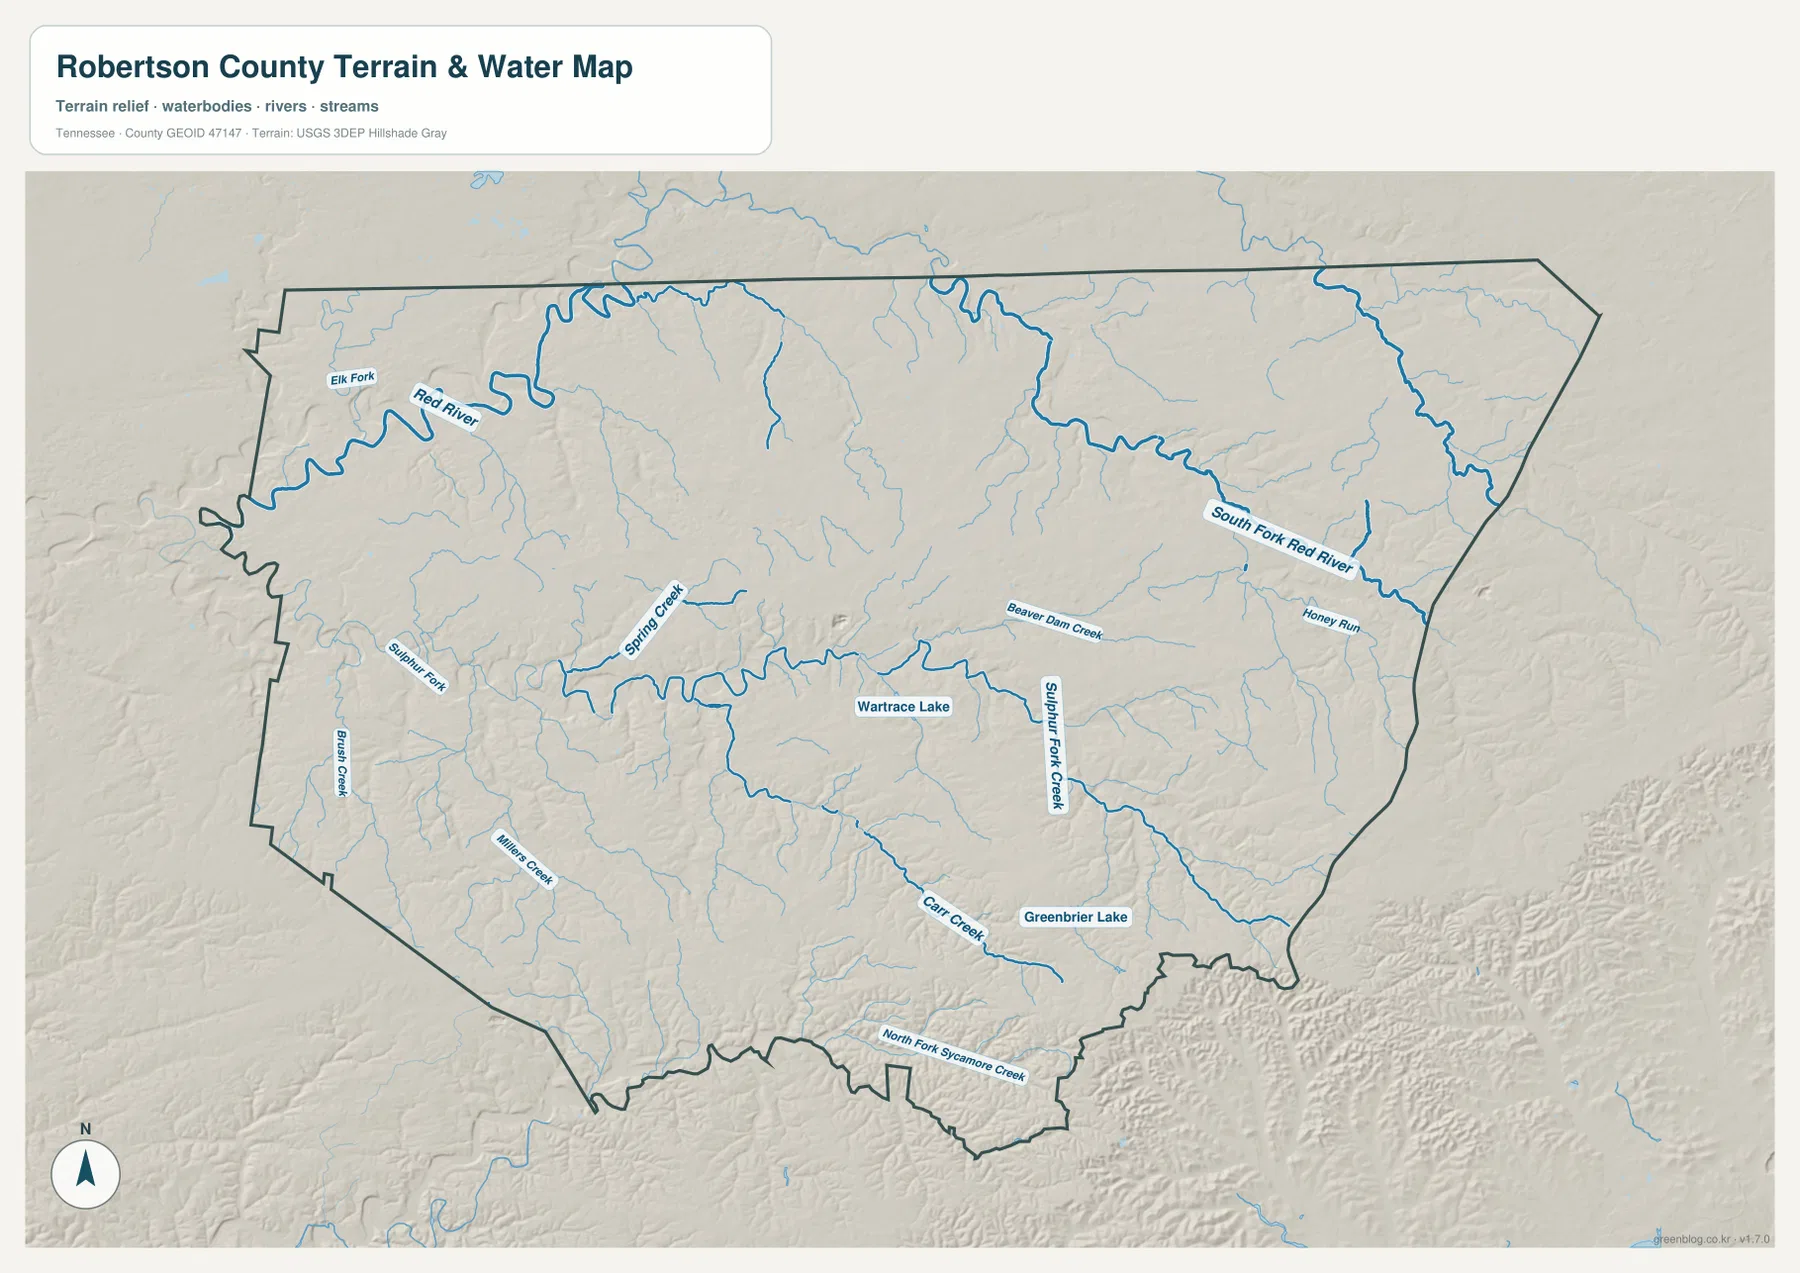
Red River is the easiest water feature to follow in the northwest. It bends through lower terrain close to the county edge, with Elk Fork joining the same broad drainage area. Farther south, Sulphur Fork crosses the western side, and Spring Creek reaches through the west-central part of the county. Their curves are much more pronounced than the simplified road grid, showing how water occupies the natural low ground between rolling ridges.
Wartrace Lake appears near the middle of the county and provides a compact water reference among the creek network. To the east, Sulphur Fork Creek runs through the central-eastern side, while Carr Creek and Greenbrier Lake help locate the southeastern drainage around Greenbrier. North Fork Sycamore Creek follows the southern edge and gives another useful reference where the terrain begins to rise more strongly.
The northeast has a separate prominent channel, South Fork Red River, with Honey Run nearby. Although it shares the Red River name, it appears on the opposite side of the county from the northwestern Red River reach. Comparing the water and elevation maps makes the connection clearer: streams occupy the green low corridors, while tan and brown ridges divide those corridors into separate drainage valleys.
Elevation climbs from about 99 meters to 282 meters toward the southeast
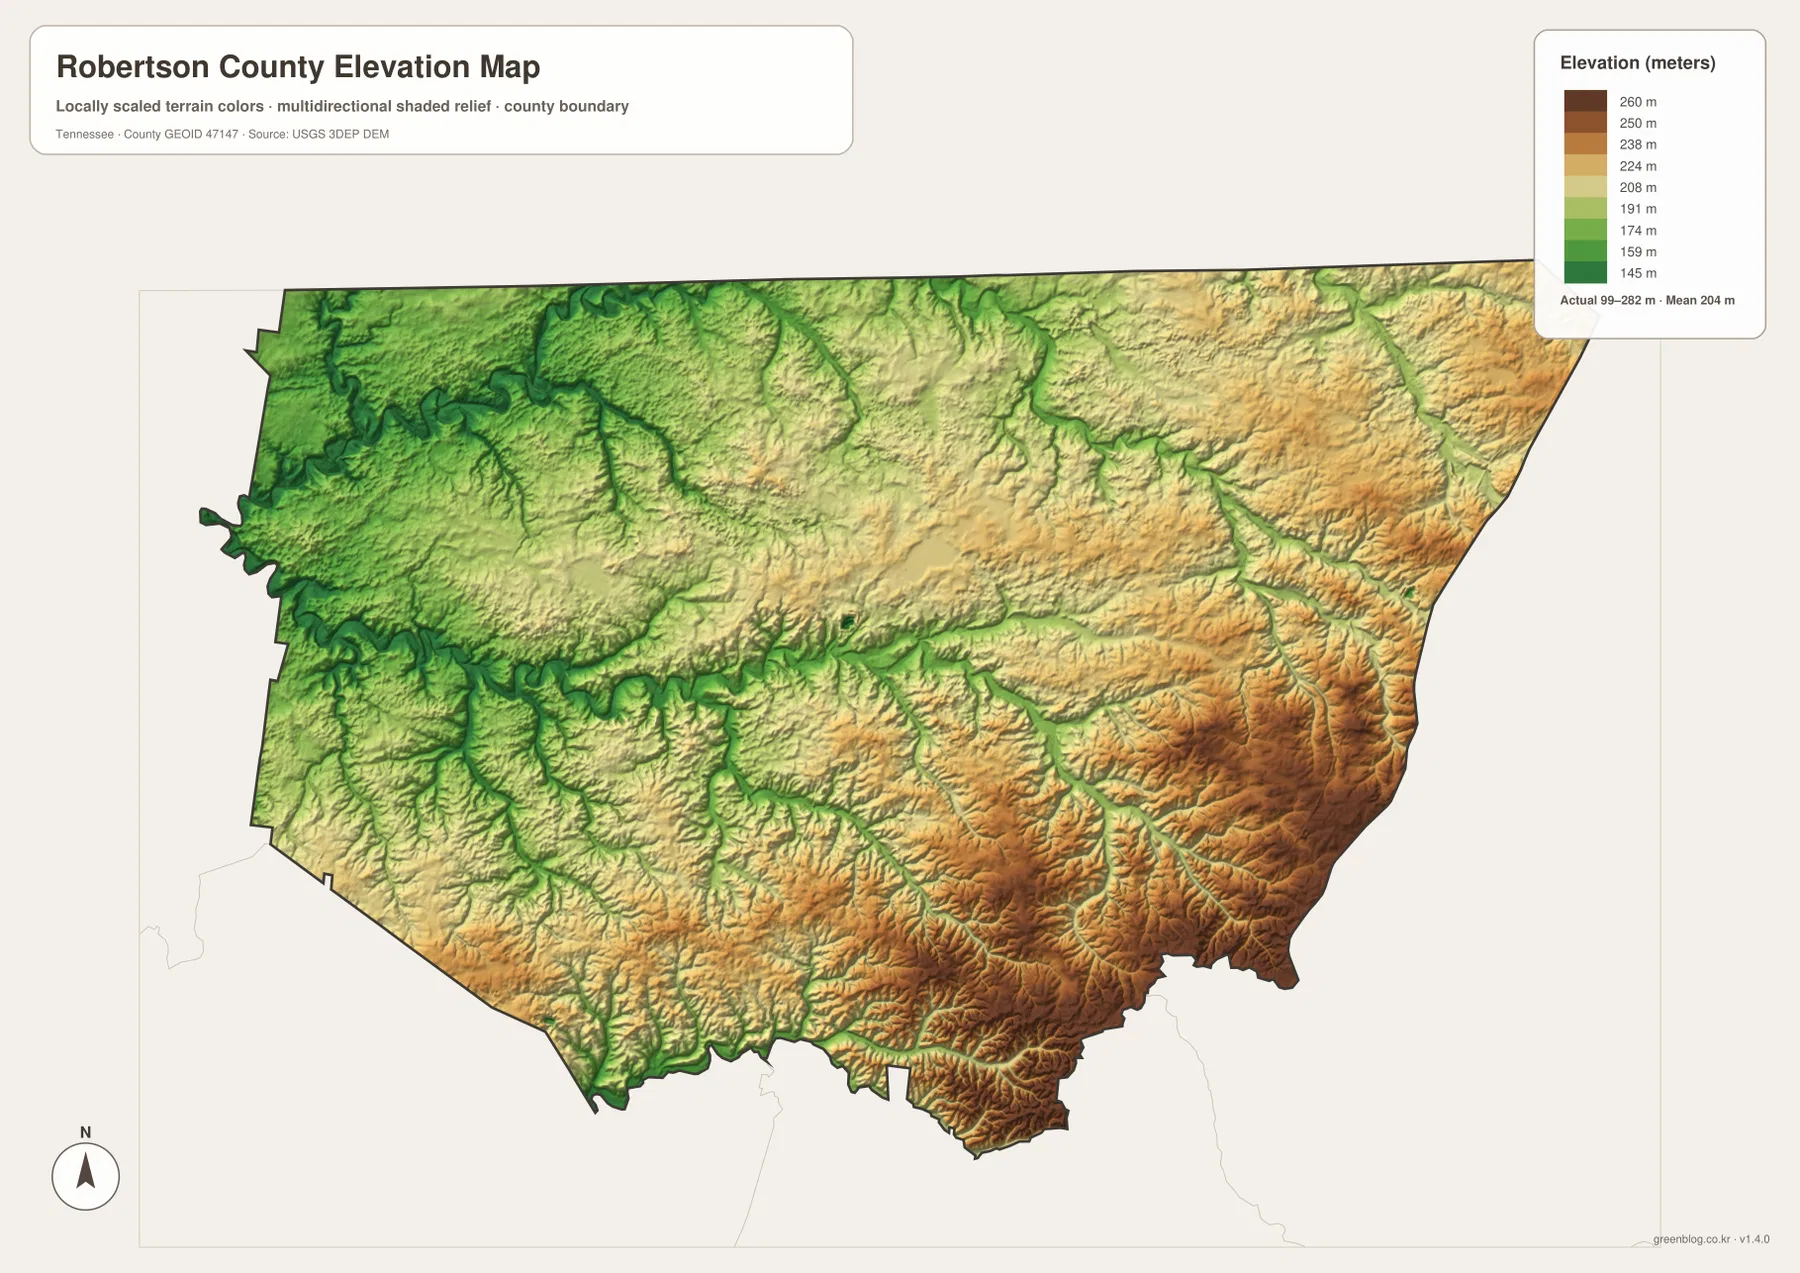
The supplied elevation map shows an actual range of about 99 to 282 meters, with a mean near 204 meters. The west and northwest contain large areas of darker green, marking the county’s lower ground. Moving toward the center brings more light green and yellow rolling terrain, while the strongest brown relief is concentrated in the southeast.
The Red River and its western tributaries cut distinct low corridors through the surrounding hills. Similar green valleys appear around South Fork Red River in the northeast, but the ground between channels is higher. The relief is not a high-mountain landscape; it is a closely spaced pattern of ridges and creek valleys that becomes more pronounced toward Greenbrier and Ridgetop.
Springfield sits in middle-elevation terrain compared with the lowest northwest and the highest southeast. This helps explain why road direction and stream direction do not always match a simple rectangular grid. The elevation sheet is designed for county-scale comparison of hills and valleys, not for determining survey elevation or exact slope at a property.
County facts that help place the maps in context
- Official name: Robertson County, Tennessee
- County seat: Springfield
- FIPS code: 47147
- Established: 1796
- 2020 Census population: 72,803
- July 2025 population estimate: 80,175
- 2025 Gazetteer area: 476.3 square miles of land and 0.2 square miles of water
- Elevation shown on this map: about 99–282 m, mean about 204 m
The 72,803 figure is the completed 2020 Census count, while 80,175 is a July 2025 estimate. They should not be treated as the same type of measurement. The estimate indicates the scale of more recent population change, but it does not show where within the county that change occurred. Likewise, the 476.3-square-mile land figure covers Springfield, edge cities, rural areas, and creek valleys together.
Tennessee State Library and Archives material identifies Robertson County as established in 1796 and Springfield as the county seat. That administrative history fits the modern reference map, where Springfield remains the strongest interior place-name and road anchor. At the same time, the city sheet shows substantial population centers closer to the eastern and southern edges, so county government and present-day travel patterns should not be reduced to one location.
Pick the map by the feature you need to locate
The county reference map is the best starting point for Springfield, White House, Greenbrier, Coopertown, roads, and the county line on one page. It is especially useful for distinguishing the I-65 and US 31W corridor in the east from the US 431 and SR 49 routes closer to Springfield. The city sheet removes much of the road detail and makes the six ranked city locations easier to compare.
For Red River, Sulphur Fork, Spring Creek, South Fork Red River, or the small lakes, the water map is much clearer. The elevation sheet then explains why those waterways twist through green low corridors and why the southeast contains tighter ridges. Using those two maps together is more informative than trying to infer terrain only from the general road map.
The downloadable ZIP includes high-resolution JPG versions of all four maps and can be printed at A3 size while preserving the original proportions. Keep an untouched original if you plan to add route lines, arrows, or notes to a working copy. These are static reference maps, so current road closures, flood warnings, legal parcel boundaries, and construction conditions should be checked with the responsible agency.
Frequently Asked Questions
How do Springfield and White House differ on the Robertson County map?
Springfield is the county seat and sits well inside the county where several state routes meet. White House is near the eastern boundary and the I-65 and US 31W corridor. Comparing the two shows the difference between the county’s administrative center and one of its strongest edge-oriented highway locations.
Where is Red River in Robertson County?
Red River is most prominent in the northwest and western side, where it follows lower terrain near the county boundary. Sulphur Fork and Spring Creek occupy additional western and central valleys, while South Fork Red River is a separate major feature in the northeast.
Which part of Robertson County is highest on the elevation map?
The southeast contains the broadest area of higher brown terrain. The displayed county elevation ranges from about 99 to 282 meters, with a mean near 204 meters. The west and northwest, especially around Red River valleys, are generally lower.
Map File Information
The ZIP contains high-resolution JPG versions of the county, city, water, and elevation maps. They are suitable for A3 printing, presentations, classroom material, and general location reference.
- Included Files: county, city, water, and elevation JPGs
- File Type: JPG files in one ZIP
Related Maps
Sources and references
- Tennessee State Library and Archives — Robertson County fact sheet
- Tennessee Department of Transportation — Robertson County road reference
- U.S. Census Bureau QuickFacts — Robertson County, Tennessee
- U.S. Census Bureau TIGER/Line boundary data
- USGS National Hydrography
- USGS 3D Elevation Program
Green Map creates custom-edited map images using open geographic data sources such as geoBoundaries, Natural Earth, OpenStreetMap, and government open data. These maps are edited visual materials, not raw data files, and are provided for education, documents, presentations, and graphic reference.