You can download the high-resolution A3 JPG maps in a ZIP from this page, while the York County South Carolina Map previews below make it easy to compare the county before choosing a file. Rock Hill, Fort Mill, and Tega Cay form the most concentrated urban group on the eastern side, while York, Clover, Hickory Grove, Sharon, and McConnells spread across the center and west. The general map shows the roads that connect those places, the water map highlights Lake Wylie, the Catawba River, and named creeks, and the city map reduces the county to six ranked places.
The contrast is visible even before individual road numbers are read. Rock Hill and Fort Mill sit inside a busier web of roads and developed land, whereas York and the western communities are separated by larger stretches of open map. In the northeast, Lake Wylie creates an irregular water edge that bends around the Tega Cay and Clover side of the county. Farther south, the Catawba River continues past the Rock Hill area. Those features give York County a strong east-west difference that is useful for organizing the article.
Table of Contents
I-77 organizes the Rock Hill–Fort Mill side of the county
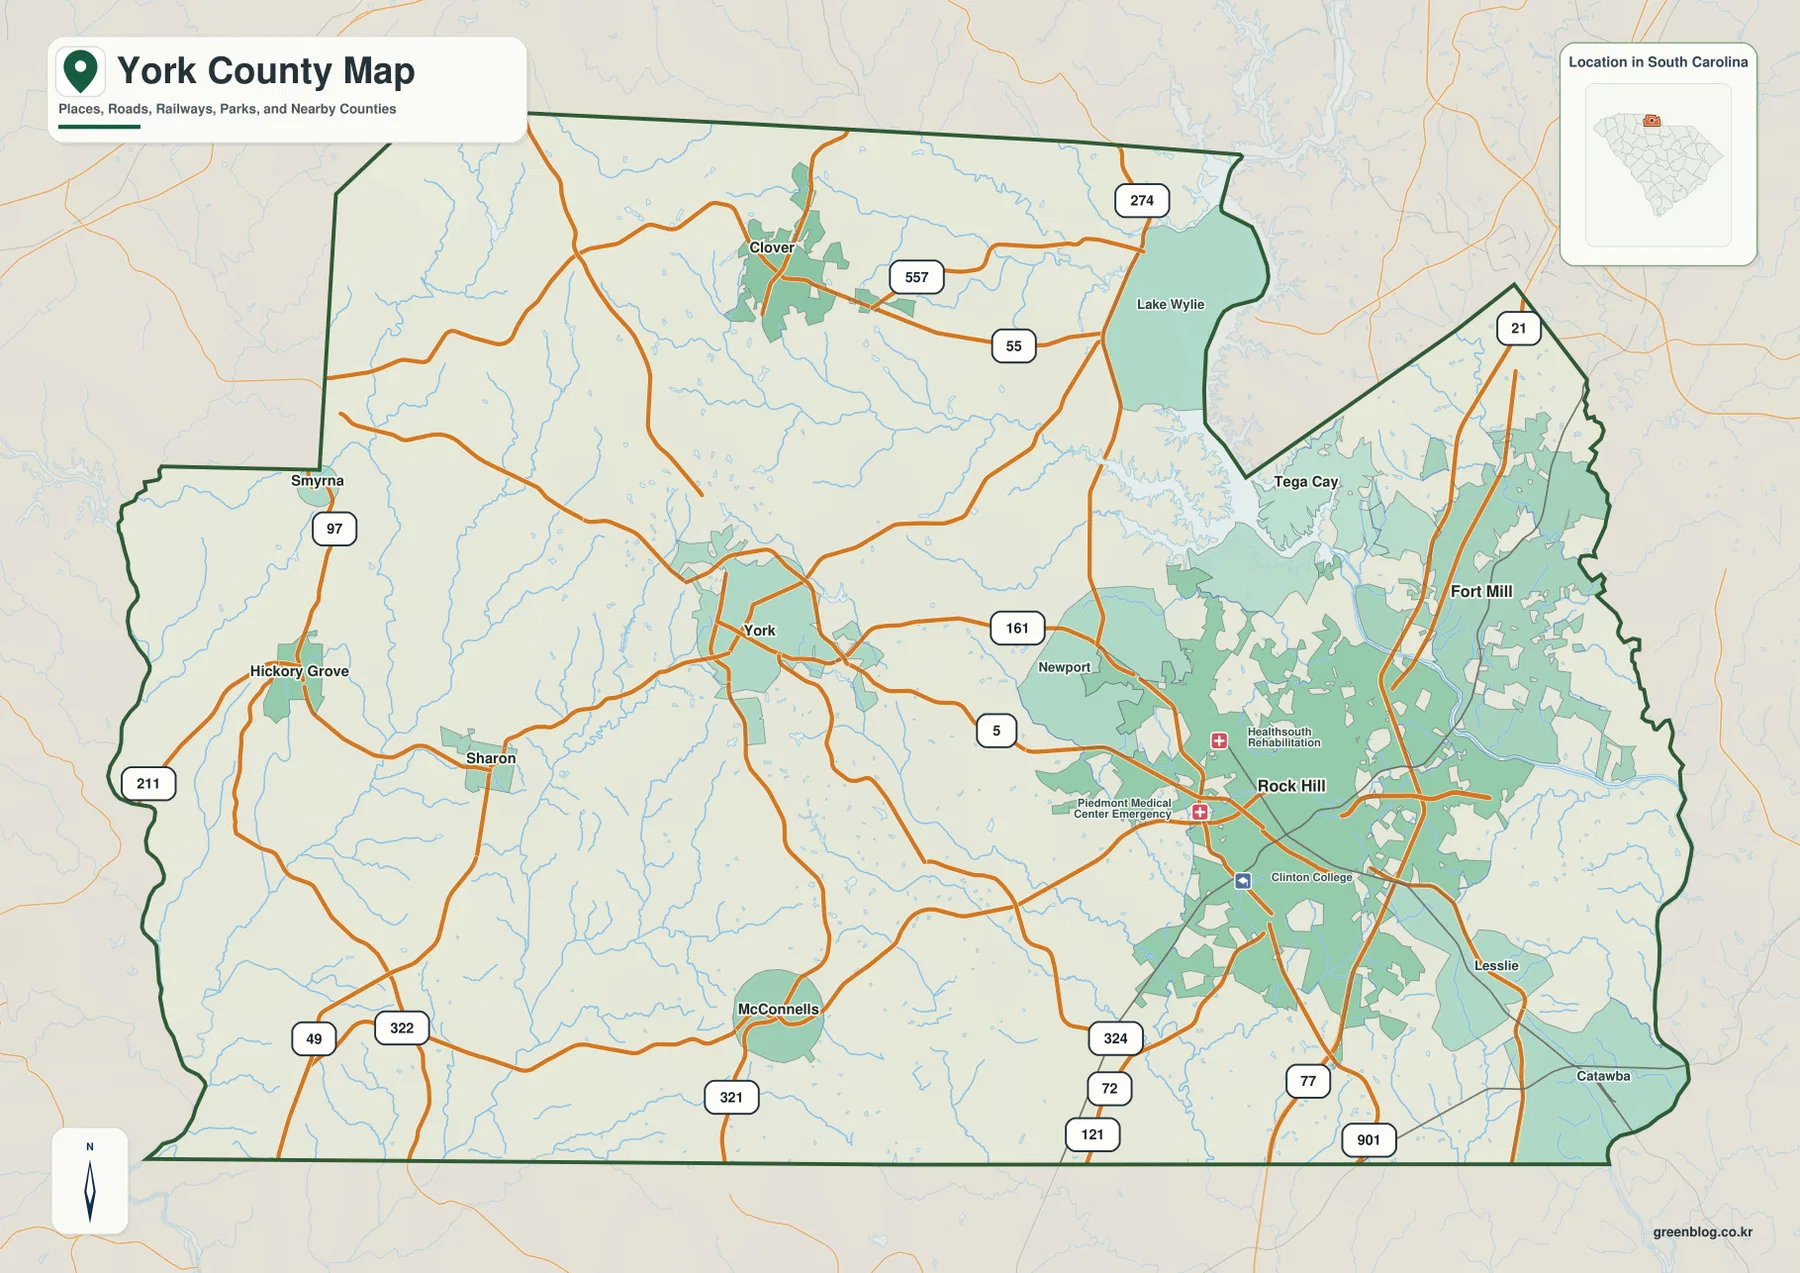
On the general county map, I-77 is the clearest transportation reference in the eastern half. It runs through the Fort Mill and Rock Hill corridor, with Route 21 nearby in the north. Fort Mill lies above Rock Hill, Tega Cay sits northwest of Fort Mill near the Lake Wylie side, and Lesslie and Catawba appear south and southeast of Rock Hill. Routes 901 and 121 provide additional reference lines in the southeastern section.
Moving west from Rock Hill changes the road pattern. Route 72 and 324 extend toward McConnells, while Route 5 and 161 help locate Newport and the York side. The map is noticeably more crowded around Rock Hill than around the central county seat, so a practical way to read it is to begin with I-77 and then add the smaller route shields only when needed.
York and Clover mark a different road pattern west of the I-77 corridor
York occupies a central position and works well as a bridge between the eastern urban area and the smaller communities to the west. Route 161 runs north toward Clover, where 55, 557, and 274 are visible. Lake Wylie lies east of Clover, so the northern part of the county can be read by pairing the Clover road network with the large water body immediately to its east.
Sharon and Hickory Grove appear west of York, and Smyrna is labeled near the northwestern edge. Routes 49, 322, 97, and 211 are more useful in this area than the interstate system. McConnells lies south of York near Route 321. The western half therefore has a dispersed local-road pattern, unlike the more concentrated north-south transportation spine around Fort Mill and Rock Hill.
The six-city map makes the east-west split immediately visible
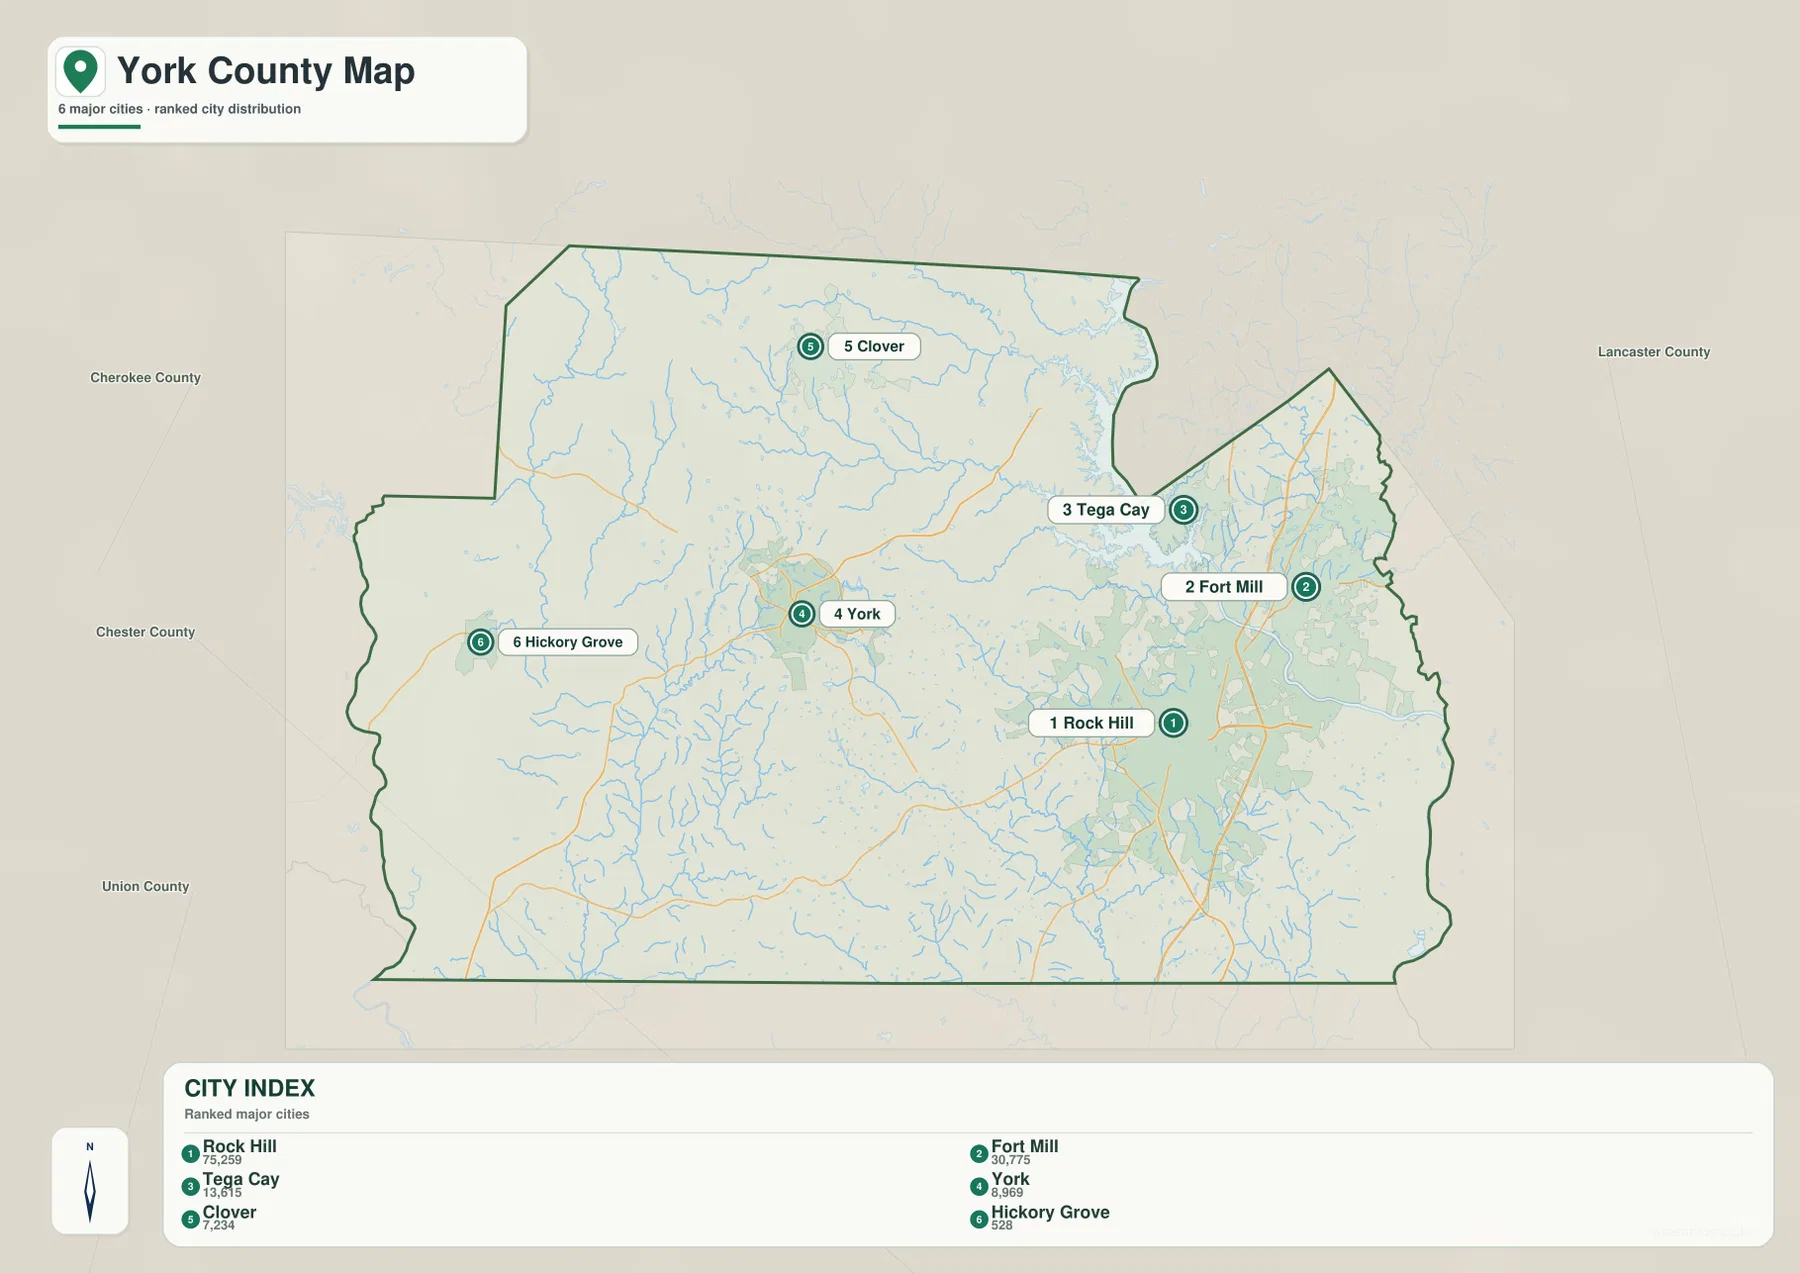
The ranked city map places Rock Hill first, Fort Mill second, Tega Cay third, York fourth, Clover fifth, and Hickory Grove sixth. These numbers are city-index rankings, not distance measurements. The first three markers are concentrated on the eastern side, while York, Clover, and Hickory Grove extend the pattern toward the center and west.
This simplified view is useful because it removes most of the road clutter. Rock Hill and Fort Mill can be recognized as a close eastern pair, Tega Cay sits to their northwest, York occupies the middle of the county, Clover is farther north and west, and Hickory Grove is the westernmost of the ranked places. Once that arrangement is clear, the general map can be used to add route numbers and smaller communities.
Lake Wylie and the Catawba River dominate the eastern water map
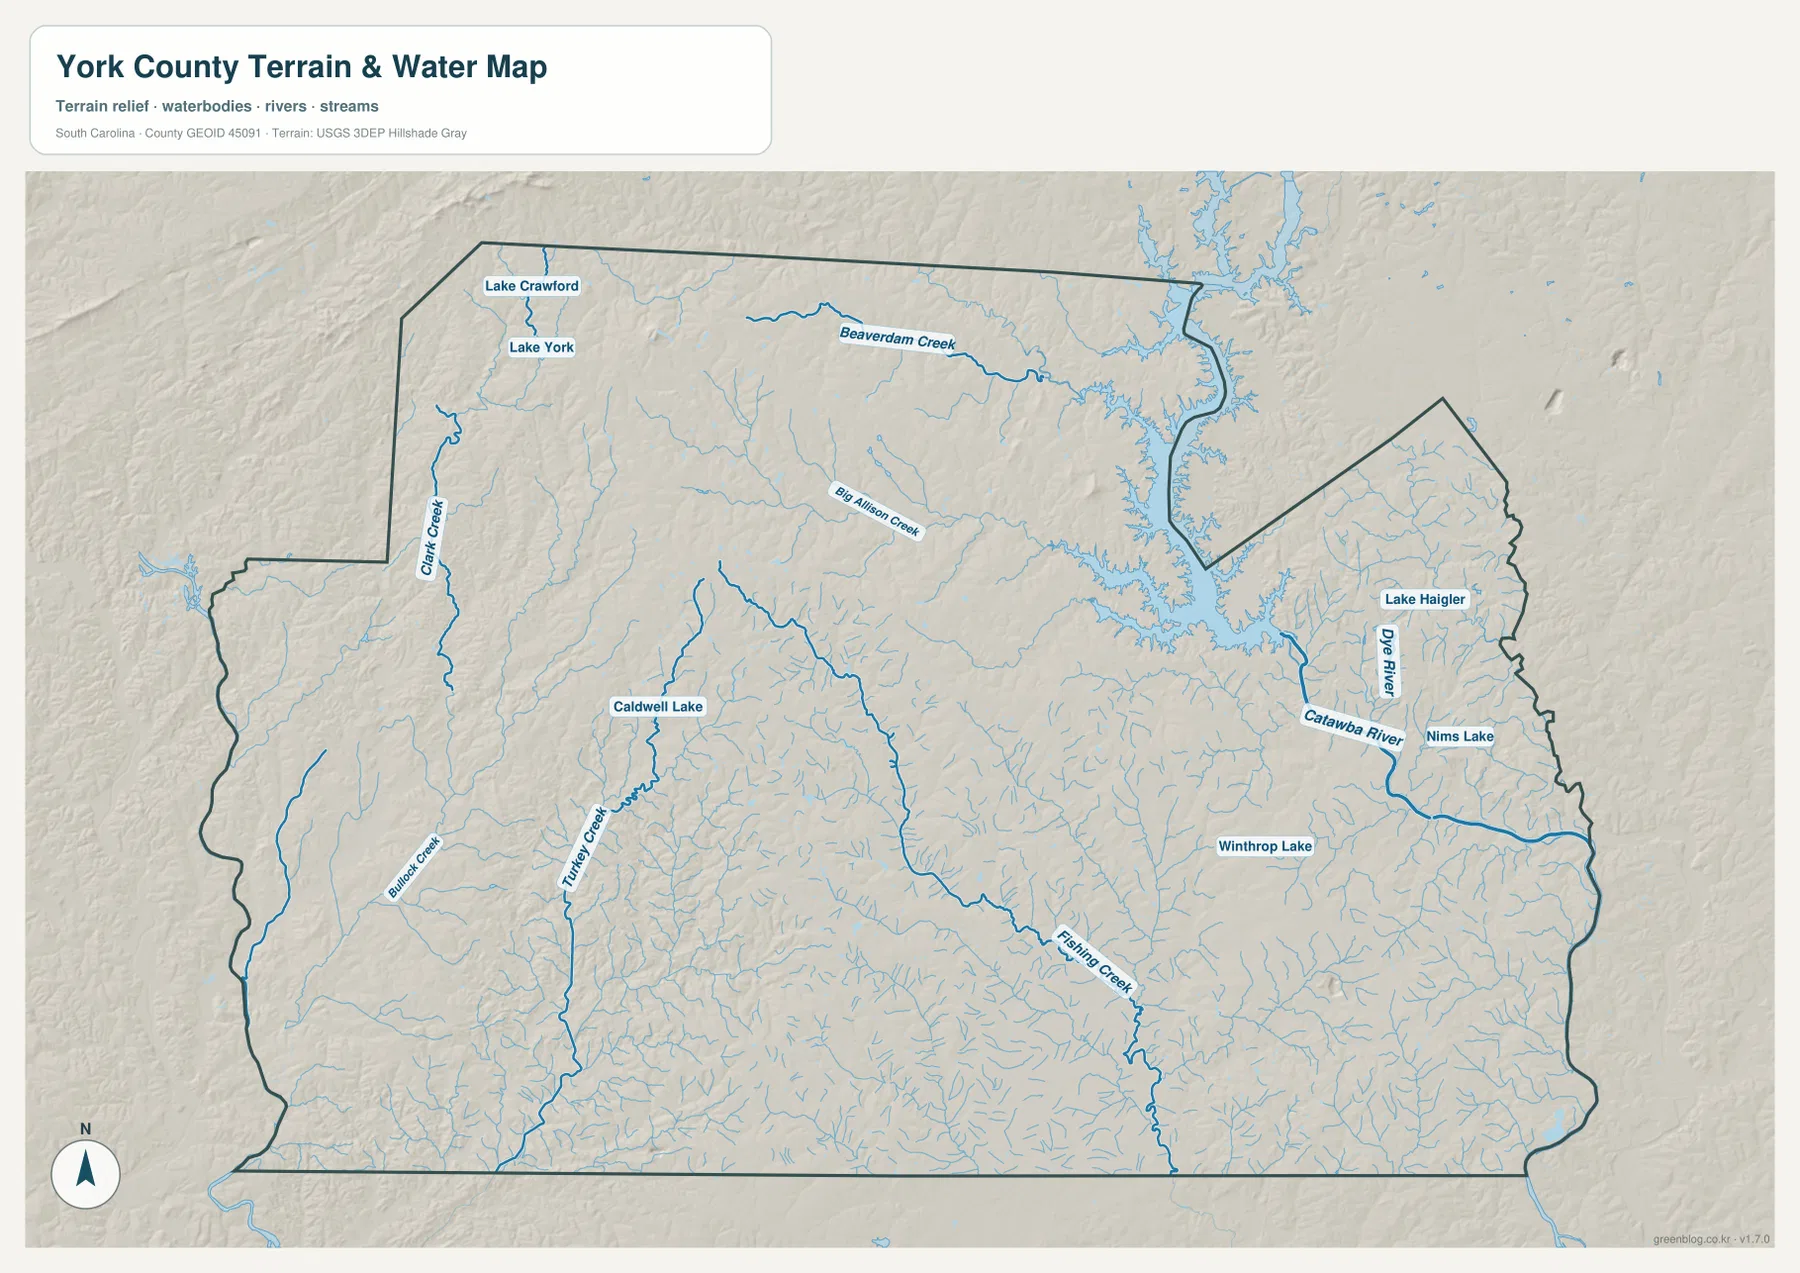
The terrain-and-water map gives the northeastern corner a completely different appearance. Lake Wylie fills a broad, branching area along the county’s northeastern side, with numerous narrow arms extending inland. South of the lake, the Catawba River is labeled as it continues past the Rock Hill side and toward the southeastern edge. These two features are the strongest water references in the county and provide a useful counterpoint to I-77 on the road map.
Several named tributaries and smaller water bodies appear around that larger system. Beaverdam Creek crosses the northern interior toward Lake Wylie, while Big Allison Creek approaches from the center. Winthrop Lake is labeled near Rock Hill, and Lake Haigler and Nims Lake appear farther east. These smaller names are especially helpful when the goal is to distinguish parts of the eastern county rather than simply identify the large river and reservoir.
Creeks and smaller lakes spread across the western interior
The western water pattern is more dispersed. Gill Creek follows the northwestern side, Bullock Creek appears in the southwest, and Turkey Creek runs through the west-central interior. Caldwell Lake is shown along the Turkey Creek area, while Lake Crawford and Lake York sit close together near the northwestern edge. No single western water body visually dominates the map the way Lake Wylie does in the northeast.
Fishing Creek also cuts through the central-southern portion of the county before continuing toward the larger eastern drainage. The shaded relief shows rolling, broken terrain around many of these channels rather than a flat surface. It should be read as relative terrain texture, not as a source for exact elevations. The creek network is the more useful feature here because it explains how water is distributed between the large Lake Wylie-Catawba system and the smaller western basins.
Choose the map according to whether the question is about cities, roads, or water
For a place-name question, begin with the city map. It quickly separates Rock Hill, Fort Mill, Tega Cay, York, Clover, and Hickory Grove. Then switch to the county map to add I-77, Route 21, 161, 55, 49, 321, or other labeled roads. This order is particularly helpful in the eastern urban corridor, where the general map contains many overlapping roads and developed areas.
For Lake Wylie, the Catawba River, or smaller creeks, start with the terrain-and-water map instead. Once the water feature is located, the general map can show which towns and highways are nearby. The WebP images are optimized for browser viewing; the downloadable ZIP contains the matching high-resolution A3 JPG originals for print layouts and larger documents.
These maps are general geographic references, not live-navigation, legal-boundary, parcel, flood-risk, or survey products. Road conditions can change, official boundaries require authoritative records, and the shaded relief does not provide exact spot elevations. Use current agency data whenever a decision depends on those details.
Frequently Asked Questions
Which map is best for comparing Rock Hill, Fort Mill, and Tega Cay?
The ranked city map is the quickest choice because all three appear in the eastern cluster without the full road network. After locating them, use the general map to add I-77, Route 21, and the surrounding road system.
Where are Lake Wylie and the Catawba River shown most clearly?
Use the terrain-and-water map. Lake Wylie fills the northeastern corner, and the Catawba River continues south of the reservoir along the eastern side. Beaverdam Creek, Big Allison Creek, Fishing Creek, and several smaller lakes are visible there as well.
Do the numbers on the city map represent distance?
No. They are ranking labels for the six highlighted cities. The map does not provide straight-line or driving distances, so route-based travel should be checked on the general county map or with a current navigation source.
Map File Information
Download the York County general map, ranked city map, and terrain-and-water map together as high-resolution A3 JPG files.
- Included Files: 3 JPG maps
Related Maps
Sources and Reference Data
- U.S. Census Bureau TIGER/Line Shapefiles: county boundaries, roads, and geographic reference data
- USGS National Hydrography: rivers, streams, lakes, and hydrographic reference data
- USGS 3D Elevation Program: terrain and elevation reference data
- South Carolina Association of Counties: county administrative reference information
Green Map creates custom-edited map images using open geographic data sources such as geoBoundaries, Natural Earth, OpenStreetMap, and government open data.
These maps are edited visual materials, not raw data files, and are provided for education, documents, presentations, and graphic reference.