Logan County, Colorado, is dominated by grassland and agriculture in the 2025 land-cover summary, but the most useful way to read the county is to notice how those broad covers are interrupted by the South Platte River corridor and a compact developed center around Sterling. This page brings together four views: current land cover, forest and farmland, impervious surface and developed land, and a 1985–2025 class-difference map.
The WebP maps can be viewed on the page, and all four original JPG maps are available together in one ZIP below. The set works best when used as a sequence: locate the river and the largest farm blocks, isolate paved and built surfaces around Sterling, then compare those same areas with the long-term difference map.
Table of Contents
The South Platte corridor breaks up an otherwise broad grassland-and-farm landscape
A long band of water and wetlands runs from the southwest toward the northeast through Logan County. The pattern is narrow compared with the county as a whole, yet it stands out because the surrounding landscape is mostly grassland and agriculture. USGS maintains a monitoring location on the South Platte River at Highway 6 in Sterling and identifies that stream site as being in Logan County, which provides a clear geographic reference for the river corridor visible through the developed center.
Water covers only 0.36 percent of the 2025 county summary and wetlands account for 2.32 percent. Those small percentages can be misleading if read without location, because the blue and teal cells form a connected ribbon rather than a few isolated dots. In several places, agricultural blocks sit close to the river and wetland strip. The map supports that spatial comparison, but it does not by itself establish how any particular field is irrigated or what water rights apply to it.
A larger body of water is also visible in the western half of the county. It is much easier to see at page scale than the narrow stream and wetland cells. For watershed study or environmental education, the useful comparison is not simply the amount of blue on the map; it is the way water, wetland, cropland, and open grass cover meet along the same corridor.
Grassland leads at 58.97 percent, with agriculture close behind at 34.36 percent
The county summary identifies grassland as the dominant 2025 class at 58.97 percent. Agriculture is second at 34.36 percent. Developed land contributes 3.67 percent, wetlands 2.32 percent, water 0.36 percent, shrubland 0.23 percent, and forest is reported at 0.00 percent. Together, grassland and agriculture account for the overwhelming majority of the mapped surface, which explains why the county appears as a broad mixture of pale grass tones and yellow farm blocks rather than as a forested or heavily urbanized landscape.
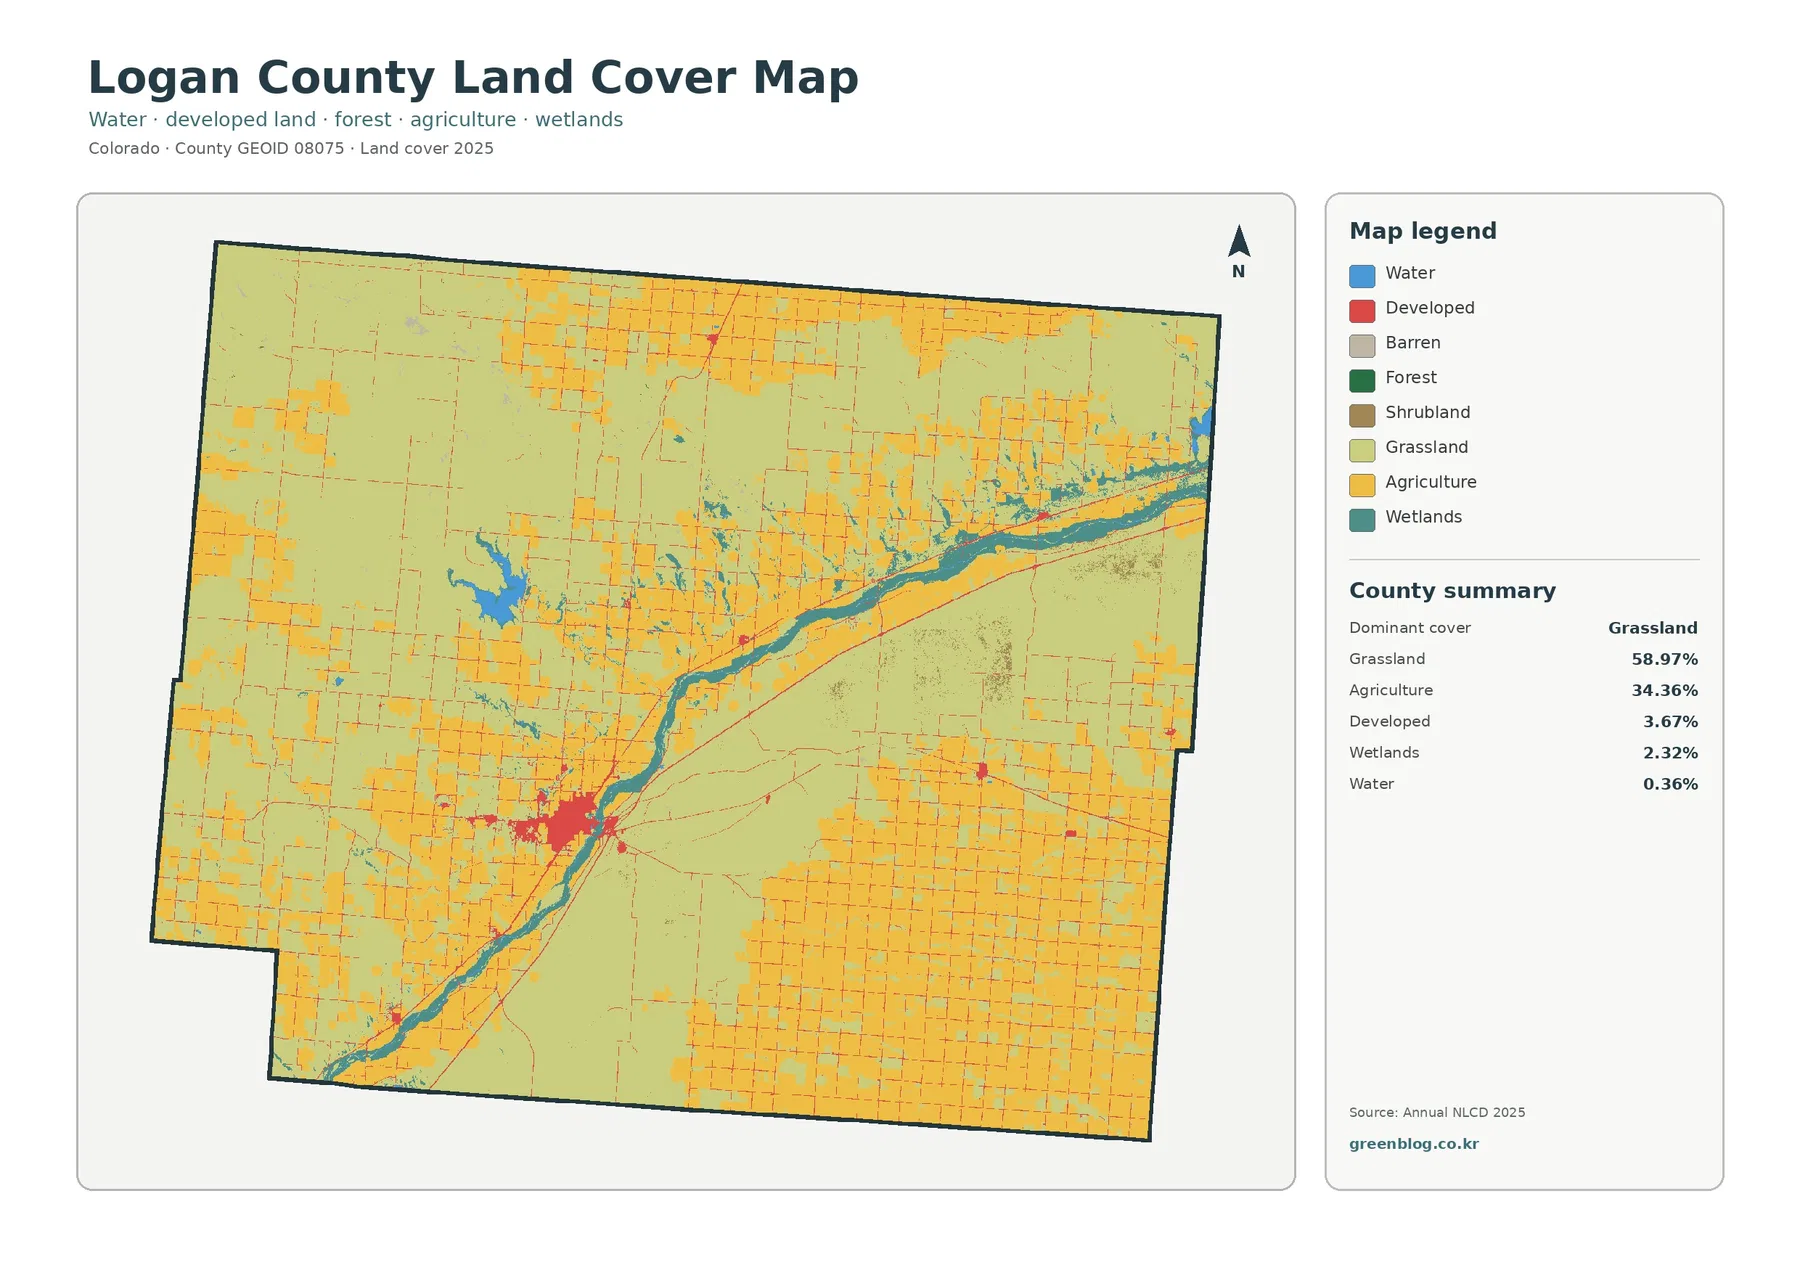
Farm cover is not confined to one corner. Large angular patches recur across the north, the southeast, and parts of the river corridor, while grassland occupies the spaces between them and extends across broad areas of the county. This gives Logan County a different pattern from counties where agriculture forms one continuous belt. Here, cultivated blocks are substantial but repeatedly separated by open grass cover.
Developed land is a small countywide class, yet it is easy to locate because one concentration near Sterling is much denser than the scattered developed cells elsewhere. That contrast is important when reading percentages. A class can occupy only a few percent of the county and still be highly significant for identifying the main settlement and transportation pattern.
The farm-focused view makes the cultivated blocks easier to compare
The forest-and-farmland map simplifies the color scheme and makes the relationship between cropland and the open grass-and-shrub background much easier to follow. Agriculture remains 34.36 percent and grassland remains 58.97 percent. Yellow farm blocks appear in repeated clusters, especially across the northern portion and in broad groups toward the southeast. Smaller cultivated areas also occur around the central river corridor.
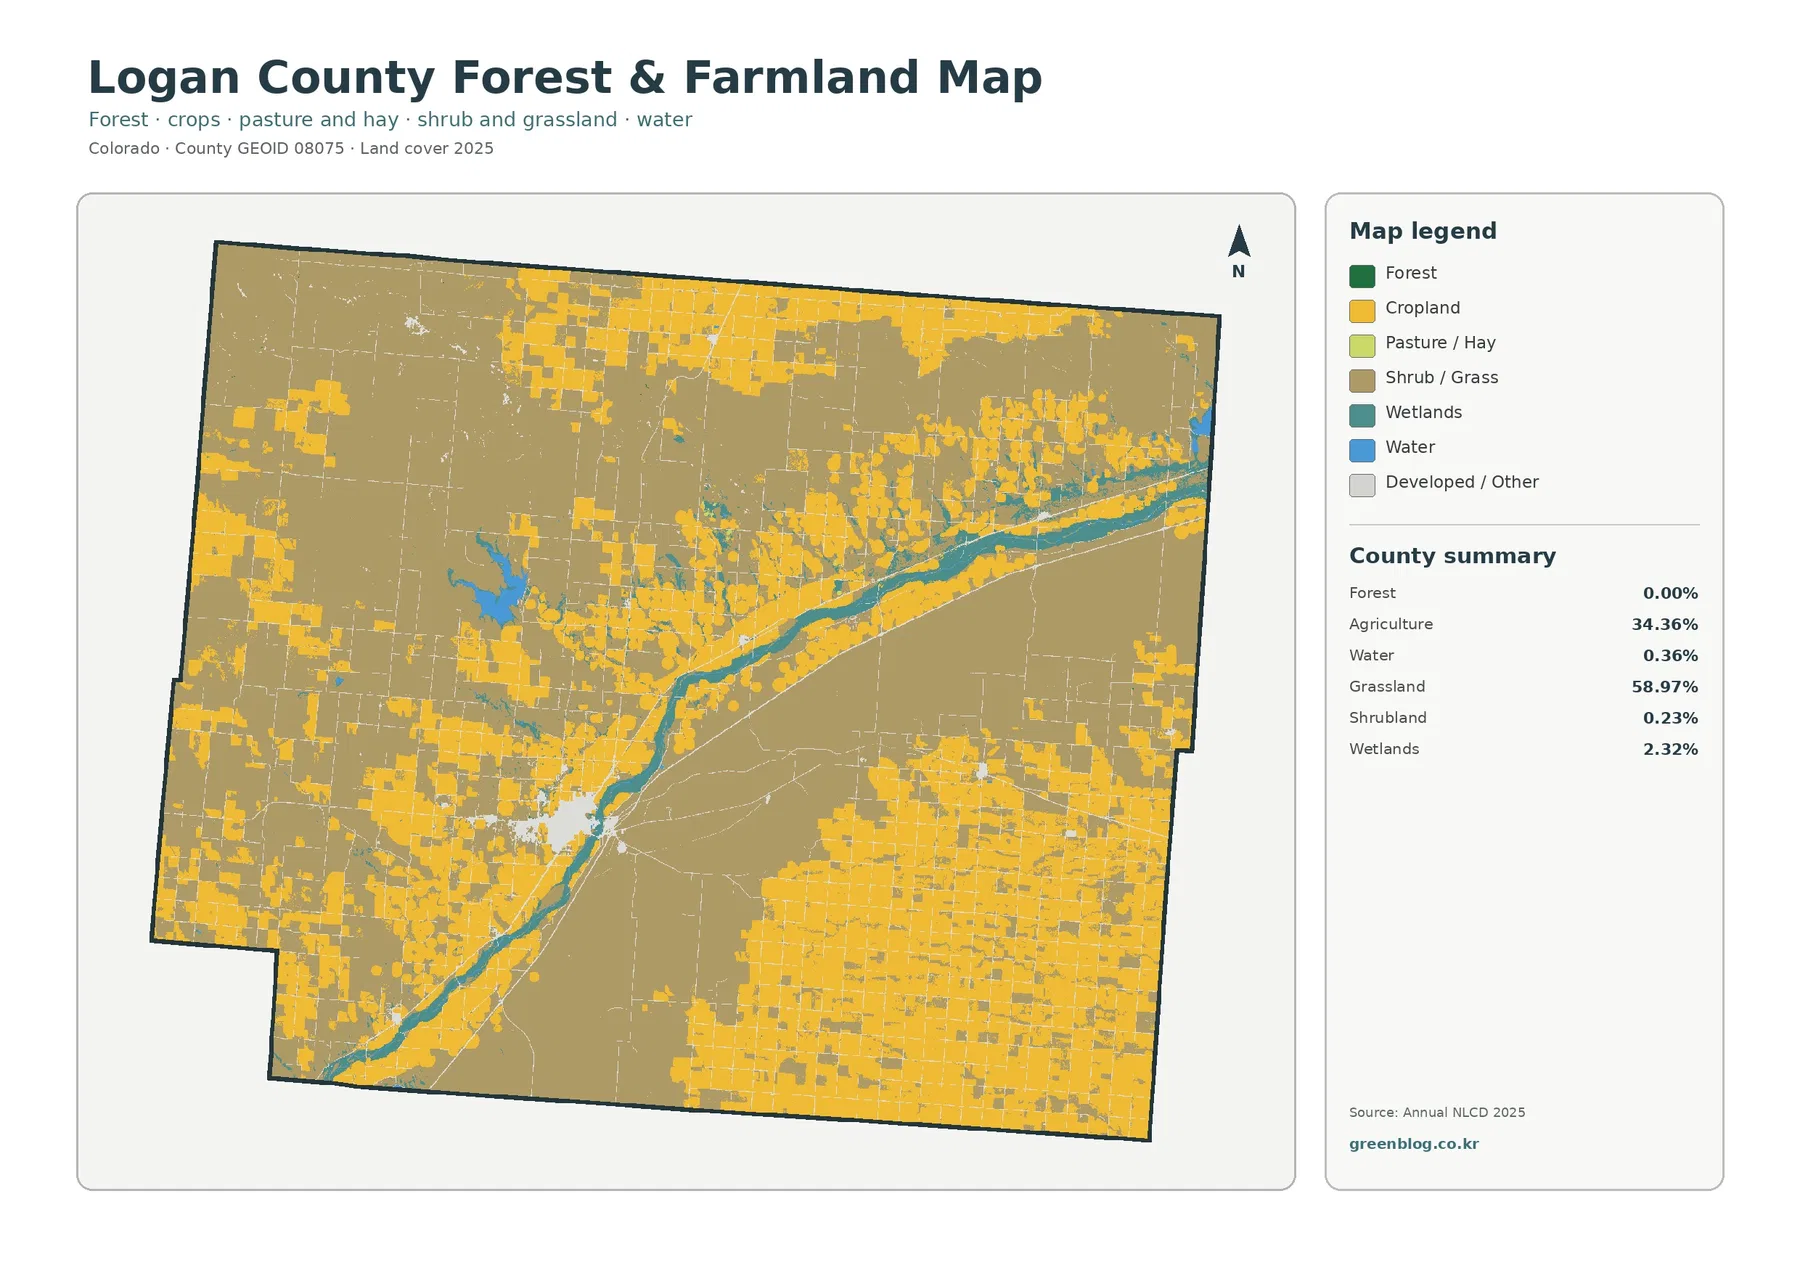
The 0.00 percent forest value should not be interpreted as proof that no trees exist anywhere in Logan County. It means the summarized classification does not report a meaningful countywide area in the forest class at the displayed precision. Narrow tree lines, farmstead trees, and small wooded strips can be mixed with adjacent grass, cropland, wetland, or development inside a 30-meter raster cell and may not appear as separate forest patches.
Local agricultural context supports using this map as more than a simple color key. Colorado State University’s Logan County Extension lists crops and cropping systems, irrigation and water management, forage, hay and pasture, and dryland practices among its local agronomy topics. Those programs fit the broad agricultural and grassland setting shown in the map, but they do not identify the crop type or management practice of any individual mapped field.
Sterling is the clearest concentration of impervious surface
Impervious surface means pavement, rooftops, parking areas, and other hard surfaces that do not readily absorb water. Logan County has a mean imperviousness of 0.64 percent, and only 0.18 percent of the county is in cells with at least 50 percent impervious cover. Developed land as a broader class is 3.67 percent. These values are low enough that most of the impervious map appears nearly blank at county scale.
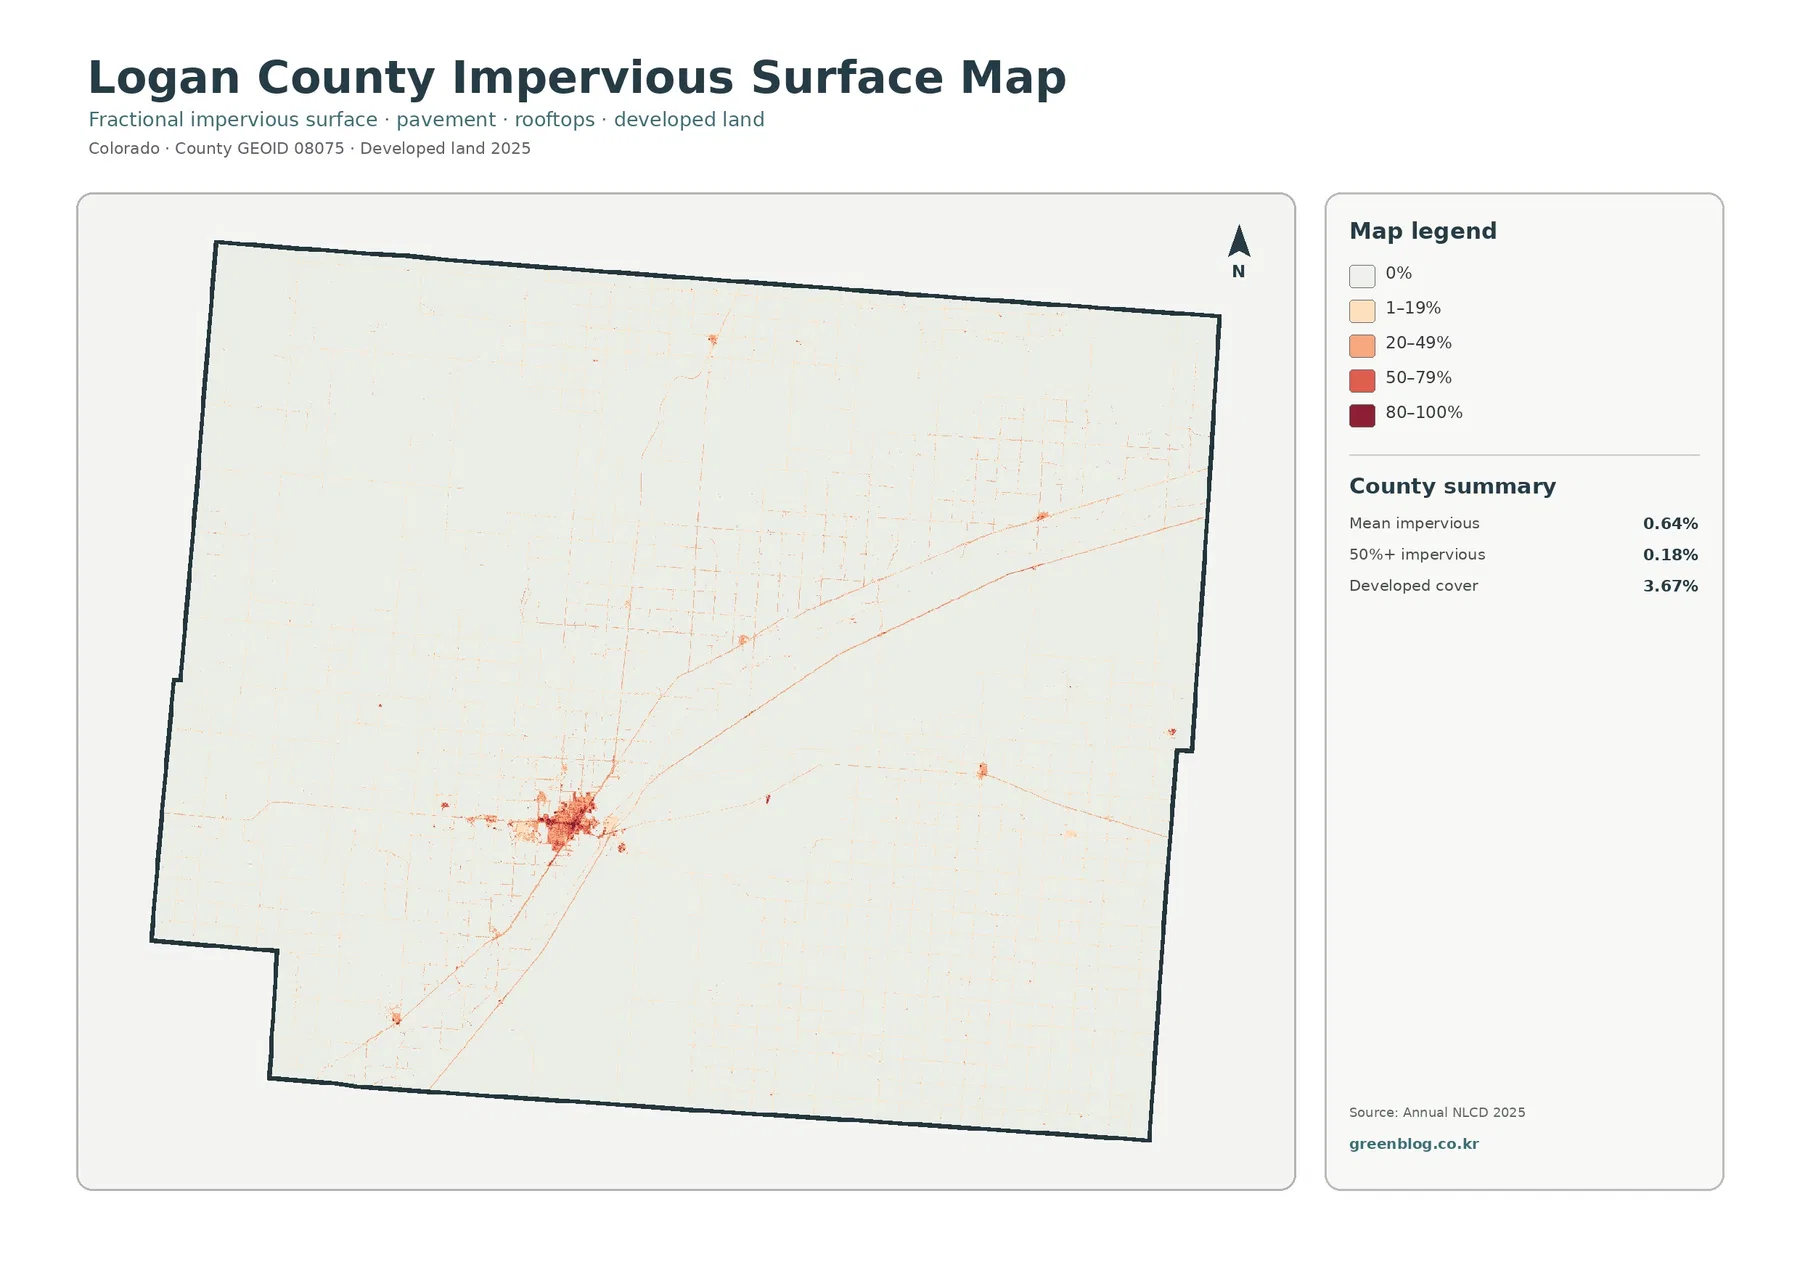
The concentration around Sterling is unmistakable. Darker red and orange cells form a compact cluster, while thin lines extend away from that center and connect with smaller developed points. The map does not label roads, so those lines should not automatically be assigned a highway name. They are better read as places where paved or built surface is concentrated until a transportation map is used for confirmation.
This view is especially helpful when the general land-cover map feels visually busy. Grassland, agriculture, water, and wetlands largely disappear from the impervious display, leaving the built pattern isolated. It is therefore a better choice for comparing settlement concentration, hard-surfaced corridors, or the relative scarcity of dense development outside Sterling.
Agricultural-loss classification dominates the 1985–2025 difference map
The long-term comparison marks class differences across 14.49 percent of Logan County between 1985 and 2025. Agricultural loss is the largest named component at 10.59 percent. Areas classified as developed account for 0.62 percent, other class differences account for 2.93 percent, and forest loss is 0.00 percent. Wetland-related differences are also visible in the legend and along parts of the river corridor, although the supplied summary does not provide a separate percentage for that category.
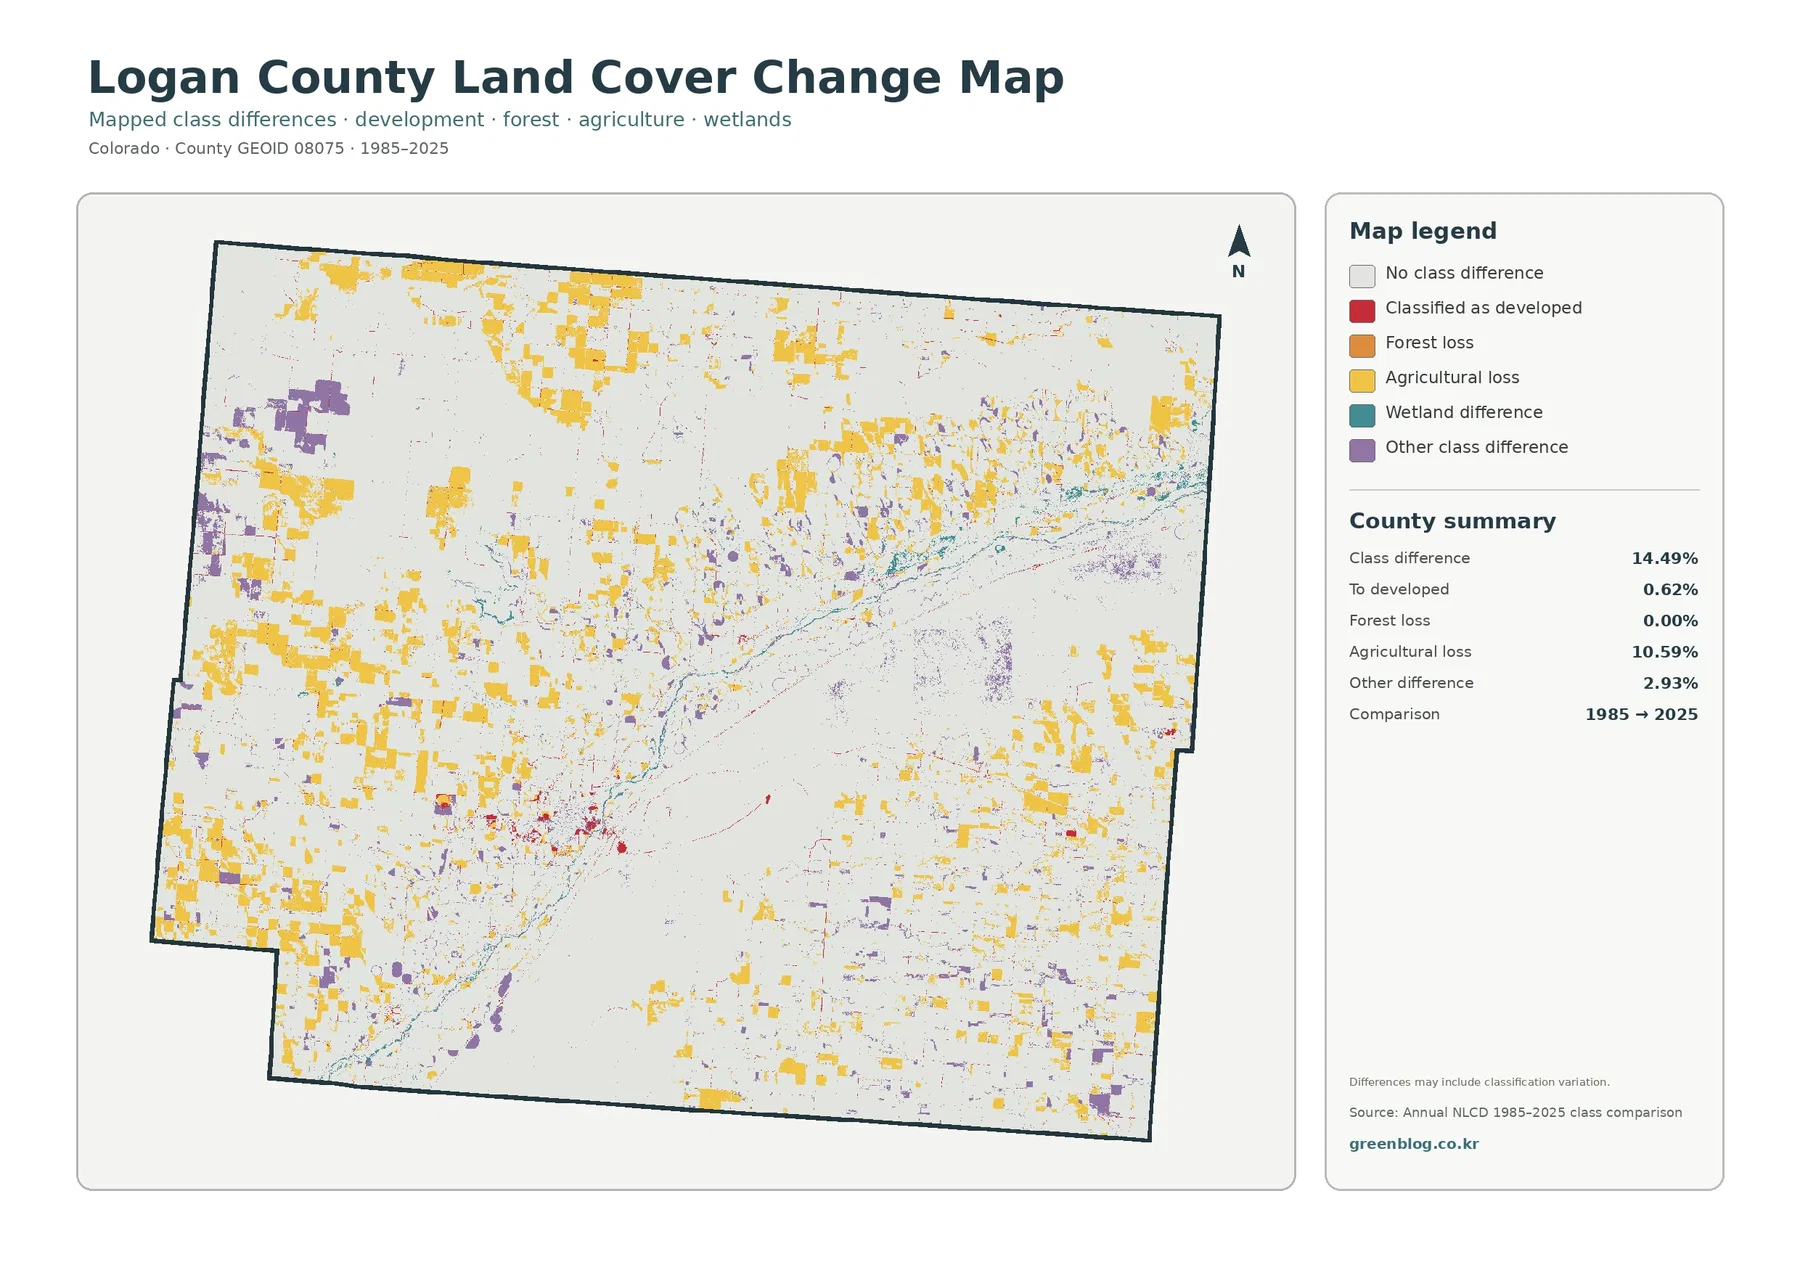
Yellow agricultural-loss cells occur in broad patches across the north, west, and southern farm areas rather than in a single compact zone. Red cells classified as developed are more limited and are most noticeable around the Sterling area and a few smaller locations. Purple other-difference patches are scattered in several parts of the county. Along the river, narrow wetland-related differences add another pattern that is easy to miss if the map is viewed only as a countywide percentage.
The 10.59 percent agricultural-loss value is not the same thing as a measured 10.59 percent decline in working farmland. A class-difference map compares mapped categories at two dates. Real land-cover change can contribute, but crop rotation, temporary fallow conditions, vegetation at the time of imagery, mixed pixels, and classification uncertainty can also alter the assigned class. Agricultural statistics and additional years of imagery are needed before making a direct claim about how much productive farmland was lost.
Choose the map according to the question you are asking
For a quick county overview, the current land-cover map is the best starting point because it puts grassland, agriculture, water, wetlands, and development in the same frame. If the goal is to compare the shape and spacing of cultivated areas, the farm-focused map removes much of the visual competition and makes the yellow blocks easier to trace. The impervious map should be used when the question shifts from broad land cover to paved and built surfaces.
The change map belongs at the end of that sequence. Looking at it first can make every colored cell seem equally important, but the current maps provide the context needed to understand what those cells are near. A yellow difference patch beside a present-day farm block and a red difference near Sterling carry different meanings, and neither should be treated as a legal land-use record.
For classroom, watershed, planning-context, or presentation work, the four-map set is useful because the county boundary stays consistent. One image can establish the broad pattern, another can isolate agriculture, a third can show developed surfaces, and the final image can flag locations where the classification changed. This makes side-by-side comparison more informative than using a single map for every question.
Download the four original JPG maps for comparison and print use
The downloadable ZIP contains the four original JPG maps for Logan County: 2025 land cover, forest and farmland, impervious/developed land, and the 1985–2025 land-cover change comparison. They share the same county extent, so they can be placed beside one another in reports, lessons, presentations, or reference sheets without having to realign separate map frames.
Each source JPG in the supplied asset manifest is 2480×1754 pixels. The package marks that size as not meeting its A3 high-resolution reference. If the image will be enlarged for a large poster, check sharpness at the intended print size first. For screen use, ordinary documents, moderate-size prints, and side-by-side map comparisons, the original JPGs are generally more convenient than the smaller WebP previews shown in the article.
A 30-meter raster is a regional guide, not a parcel survey
Annual NLCD is a Landsat-based raster product with 30-meter spatial resolution. A raster divides the ground into grid cells and assigns values to those cells. A single cell can contain grass, a narrow road, a ditch, trees, and a small structure at the same time, so the mapped class is a generalized representation. Mixed pixels are one reason a narrow feature may disappear or a class boundary may not match a fence, parcel line, or field edge exactly.
The 2025 map is also a snapshot for that mapping year. New construction, paving, crop changes, flooding, or vegetation changes after the observation period are not represented. The 1985–2025 map compares two mapped classifications; it does not identify the year or reason for every change. For current site-level questions, recent aerial imagery, county records, field inspection, and the relevant water or planning agency should be used alongside the map.
Land cover should also be kept separate from zoning, ownership, legal land use, or development rights. A cell mapped as agriculture describes the surface classification, not the legal status of the parcel. A developed cell indicates a mapped developed cover class or hard-surfaced condition, not permission to build. The maps are strongest as broad visual references for comparing where different surface covers occur across Logan County.
Frequently Asked Questions
What is the dominant land cover in Logan County, Colorado?
Grassland is the largest 2025 class at 58.97 percent, followed by agriculture at 34.36 percent. Developed land is 3.67 percent and wetlands are 2.32 percent, while water and shrubland occupy much smaller shares.
Which map is best for finding development around Sterling?
The impervious-surface map is the clearest choice because it strips away most broad grassland and farm colors and highlights paved or built surfaces. The general land-cover map is useful afterward for seeing how the Sterling concentration sits beside the river corridor and surrounding agricultural and grassland cover.
Does 10.59 percent agricultural loss mean Logan County lost exactly that much farmland?
No. The value means 10.59 percent of the county is categorized as agricultural loss in the 1985–2025 class comparison. It can include real cover change, but imagery conditions, crop state, fallow periods, mixed pixels, and classification differences can also affect the result. Additional agricultural data are needed to measure farmland change directly.
Map File Information
This ZIP contains all four original JPG maps for Logan County, Colorado: current land cover, forest and farmland, impervious/developed land, and the 1985–2025 class-difference map.
- Included Files: Use only the versions confirmed in the article and supplied images
- File Type: Use the confirmed download contents
- Intended Use: Printing, education, presentations, and map-based projects
Related Maps
- Adams County Colorado Land Cover Map
- Alamosa County Colorado Land Cover Map
- Arapahoe County Colorado Land Cover Map
Sources and References
These official sources provide the land-cover definitions, boundary data, South Platte River reference, and local agricultural context used to interpret the maps.
- MRLC Annual NLCD Data – Annual NLCD land-cover and related datasets
- USGS Annual NLCD Land Cover Classification – class definitions and documentation
- U.S. Census Bureau TIGER/Line Shapefiles – county boundary data
- USGS South Platte River at Hwy 6 at Sterling – stream monitoring location in Logan County
- CSU Extension Logan County Topics – local agriculture, irrigation, range, and natural-resource information
- Logan County, Colorado – official county website
Green Map creates custom-edited map images using open geographic data sources such as geoBoundaries, Natural Earth, OpenStreetMap, and government open data.
These maps are edited visual materials, not raw data files, and are provided for education, documents, presentations, and graphic reference.