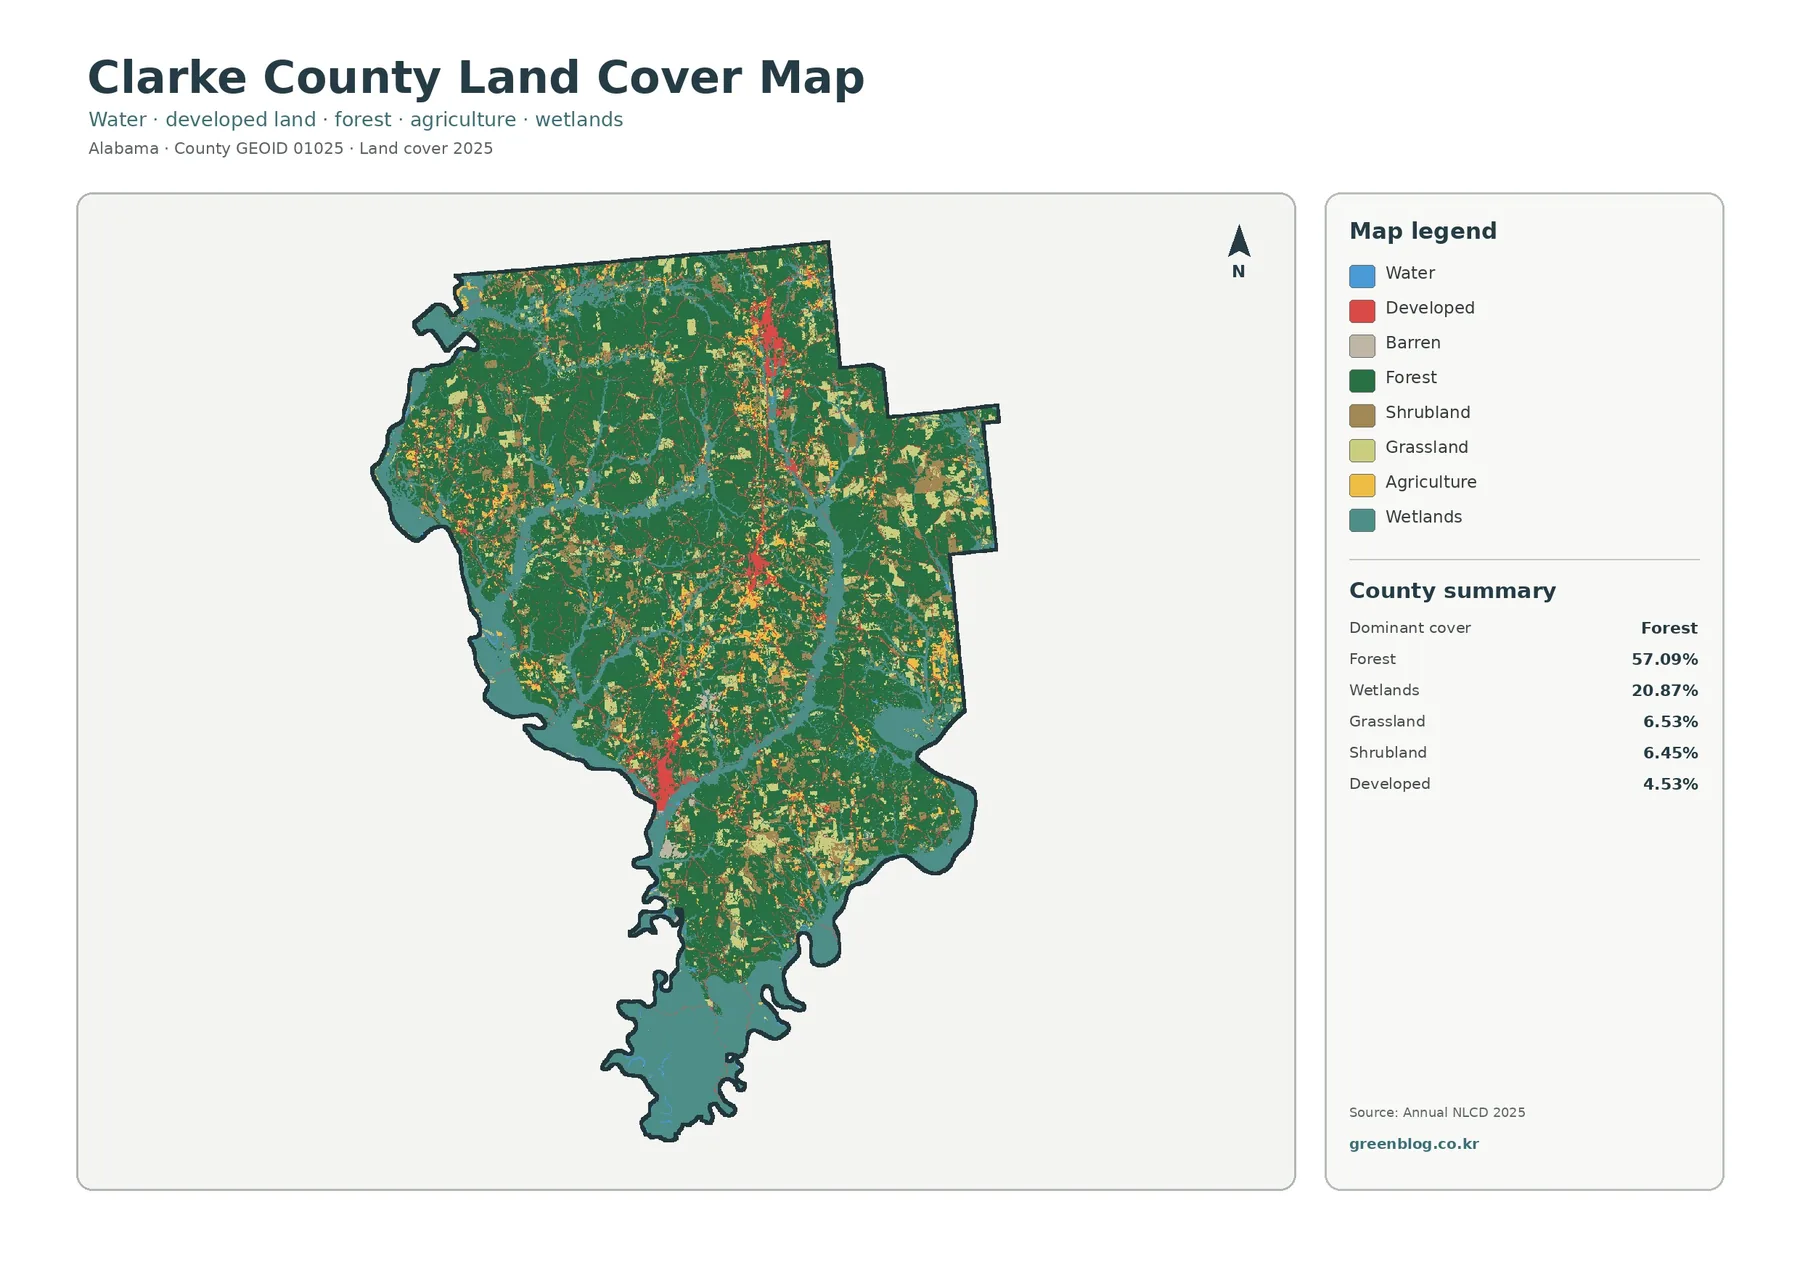
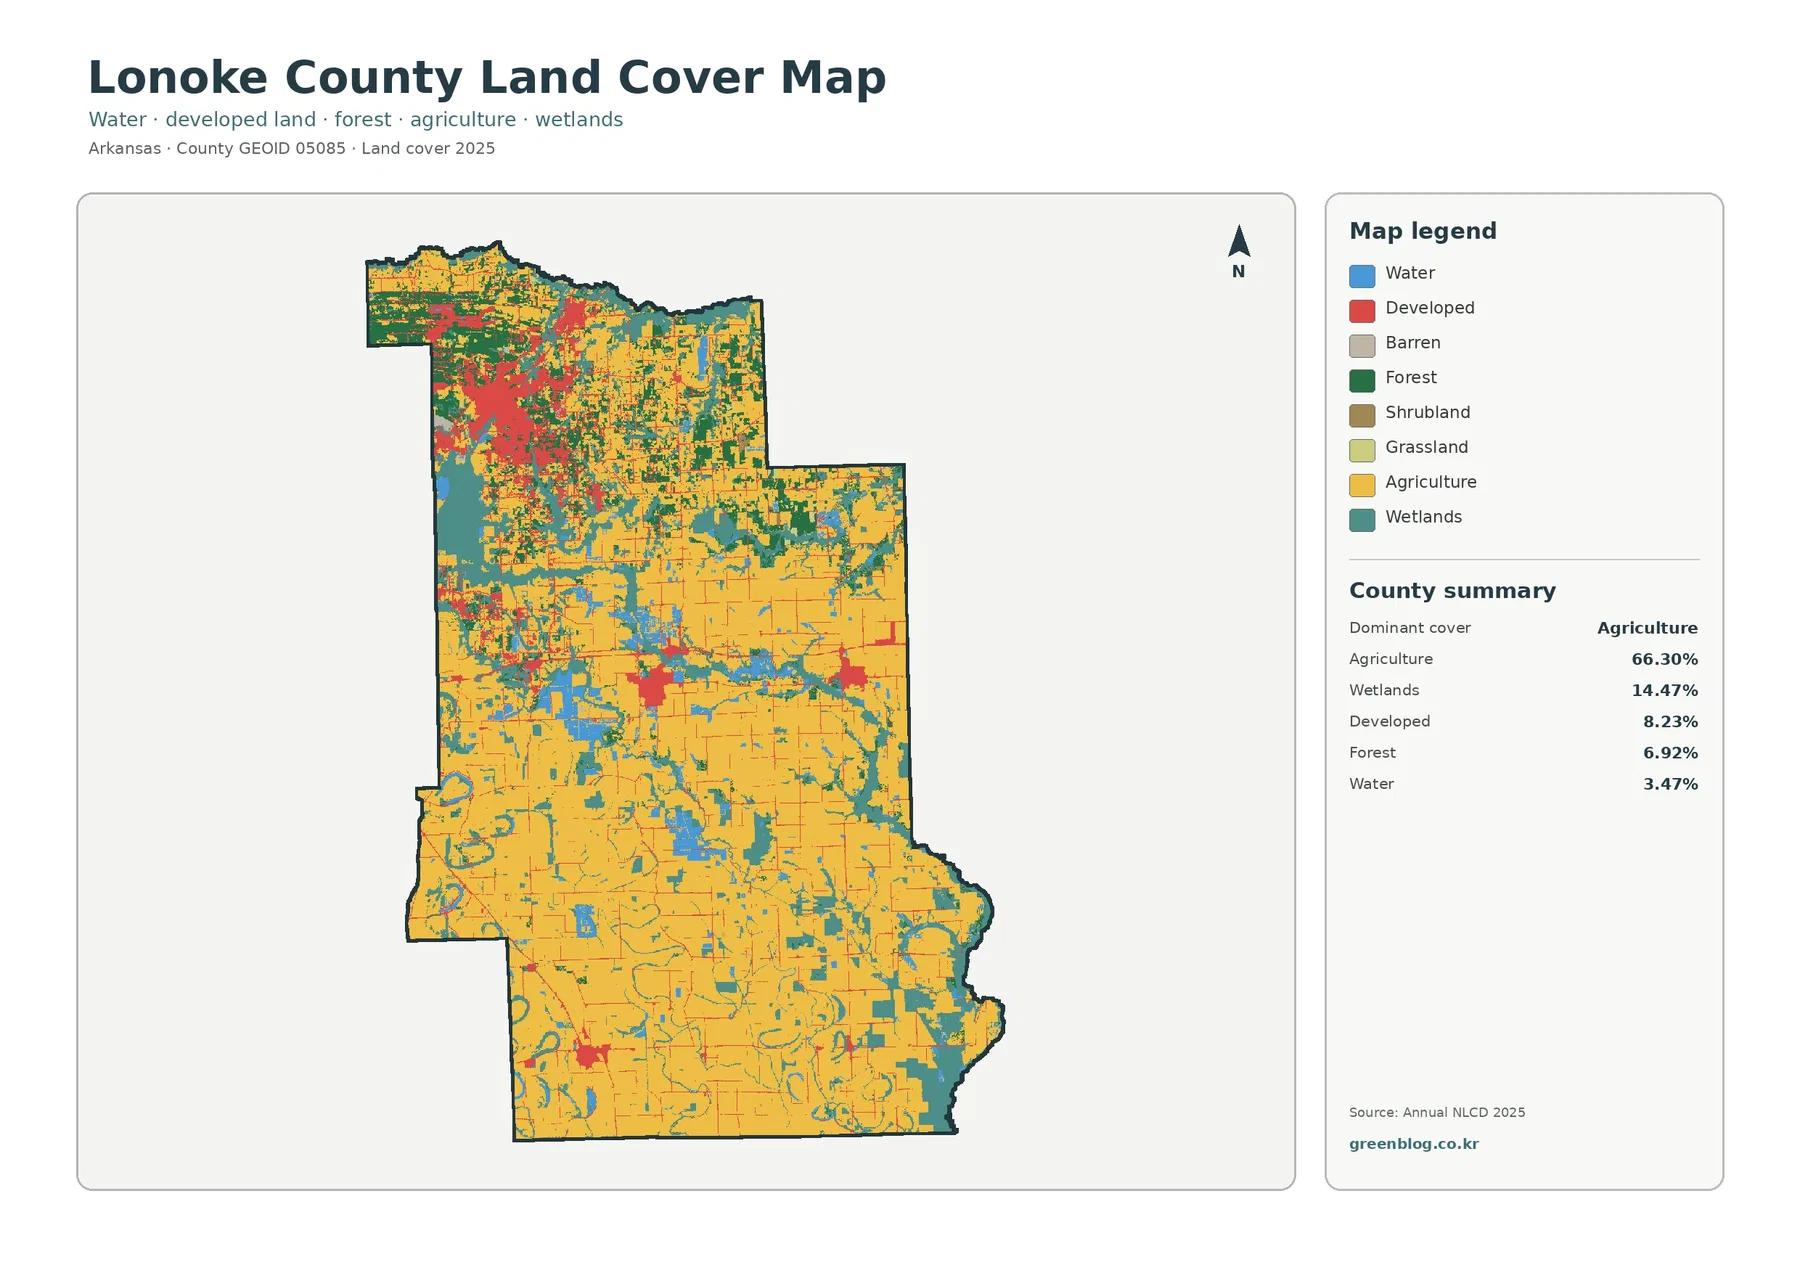
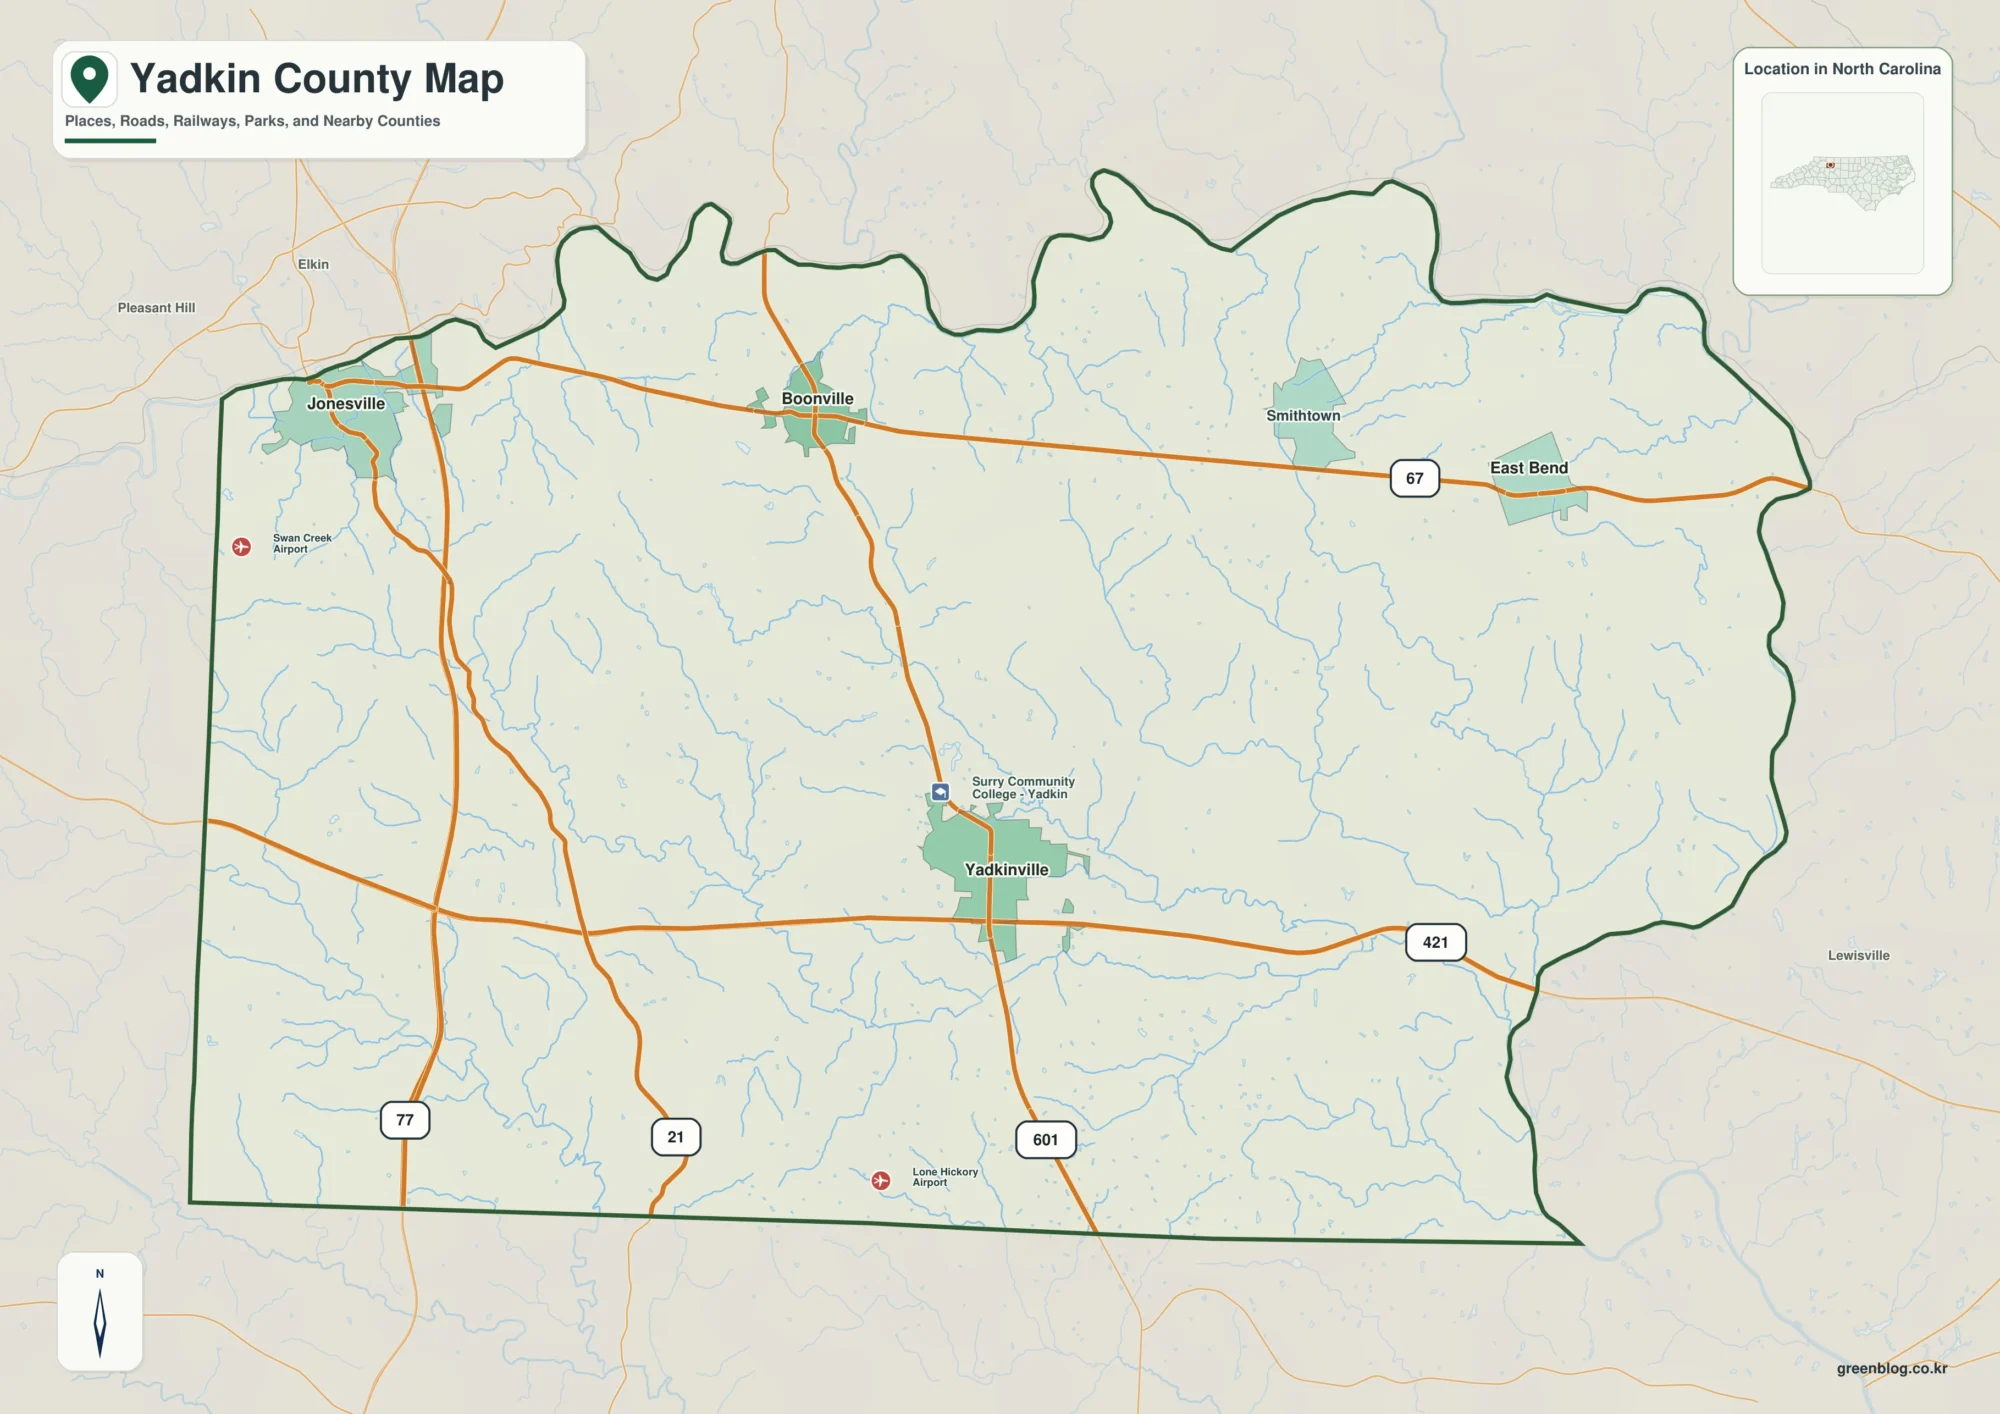
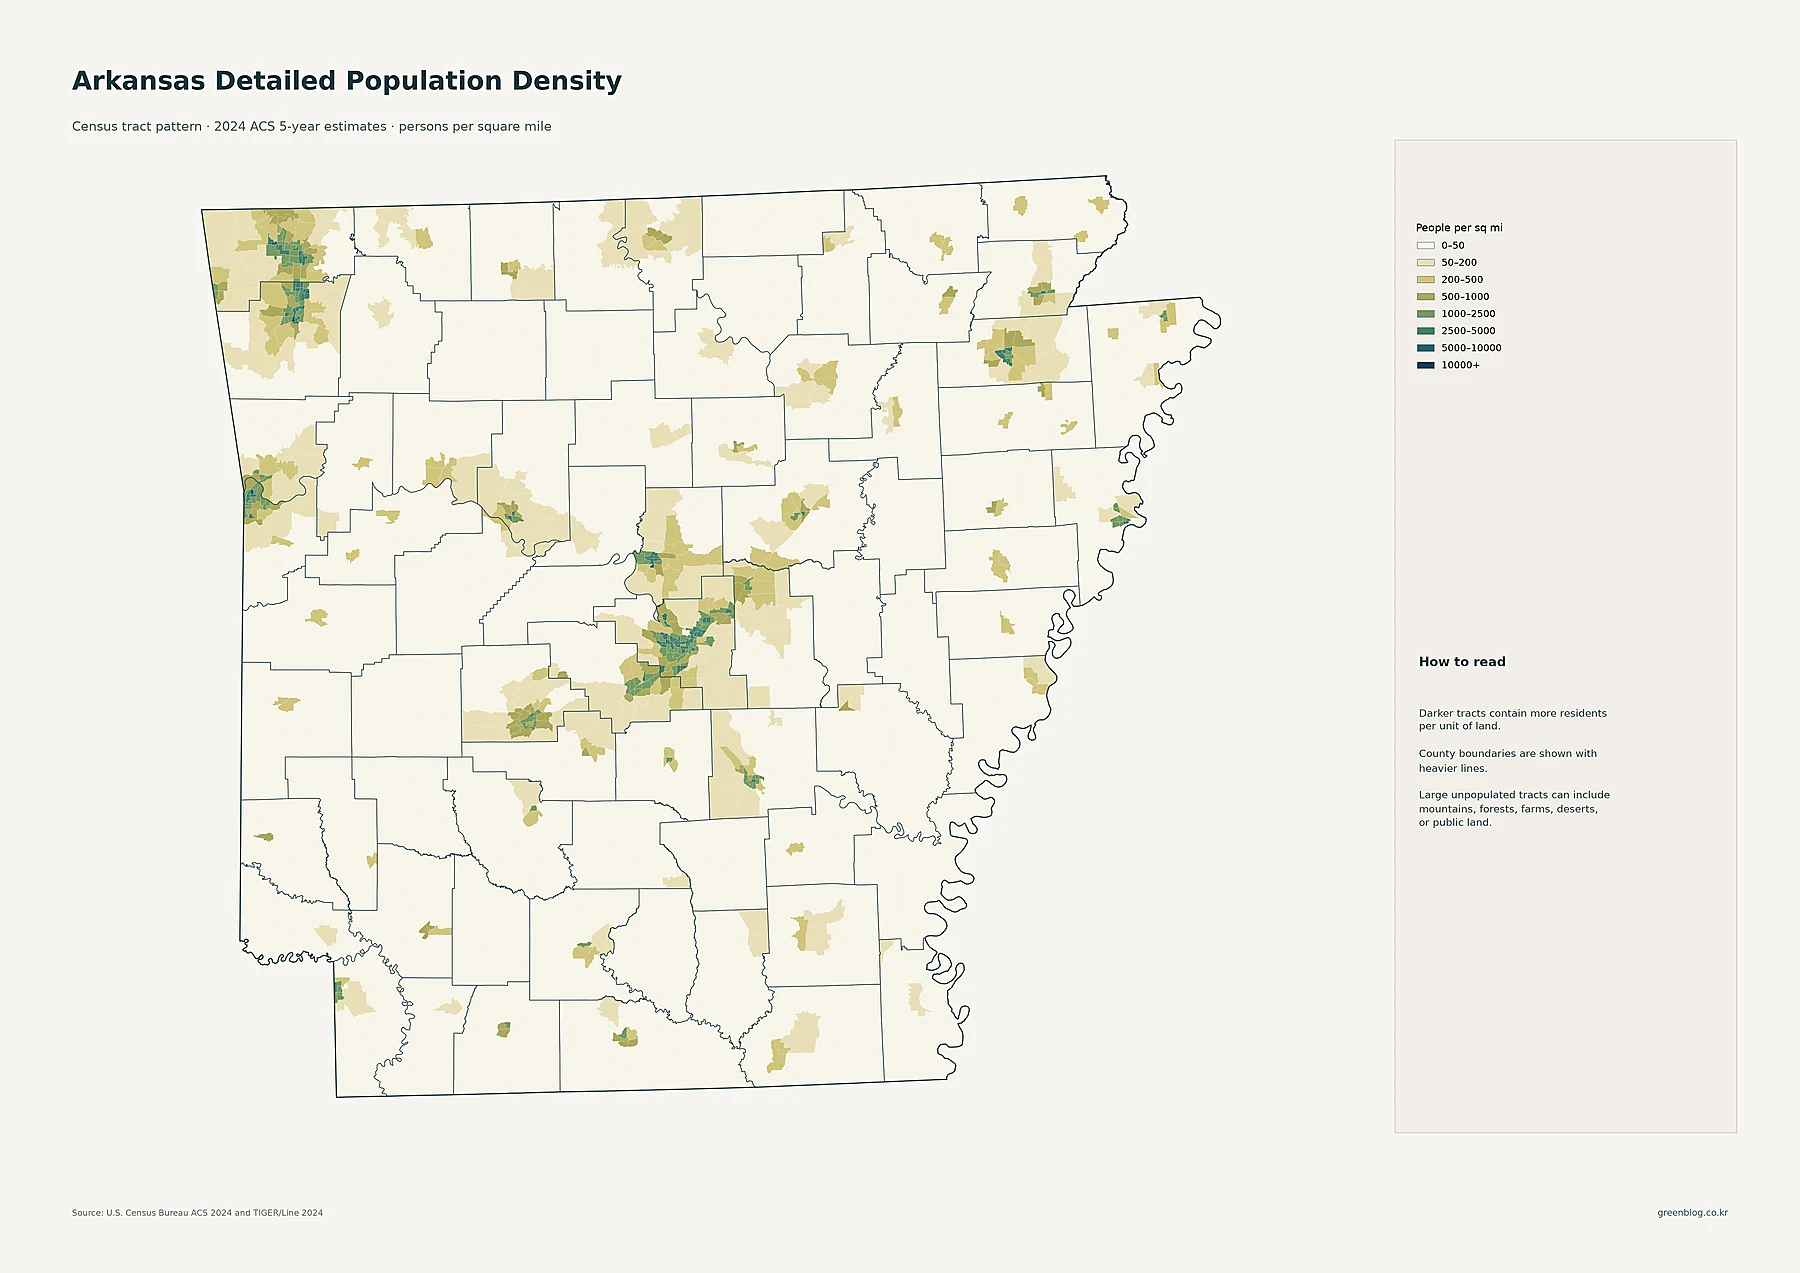
Lincoln County, Colorado is a land-cover page where one pattern is immediately clear: most of the county is open grassland, while cultivated land becomes much more prominent in the northern section. The four maps here separate present-day cover, forest and farmland classes, impervious surfaces, and mapped class differences between 1985 and 2025.
You can view the WebP maps in the article and download the four original JPG files together in one ZIP. The set works best when the maps are compared for different questions rather than treated as four versions of the same image: one establishes the broad cover pattern, another isolates farms, another finds hard surfaces, and the last marks where classifications differ through time.
Table of Contents
A small developed share still creates a visible east–west line
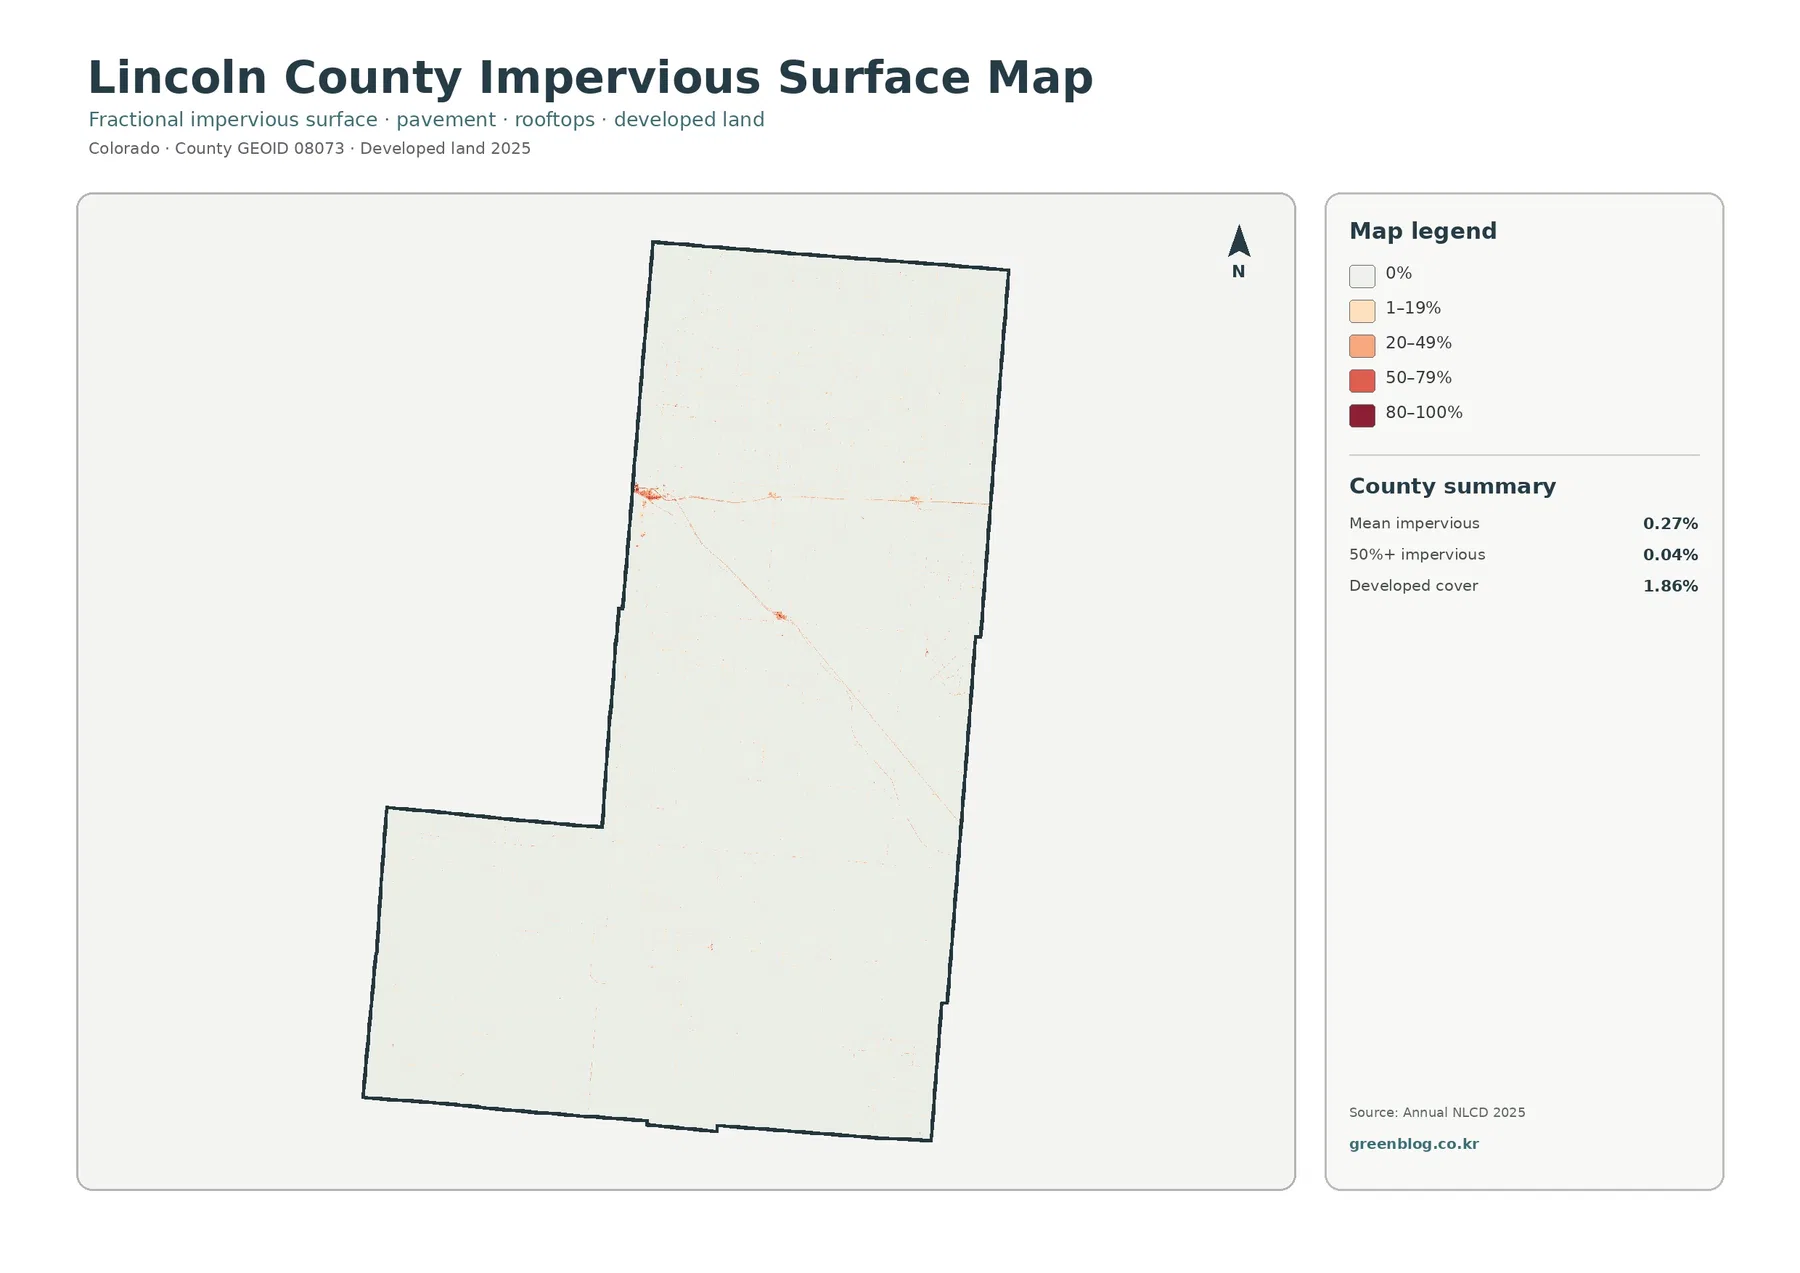
Developed land accounts for 1.86 percent of the 2025 summary, and the countywide mean impervious value is only 0.27 percent. Areas above 50 percent impervious make up 0.04 percent. Those numbers describe a county with very little pavement and building cover compared with its total area, yet the impervious-surface map is not blank. A thin, warm-colored line crosses the upper part of the county, with a stronger cluster near the western side and a few smaller marks elsewhere.
Grassland covers nearly three quarters of the 2025 map
The broad county pattern becomes clear in the general land-cover map. Grassland is the dominant class at 74.93 percent. Agriculture follows at 22.33 percent, while developed land is 1.86 percent, wetlands are 0.59 percent, and shrubland is 0.25 percent. The forest summary is 0.00 percent. Together, the numbers and the map describe an eastern Colorado county where open cover is the rule and the other classes are concentrated in much smaller areas.
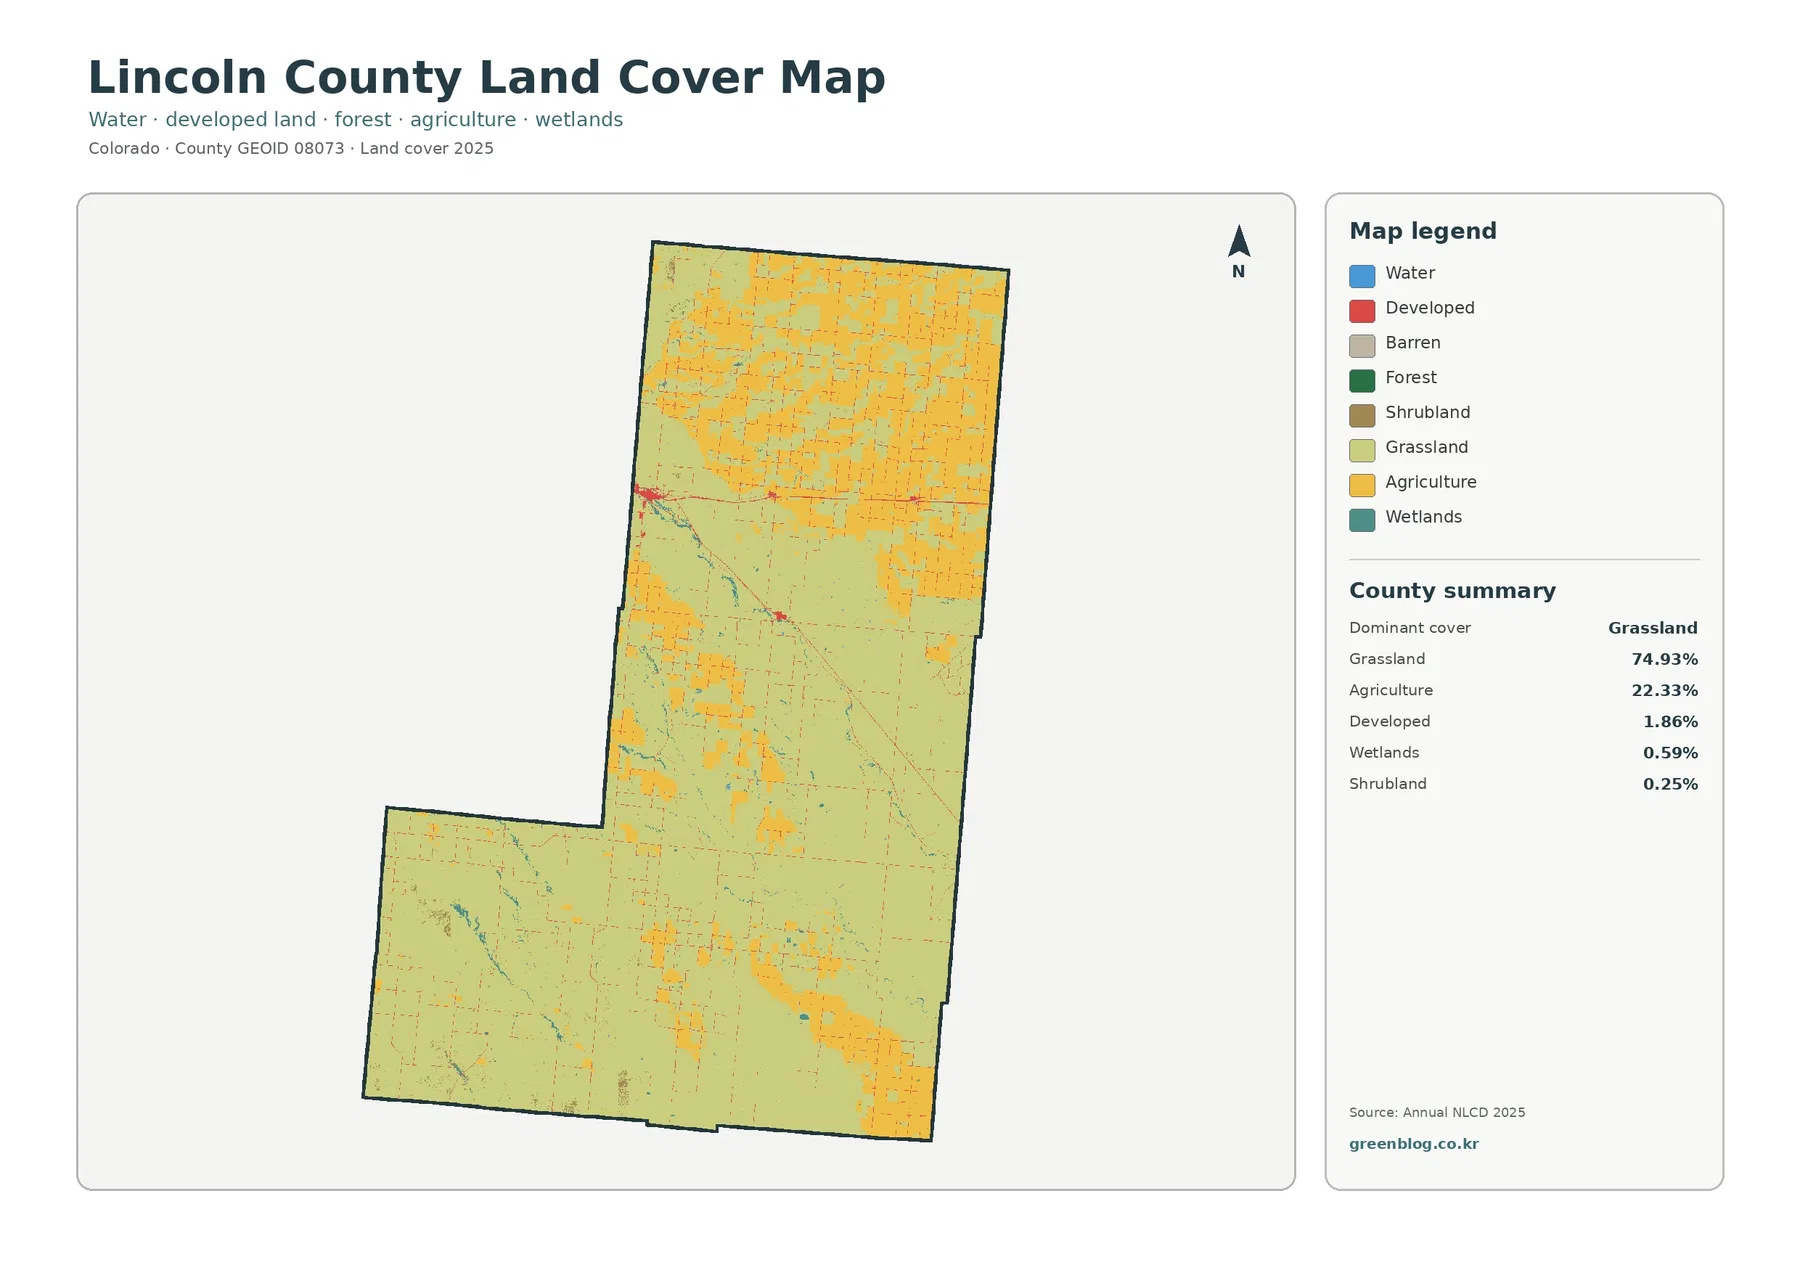
The spatial split is more informative than the percentages alone. Light-green grassland fills most of the central and southern county. Yellow agricultural blocks become denser in the north and appear as a patchwork rather than one continuous field. Smaller agricultural patches continue through the center and toward the southeast, but they are separated by much broader grassland areas. This makes the northern concentration one of the most county-specific features visible in the map.
The farm map turns the northern patchwork into the main story
The forest-and-farmland view removes some of the visual competition from the general map and makes cultivated land easier to trace. Agriculture remains 22.33 percent and grassland 74.93 percent, while forest is listed at 0.00 percent. The northern section contains many large yellow blocks separated by open grass or shrub-and-grass cover. South of that area, cultivated patches become more isolated and the open-cover background expands.
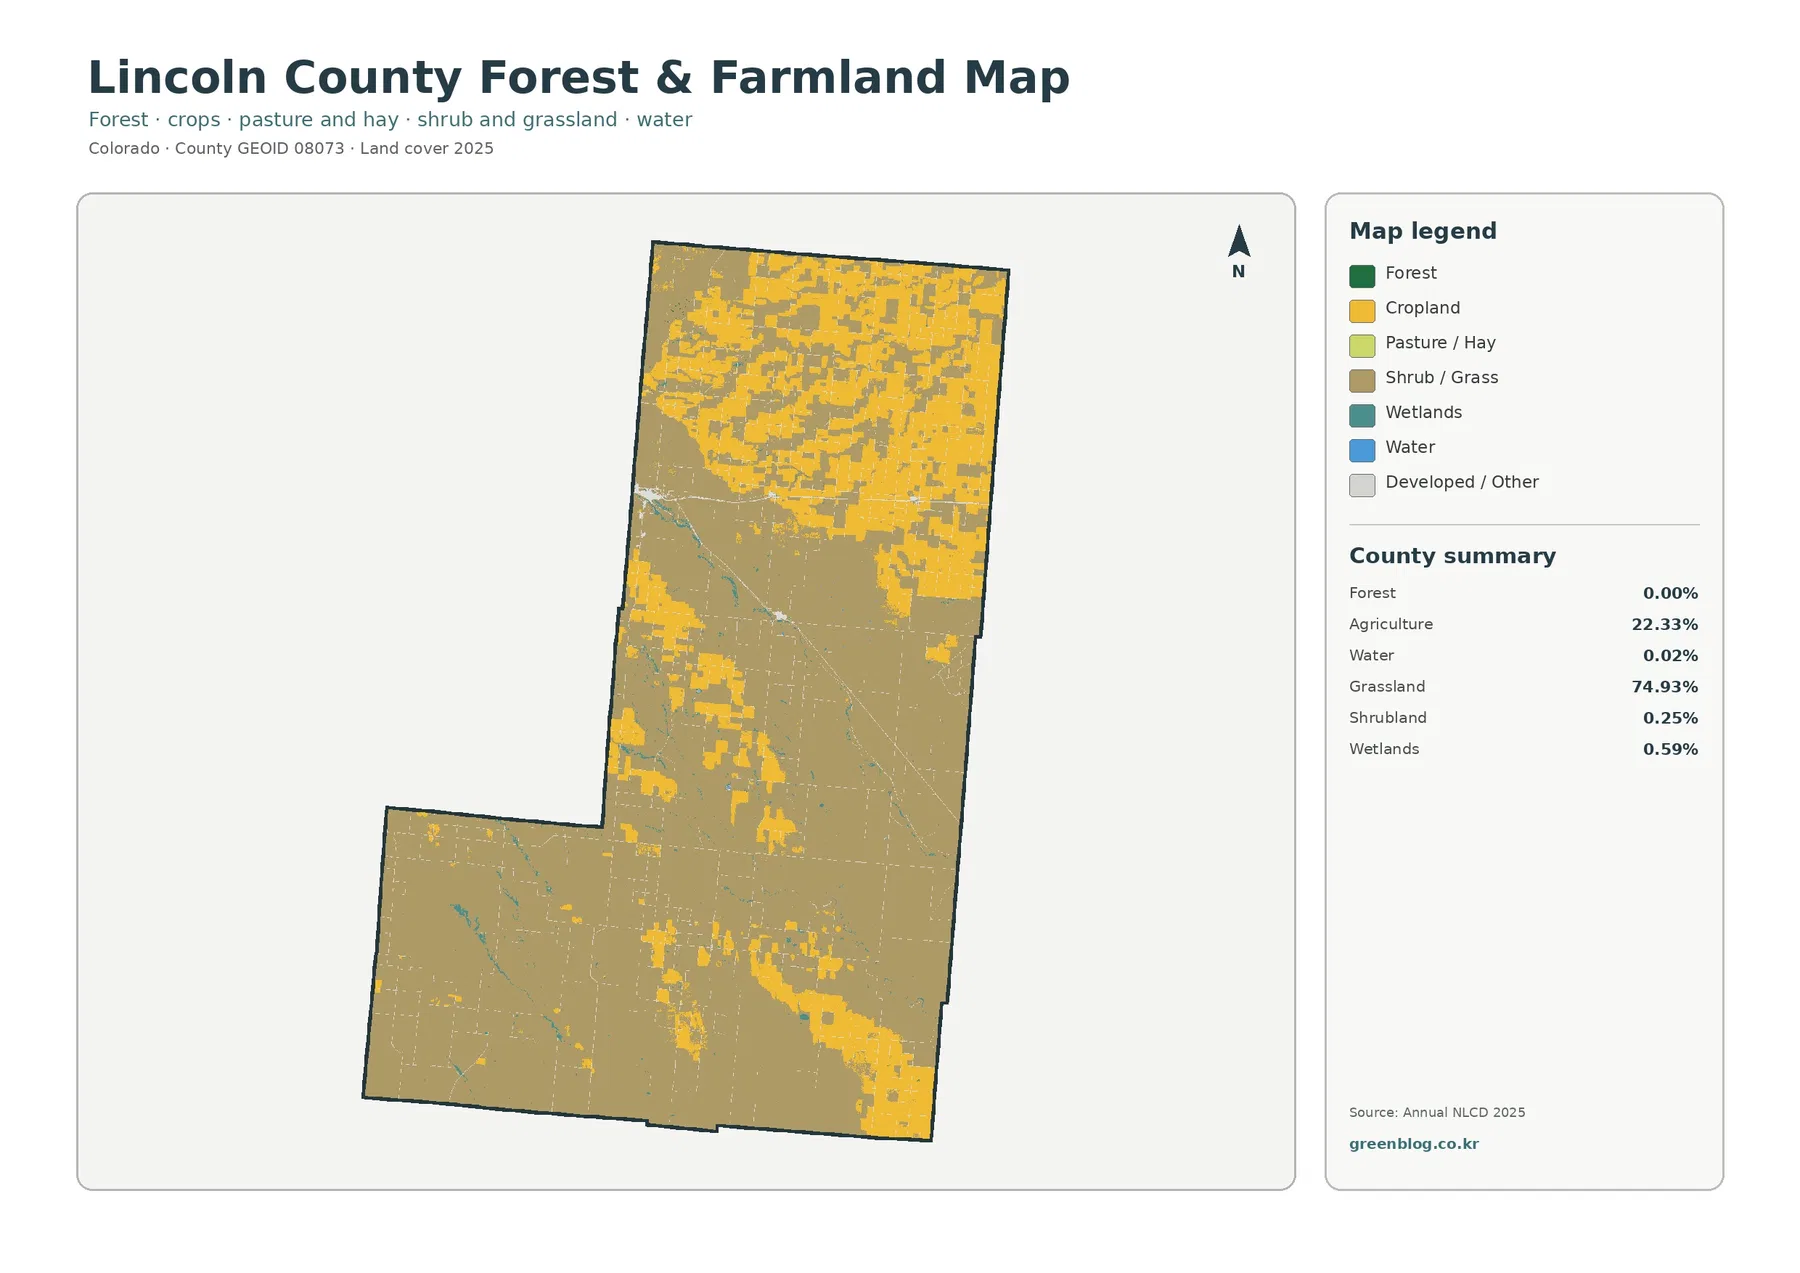
This map is especially helpful for avoiding a common misreading. Because agriculture is the second-largest class, it would be easy to imagine farm cover spread evenly across the county. The image shows otherwise. Northern blocks are frequent and often close together, while the center contains larger gaps of grassland and the southern part has fewer broad cultivated patches. The same countywide percentage therefore represents a strongly uneven geographic distribution.
A 0.00 percent forest summary does not mean there are literally no trees anywhere in Lincoln County. It means that the summarized 2025 classification does not contain a meaningful countywide area assigned to the forest class at the reported precision. Small shelterbelts, yard trees, or narrow wooded strips can be mixed with neighboring cover inside a 30-meter raster cell and may not appear as a separate forest patch. County totals are best used for broad comparison, not for locating every small group of trees.
The 1985–2025 comparison is driven mainly by agricultural-loss classification
The change map compares the mapped classes for 1985 and 2025. Lincoln County has class differences across 10.47 percent of its area. Agricultural loss is the largest named component at 7.25 percent. Areas classified as developed account for 0.46 percent, other class differences account for 2.65 percent, and forest loss is 0.00 percent. Most of the county remains uncolored in the difference view, while the changed cells occur in distinct clusters.
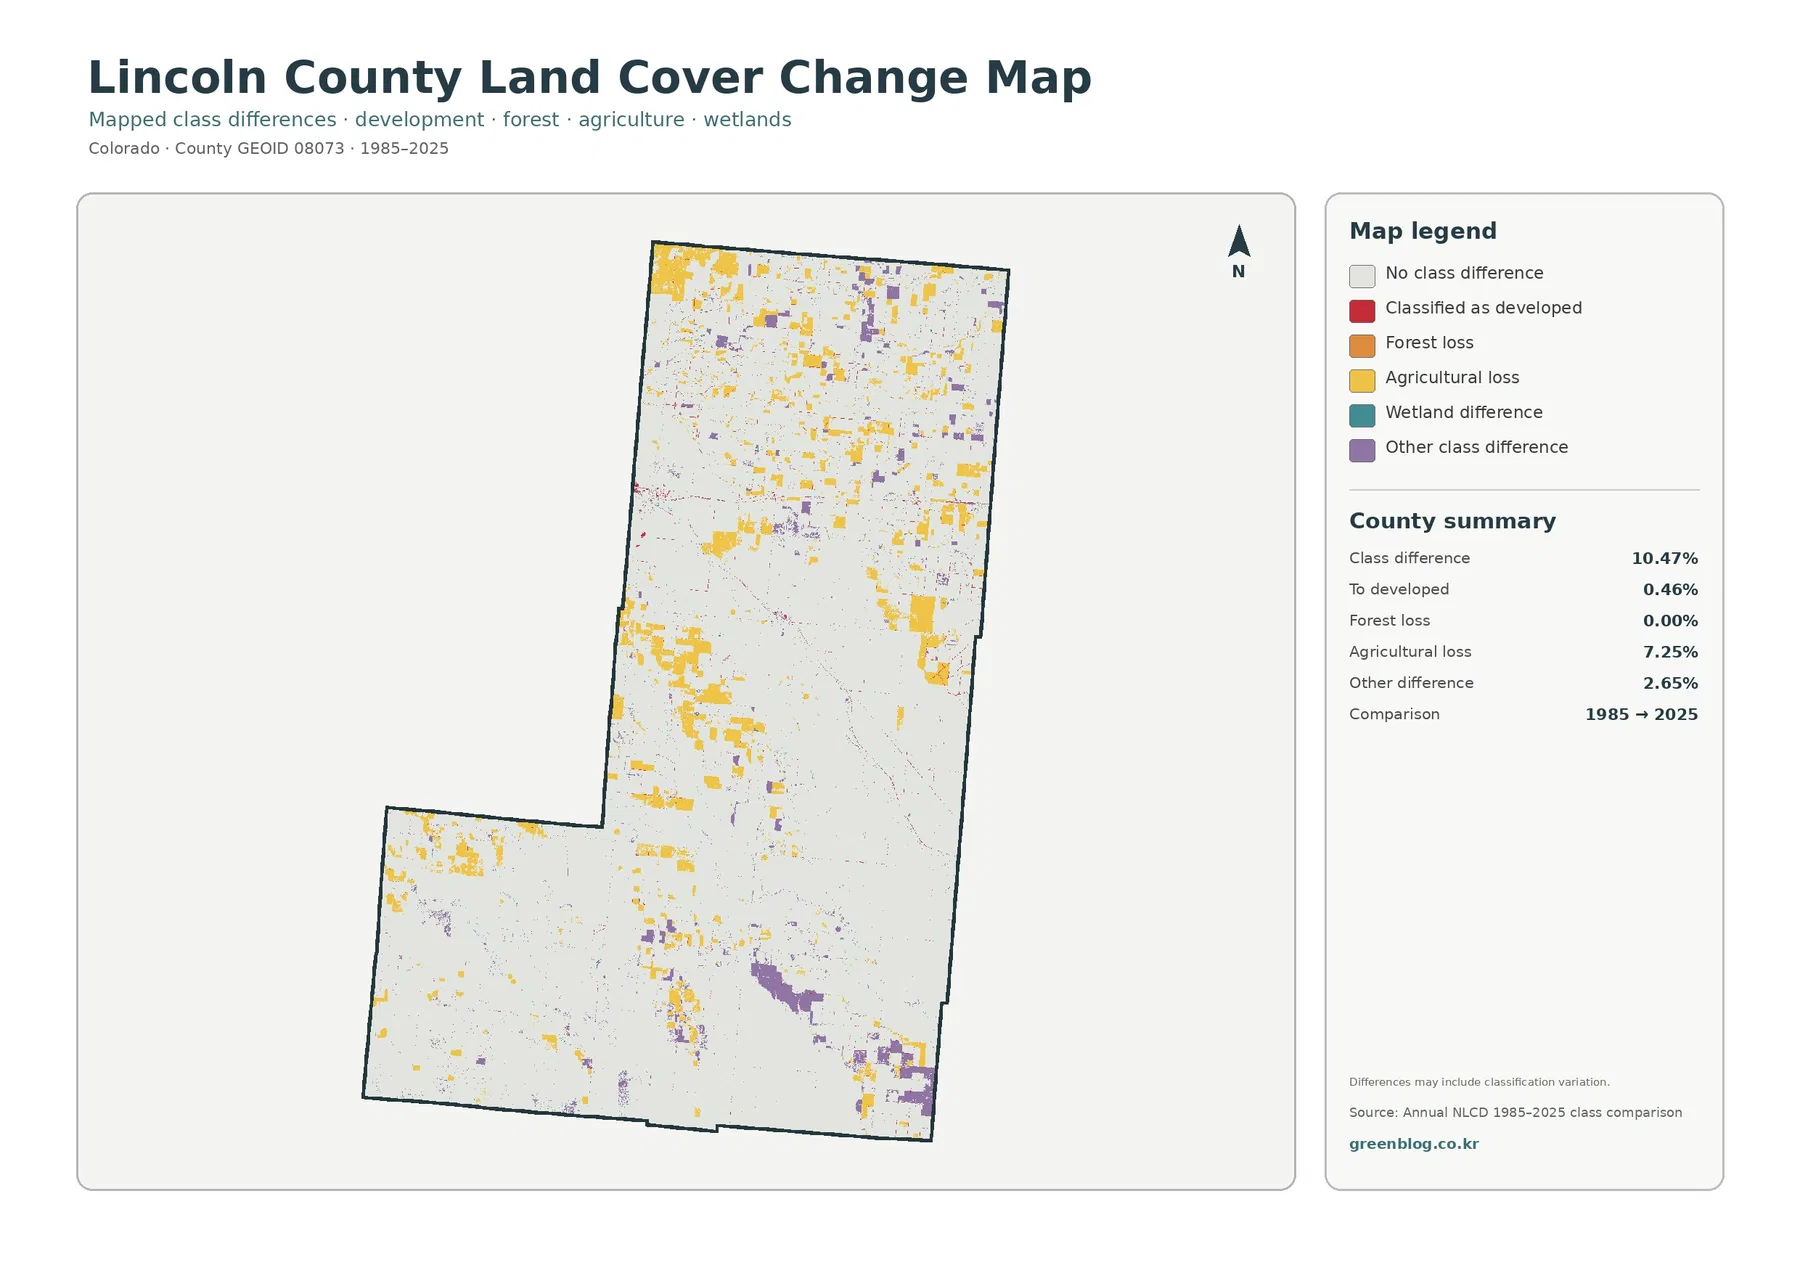
Yellow agricultural-loss cells are especially common in the northern section where cultivated land is prominent on the 2025 farm map. Other yellow patches appear farther south around scattered agricultural areas. Purple ‘other difference’ cells are more localized, including clusters in the north and southeast. Red cells classified as developed appear along parts of the upper developed line and at a small number of additional locations.
The 7.25 percent agricultural-loss figure is a classification result, not a direct statement that the county permanently lost exactly 7.25 percent of its working farmland. A cell can receive a different class because of a real land-cover transition, but crop rotation, fallow conditions, vegetation state, imagery, and classification uncertainty can also affect the comparison. The map is therefore a screening tool for places that deserve closer review, not a replacement for agricultural statistics or a year-by-year land-use history.
How to use all four maps without mixing their meanings
Start with the general map when the question is simply what covers Lincoln County in 2025. It establishes the dominant grassland background and the concentration of agriculture in the north. Move to the forest-and-farmland map when the exact location of cultivated patches matters. Because forest is essentially absent from the county summary, that second map becomes a clean comparison between agriculture and the open grass-and-shrub background rather than a forest-versus-farm story.
Saving the four JPG maps for side-by-side comparison
The download contains the four original JPG maps for Lincoln County: current land cover, forest and farmland, impervious/developed land, and the 1985–2025 land-cover change comparison. Because the county boundary is consistent across the set, the images can be placed side by side for reports, lessons, presentations, or reference work without having to realign four different extents.
Each source JPG in the supplied asset manifest is 2480×1754 pixels. The package marks that size as not meeting its A3 high-resolution reference. If the map will be enlarged for a large poster, check print sharpness at the intended size before final production. For screen viewing, ordinary document layouts, and moderate-size graphics, the original JPGs provide a more convenient working copy than the smaller WebP previews.
What the 30-meter classification can and cannot tell you
Annual NLCD is a raster product derived from Landsat imagery at 30-meter spatial resolution. In a raster, the landscape is divided into grid cells and each cell receives mapped values. A single cell can contain grass, a narrow road, a small building, and trees at the same time, so the displayed class is a generalized representation rather than a parcel survey. Mixed cells are one reason narrow or small features may look simplified.
The 2025 map is also a snapshot for that mapping year. Buildings, pavement, cultivation, or vegetation changes after the observation period will not appear. Likewise, the 1985–2025 difference map is not a legal record of when or why land use changed. For parcel-level decisions, current aerial imagery, county records, field observations, and the appropriate planning or resource agency should be consulted.
Frequently Asked Questions
What is the dominant land cover in Lincoln County, Colorado?
Grassland is the dominant 2025 class at 74.93 percent. Agriculture is second at 22.33 percent and is much more concentrated in the northern part of the county. Developed land, wetlands, shrubland, and water occupy much smaller shares.
Which map is best for finding the narrow developed corridor in the upper county?
The impervious-surface map is the clearest choice because it removes most of the broad grassland and agricultural colors and highlights paved or built surfaces. The general land-cover map is useful afterward for seeing how that corridor sits within the surrounding grassland and farm pattern.
Does the 7.25 percent agricultural-loss value mean working farmland fell by exactly that amount?
No. It means 7.25 percent of the county is categorized as agricultural loss in the 1985–2025 class comparison. The result can include real cover change, but classification differences and conditions in the source imagery can also matter. Agricultural statistics and additional years of imagery are needed to measure working farmland change directly.
Map File Information
This ZIP contains all four original JPG maps for Lincoln County, Colorado: current land cover, forest and farmland, impervious/developed land, and the 1985–2025 class-difference map.
- Included Files: Use only the versions confirmed in the article and supplied images
- File Type: Use the confirmed download contents
- Intended Use: Printing, education, presentations, and map-based projects
Related Maps
- Adams County Colorado Land Cover Map
- Alamosa County Colorado Land Cover Map
- Arapahoe County Colorado Land Cover Map
Sources and References
The following official and local sources provide the land-cover definitions, boundary data, spatial-resolution guidance, and county context used with these maps.
- MRLC Annual NLCD Data – access to Annual NLCD land-cover and related products
- USGS Annual NLCD Land Cover Classification – classification definitions and documentation
- USGS Annual NLCD spatial resolution – official explanation of the 30-meter raster resolution
- U.S. Census Bureau TIGER/Line Shapefiles – county boundary data
- Lincoln County, Colorado Official Website – county geography and local government information
- Lincoln County Tourism – local transportation and community context
Green Map creates custom-edited map images using open geographic data sources such as geoBoundaries, Natural Earth, OpenStreetMap, and government open data.
These maps are edited visual materials, not raw data files, and are provided for education, documents, presentations, and graphic reference.