Las Animas County spans a striking transition in southern Colorado: forested mountain country on the west gives way to broad grassland and shrub-covered plains across the center and east. The 2025 land-cover map is dominated by grassland, while forest forms a much smaller but concentrated western block. Developed land is limited and stands out most clearly around Trinidad. This page compares the current land-cover view with forest and farmland, impervious surface, and 1985–2025 change maps.
The maps can be viewed directly on the page, and the four original JPG files are available together in one ZIP below. Start with the broad mountain-to-plains contrast, then use the other views to isolate forest, cultivated land, paved surfaces, and places where the mapped class differs between 1985 and 2025.
Table of Contents
Grassland covers more than half of the county
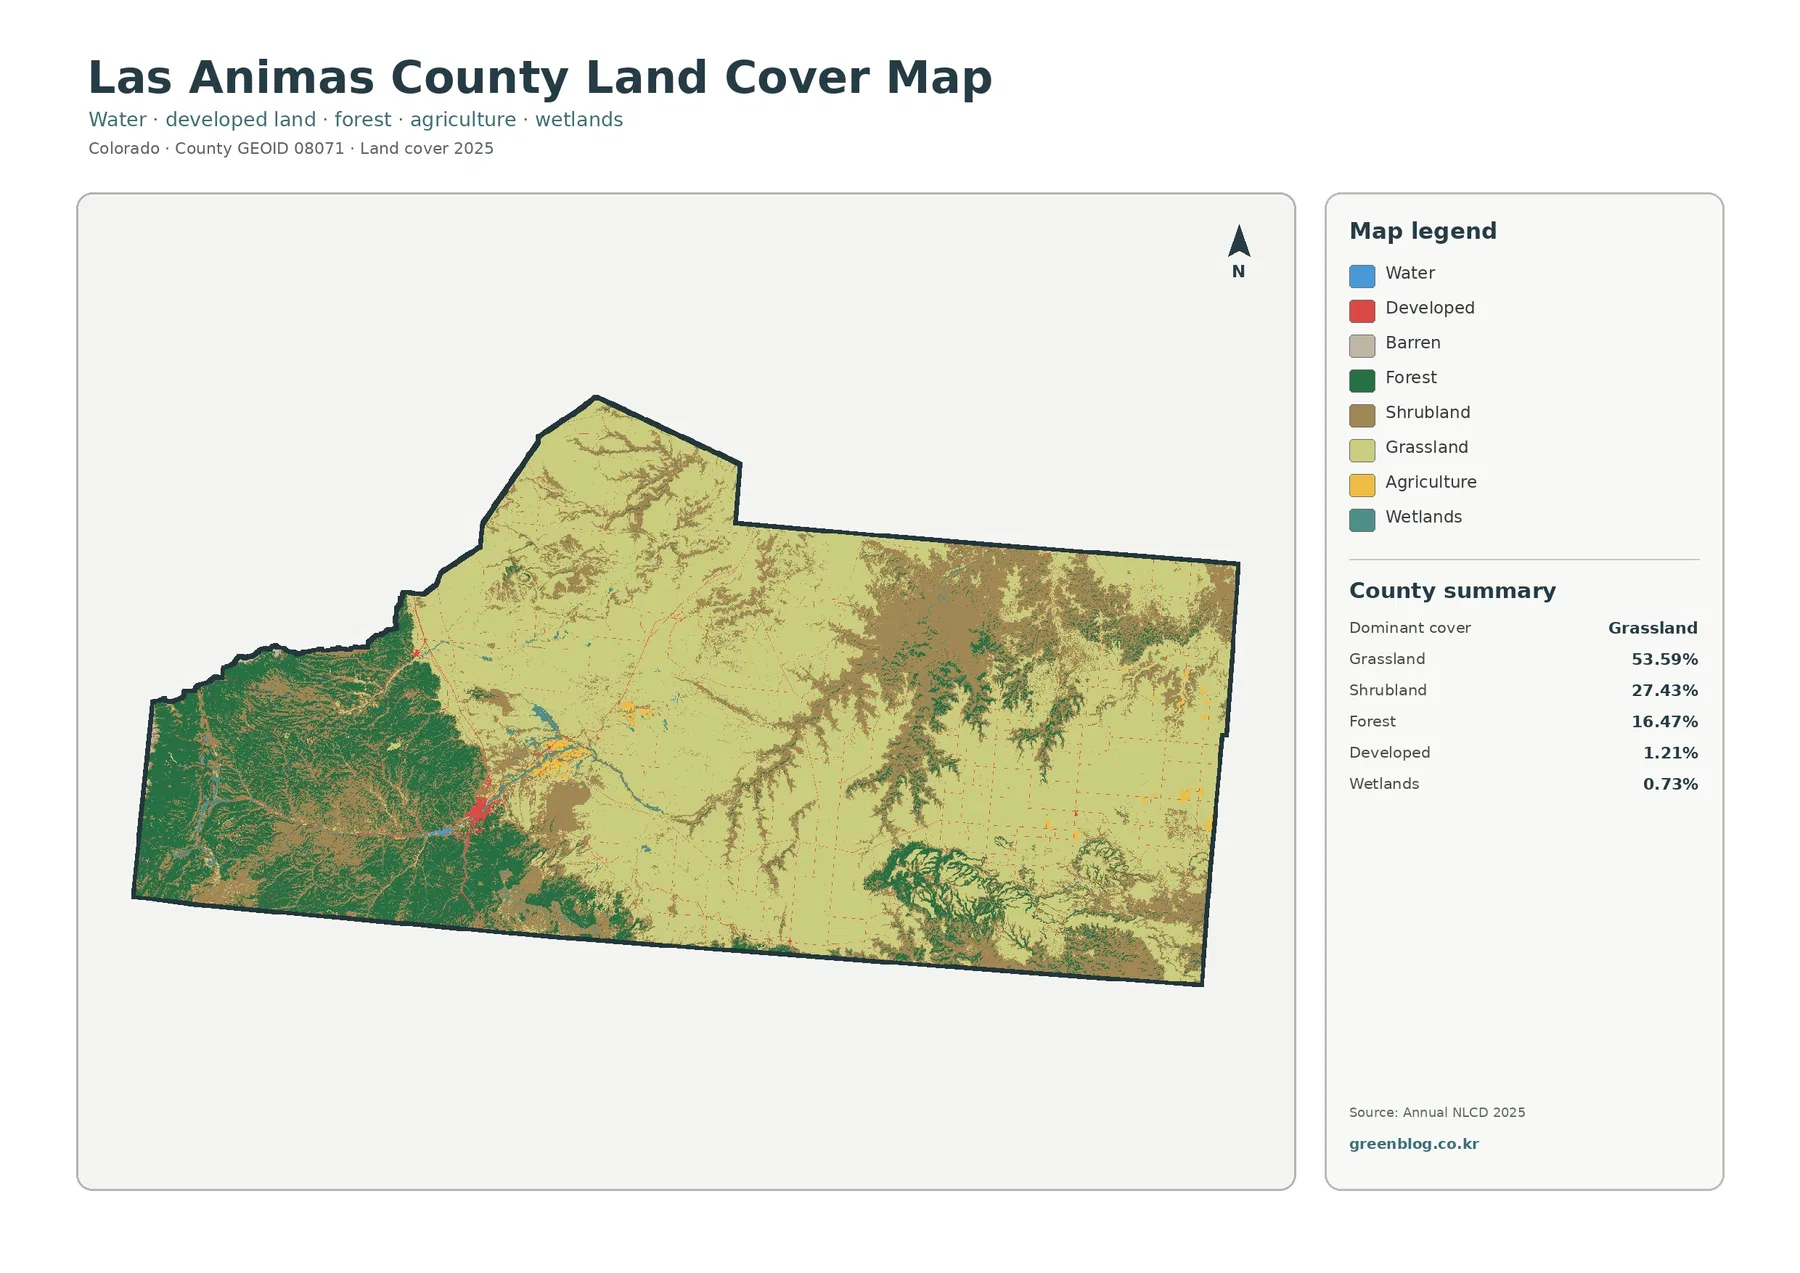
The 2025 summary identifies grassland as the dominant cover at 53.59 percent. Shrubland accounts for 27.43 percent and forest for 16.47 percent, so those three natural-cover groups make up almost all of the county. Developed cover is only 1.21 percent, while wetlands account for 0.73 percent. The percentages match the visual impression of the map: pale grassland occupies a very large central and eastern area, shrubland breaks that surface into irregular patches, and dark green forest is concentrated toward the west.
The western edge is the clearest exception to the grassland-dominated pattern. Forest forms a broad, connected mass there, with shrubland and grassland becoming more common as the terrain opens toward the center. Farther east, forest appears in smaller pockets rather than as a continuous belt. This west-to-east transition is more useful for understanding Las Animas County than treating the county as a single uniform landscape.
That mapped transition also fits official descriptions of the landscape near Trinidad. Colorado Parks and Wildlife describes Fishers Peak State Park as connecting grasslands on the east with foothills and mountains on the west. The countywide map extends that same basic contrast over a much larger area. Land cover, however, should not be confused with zoning, ownership, or legal land use. It describes the surface class assigned from satellite-based mapping, such as forest, grassland, water, or developed cover.
Trinidad is the clearest impervious-surface cluster
Impervious surface means pavement, rooftops, parking areas, and other hard surfaces that do not readily absorb water. Las Animas County has a mean impervious value of only 0.20 percent, and just 0.03 percent of the county is mapped at 50 percent impervious or greater. Developed cover is 1.21 percent. Those small countywide values make sense in a place where grassland, shrubland, and forest occupy such a large share of the land.
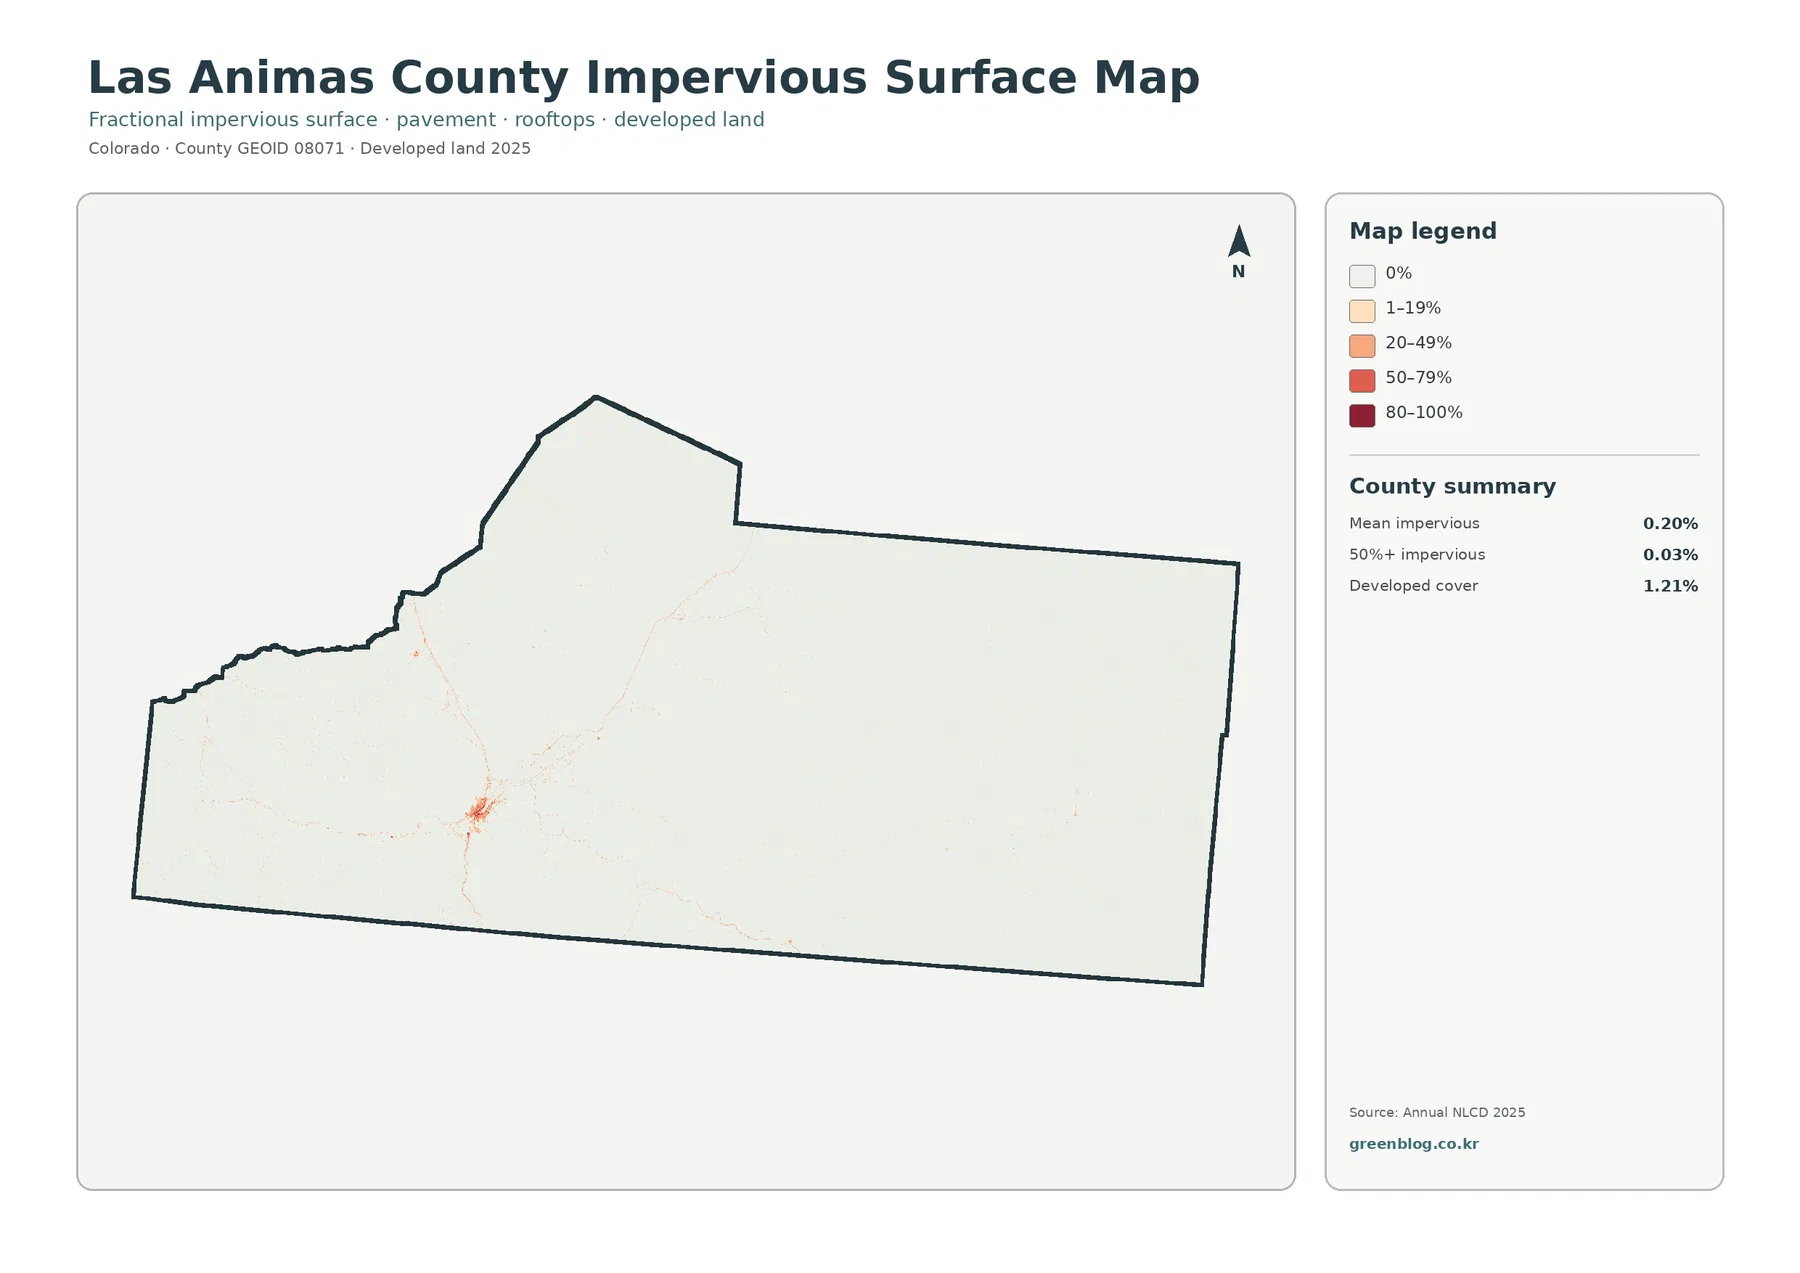
The map is nearly blank across most of the county, which makes the southwest development cluster especially easy to recognize. That cluster corresponds to Trinidad, the county seat; Colorado’s official county page lists the Las Animas County government address in Trinidad. Thin orange and red traces extend from the main cluster in several directions, while a few isolated spots appear elsewhere. These narrow patterns are difficult to distinguish on the general land-cover map but become obvious when the map is limited to impervious intensity.
The impervious map is best used to describe concentration, not causation. Roads and developed areas often occupy the same corridors, but the image alone does not show that a particular road caused development or that one project created a change in impervious cover. A planning document, permit record, or dated imagery series would be needed to support that kind of claim. Here, the safe conclusion is simply that paved and built surfaces are concentrated around Trinidad and along a small number of narrow corridors.
A closer look at forest, open range, and sparse agriculture
The forest-and-farmland view simplifies the developed classes and makes the relationship among forest, cropland, pasture or hay, shrub and grass cover, wetlands, and water easier to see. Forest remains 16.47 percent and is heavily weighted toward the west. Grassland at 53.59 percent and shrubland at 27.43 percent spread through most of the central and eastern county. Small forest patches also appear away from the main western block, but they do not change the overall dominance of open cover.
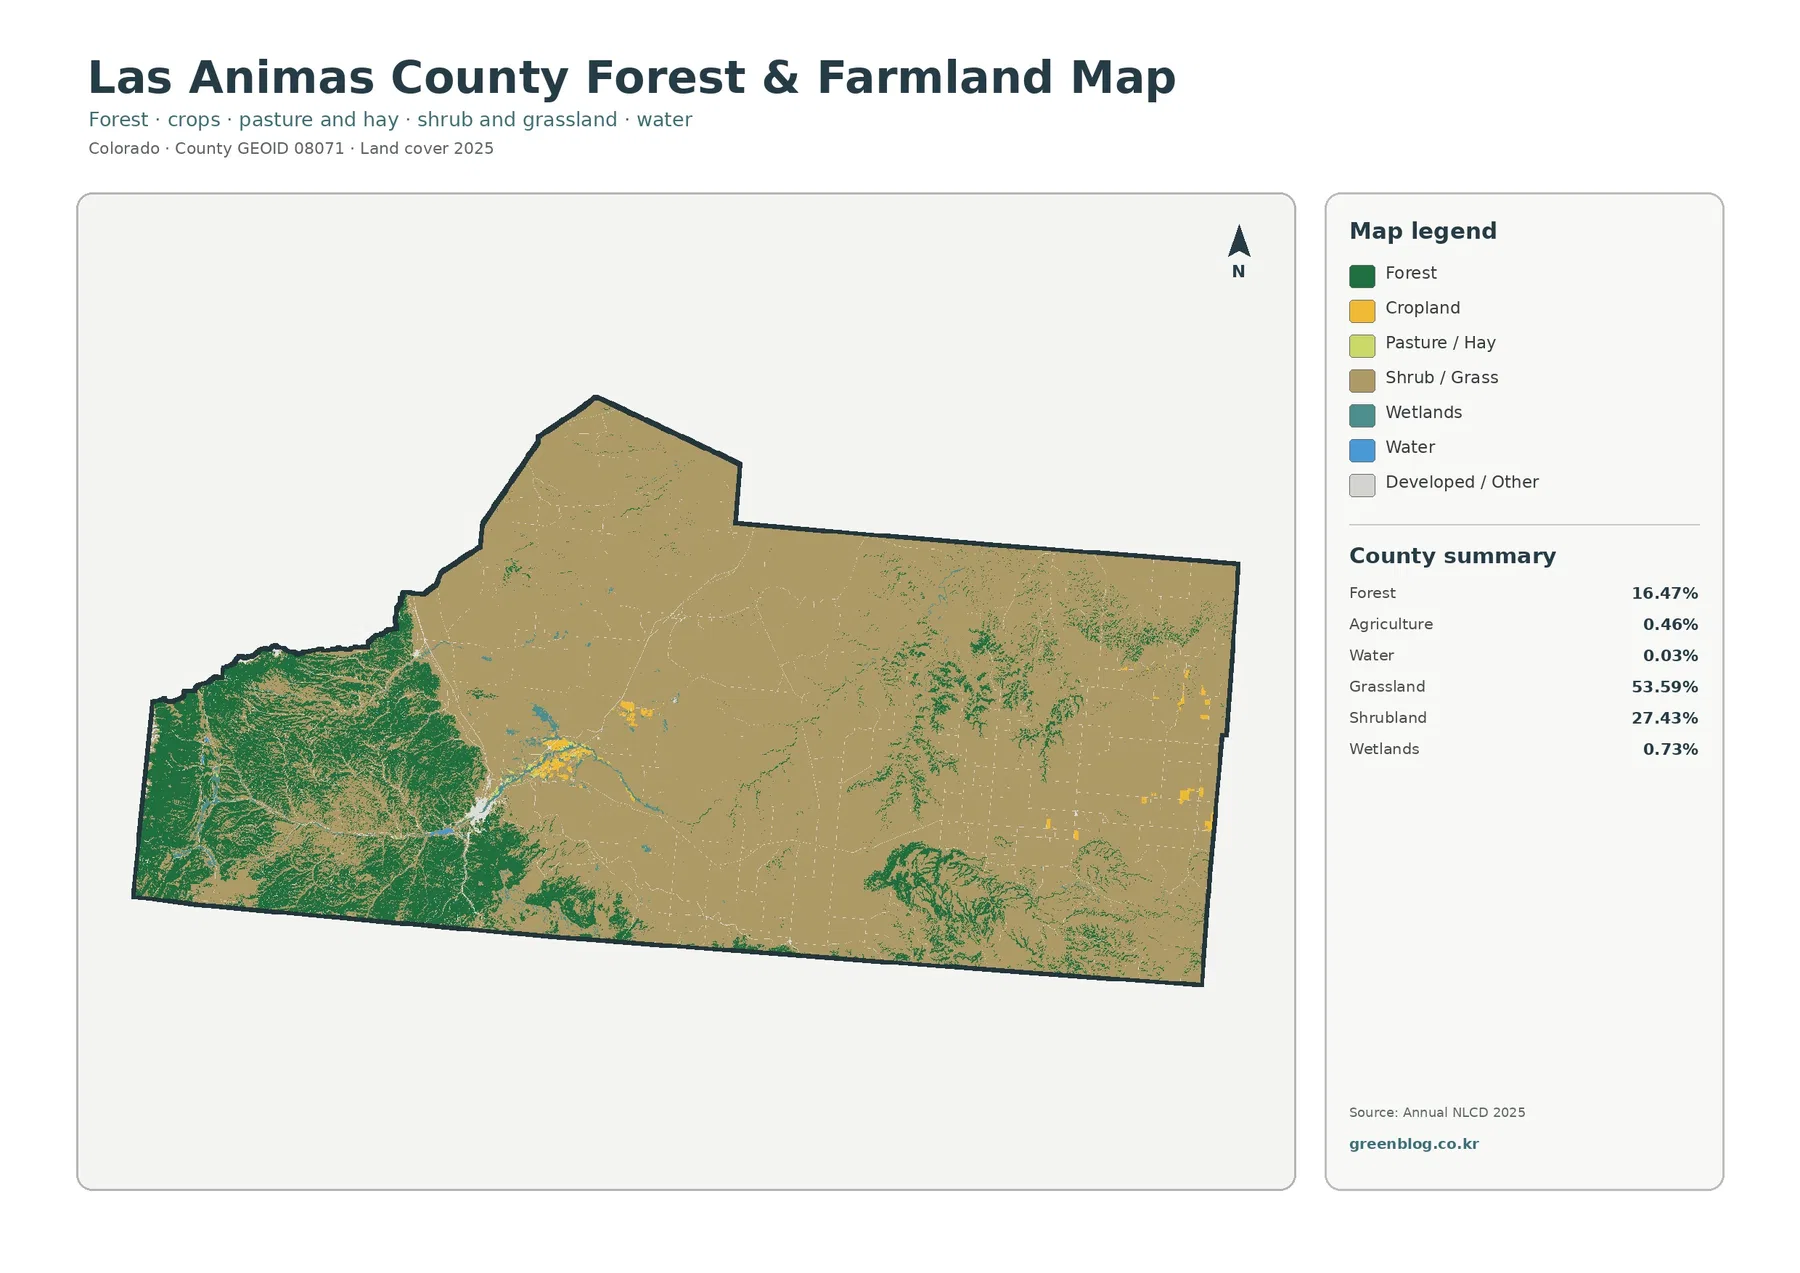
Agriculture is only 0.46 percent in this summary. The yellow cultivated areas appear as small scattered pieces rather than the large rectangular blocks common in heavily farmed plains counties. Some are visible in central and eastern parts of the county, with additional small pieces near the developed area around Trinidad. The pattern matters because a broad grass-colored plain can easily be mistaken for farmland at a glance; here, most of that open surface is classified as grassland or shrubland instead.
Water is just 0.03 percent and wetlands are 0.73 percent, so blue and teal occupy very little of the county. They are still useful location markers. Trinidad Lake is a verified local water feature near Trinidad, and Colorado Parks and Wildlife maintains Trinidad Lake State Park around the reservoir. Small water areas on the map should be read as mapped surface water, not as information about depth, water quality, streamflow, or recreation rules.
Mapped class differences remain limited from 1985 to 2025
The long-term change map compares the class assigned to each location in 1985 with its class in 2025. A total of 7.59 percent of the county is marked as having some class difference. Areas classified as changing to developed account for 0.39 percent, forest loss for 1.60 percent, agricultural loss for 0.85 percent, and other class differences for 4.69 percent. Because most of the county remains white on this map, the colored areas appear scattered rather than forming a continuous change belt.
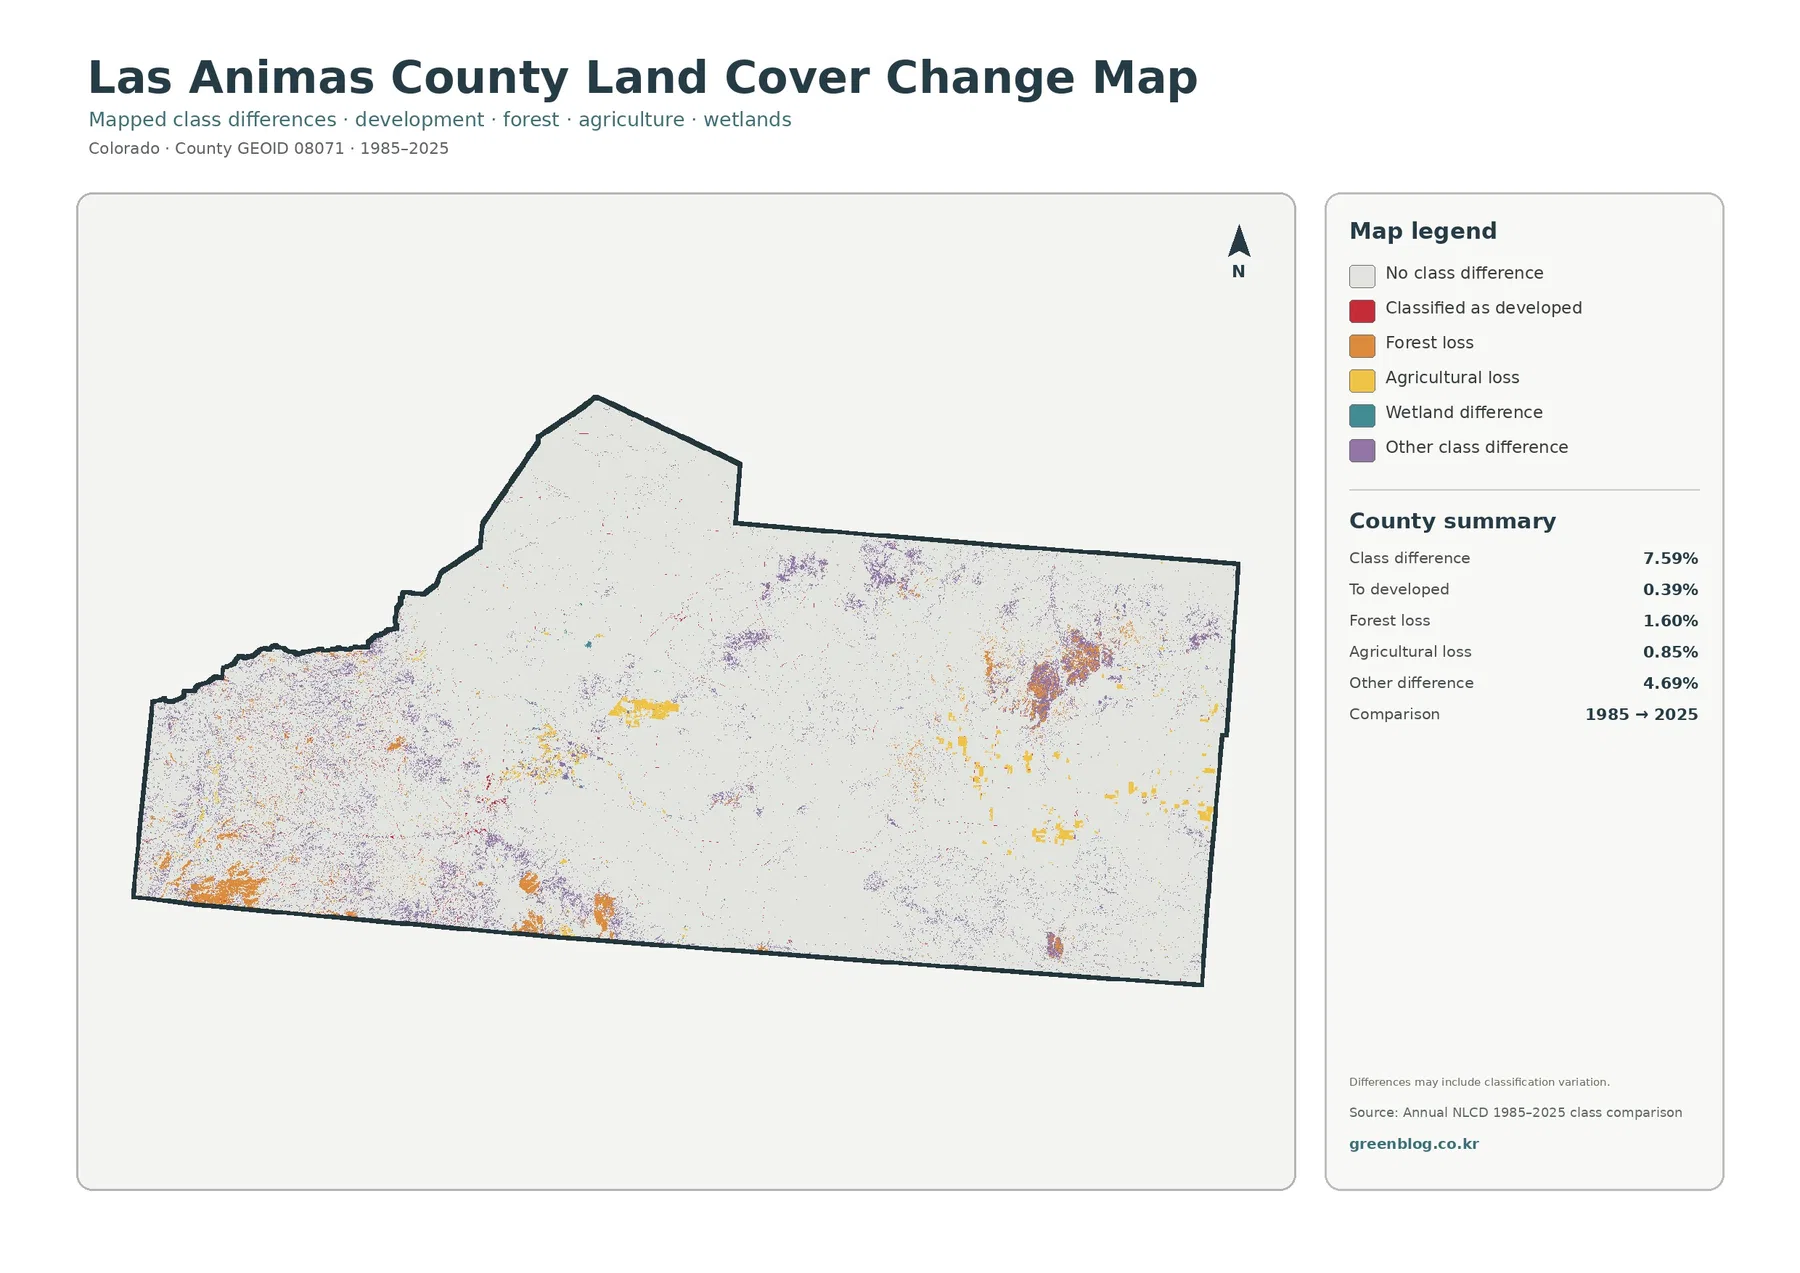
Several types of change are visible in different parts of the county. Orange forest-loss marks occur within parts of the western and southwestern forested landscape. Purple other-difference areas are scattered more broadly through the central and eastern county, with some stronger patches in the east. Red developed-change marks are small and include locations near the Trinidad area. Yellow agricultural-loss marks occur as isolated patches rather than broad continuous zones, which is consistent with the very small share of land currently mapped as agriculture.
A colored pixel on the change map does not automatically document a permanent on-the-ground event. The map itself notes that class differences can include classification variation. Satellite conditions, vegetation state, model uncertainty, and real land-cover change can all contribute to a different class between two years. Forest loss of 1.60 percent, for example, should be treated as a location to investigate rather than proof of a particular fire, harvest, or development event.
Small percentages that still matter on this map
Grassland at 53.59 percent naturally receives most of the attention, but several small categories help explain the county more precisely. Developed land at 1.21 percent identifies a compact settlement pattern rather than a broad urban belt. The 0.20 percent mean impervious value reinforces how little of the county surface is paved when averaged over the full county. Agriculture at 0.46 percent shows that the open eastern landscape is not primarily cropland, despite its broad, relatively open appearance.
Wetlands at 0.73 percent and water at 0.03 percent are also better read by location than by area alone. The same principle applies to the 7.59 percent class-difference figure. The most useful question is not simply whether that number is high or low, but where each change category occurs relative to current forest, grassland, shrubland, and developed cover. Combining percentages with mapped location prevents a small countywide value from hiding an important local cluster.
Using the four views to follow the mountain-to-plains transition
Each map is most useful when it answers a different part of the same geographic question. The general land-cover map establishes the broad pattern: forest in the west, extensive grassland through the center and east, and widespread shrubland between and within those areas. The forest-and-farmland map then removes some visual competition from developed classes, making it easier to see how little of the open eastern landscape is actually classified as cultivated agriculture.
For settlement patterns, the impervious map is more revealing. A developed share of 1.21 percent can look insignificant in a countywide statistic, yet the hard-surface layer clearly identifies Trinidad as the major concentration. The change map adds a time comparison without replacing the current-state map. Looking first at a colored change location and then returning to the 2025 land-cover map helps separate the question “what is there now?” from “where did the mapped class differ between the two dates?”
This sequence is also useful for teaching and presentations. A viewer can begin with the simple contrast between mountains and plains, move to the more detailed forest and agriculture view, isolate human-built surfaces, and finish with a long-term comparison. Official Fishers Peak information provides a concrete local example of grassland meeting foothills and mountains near Trinidad, while the county map shows how that transition continues across a much larger landscape.
Downloading and comparing the original JPG maps
If you need the maps outside the webpage, the ZIP below contains all four original JPG files: the general land-cover map, forest-and-farmland map, impervious/developed-land map, and land-cover-change map. Keeping the four files together makes it easier to compare the same county boundary in a document, classroom handout, presentation, or reference folder. Each source JPG is 2480 × 1754 pixels. The package does not mark these files as meeting its A3 high-resolution reference, so large-format printing should be tested before final use.
Why the 30-meter classes are not parcel boundaries
Annual NLCD is raster based and derived from Landsat imagery at a 30-meter spatial resolution. A raster divides the landscape into cells and assigns a representative value to each cell. A single cell can contain more than one real surface, such as grass beside a road or trees around a small building. That mixed-pixel effect is one reason a colored boundary on these maps should not be expected to match a fence, parcel line, vegetation edge, or legal boundary on the ground.
Date also matters. The current maps represent 2025 classification, while the change layer compares 1985 with 2025. Construction, fire effects, vegetation recovery, agricultural changes, or other surface changes after the 2025 observation period will not appear here. The maps are useful for county-scale comparison and screening, but they are not a survey and should not be used to decide ownership, zoning, building eligibility, or conditions on an individual property.
Frequently Asked Questions
What is the dominant land cover in Las Animas County?
Grassland is the largest 2025 category at 53.59 percent. Shrubland follows at 27.43 percent and forest at 16.47 percent. Forest is concentrated mainly in the west, while grassland and shrubland occupy most of the central and eastern county.
Which map best shows development around Trinidad?
Use the general land-cover map when you want to compare Trinidad with surrounding grassland, shrubland, and forest. Use the impervious-surface map when the main question is where pavement, rooftops, and other hard surfaces are concentrated; the Trinidad area is the clearest cluster on that map.
Does the 7.59% change figure mean that all of that land physically changed?
No. It represents locations where the mapped class differs between 1985 and 2025. The difference may reflect real surface change, but classification variation can also contribute. Dated aerial imagery, fire records, planning documents, or field information are needed to determine what happened at a specific location.
Map File Information
This ZIP contains the four original JPG maps for Las Animas County: current land cover, forest and farmland, impervious/developed land, and the 1985–2025 land-cover comparison.
- Included Files: Use only the versions confirmed in the article and supplied images
- File Type: Use the confirmed download contents
- Intended Use: Printing, education, presentations, and map-based projects
Related Maps
- Adams County Colorado Land Cover Map
- Alamosa County Colorado Land Cover Map
- Arapahoe County Colorado Land Cover Map
Sources and References
These official sources provide additional information about the dataset, county boundary, and local landscape used to interpret the maps.
- MRLC Annual NLCD – Annual NLCD products and data access, including the 1985–2025 series
- USGS Annual NLCD spatial resolution – official explanation of the 30-meter raster resolution
- U.S. Census Bureau TIGER/Line Shapefiles – county boundary data
- Colorado Parks and Wildlife – Fishers Peak State Park – official description of grasslands, foothills, mountains, and the Trinidad-area landscape
- Colorado.gov – Las Animas County – official county information confirming the county government location in Trinidad
Green Map creates custom-edited map images using open geographic data sources such as geoBoundaries, Natural Earth, OpenStreetMap, and government open data.
These maps are edited visual materials, not raw data files, and are provided for education, documents, presentations, and graphic reference.