La Plata County in southwestern Colorado has a land-cover pattern shaped far more by forest and shrubland than by urban or agricultural cover. Forest accounts for 49.28% of the 2025 summary and shrubland adds 33.05%, while farming and developed land occupy much smaller but clearly defined areas around valleys, towns, and transportation routes. The four maps here separate those patterns into current land cover, forest and farmland, impervious surface, and mapped class differences from 1985 to 2025.
The four original JPG maps are available together in one download near the end of the page. They work well as a printable county reference, for comparing Durango with the more heavily forested parts of the county, or for examining where agricultural cover, hard surfaces, water, wetlands, and long-term classification differences appear.
Table of Contents
Forest and shrubland define most of the county
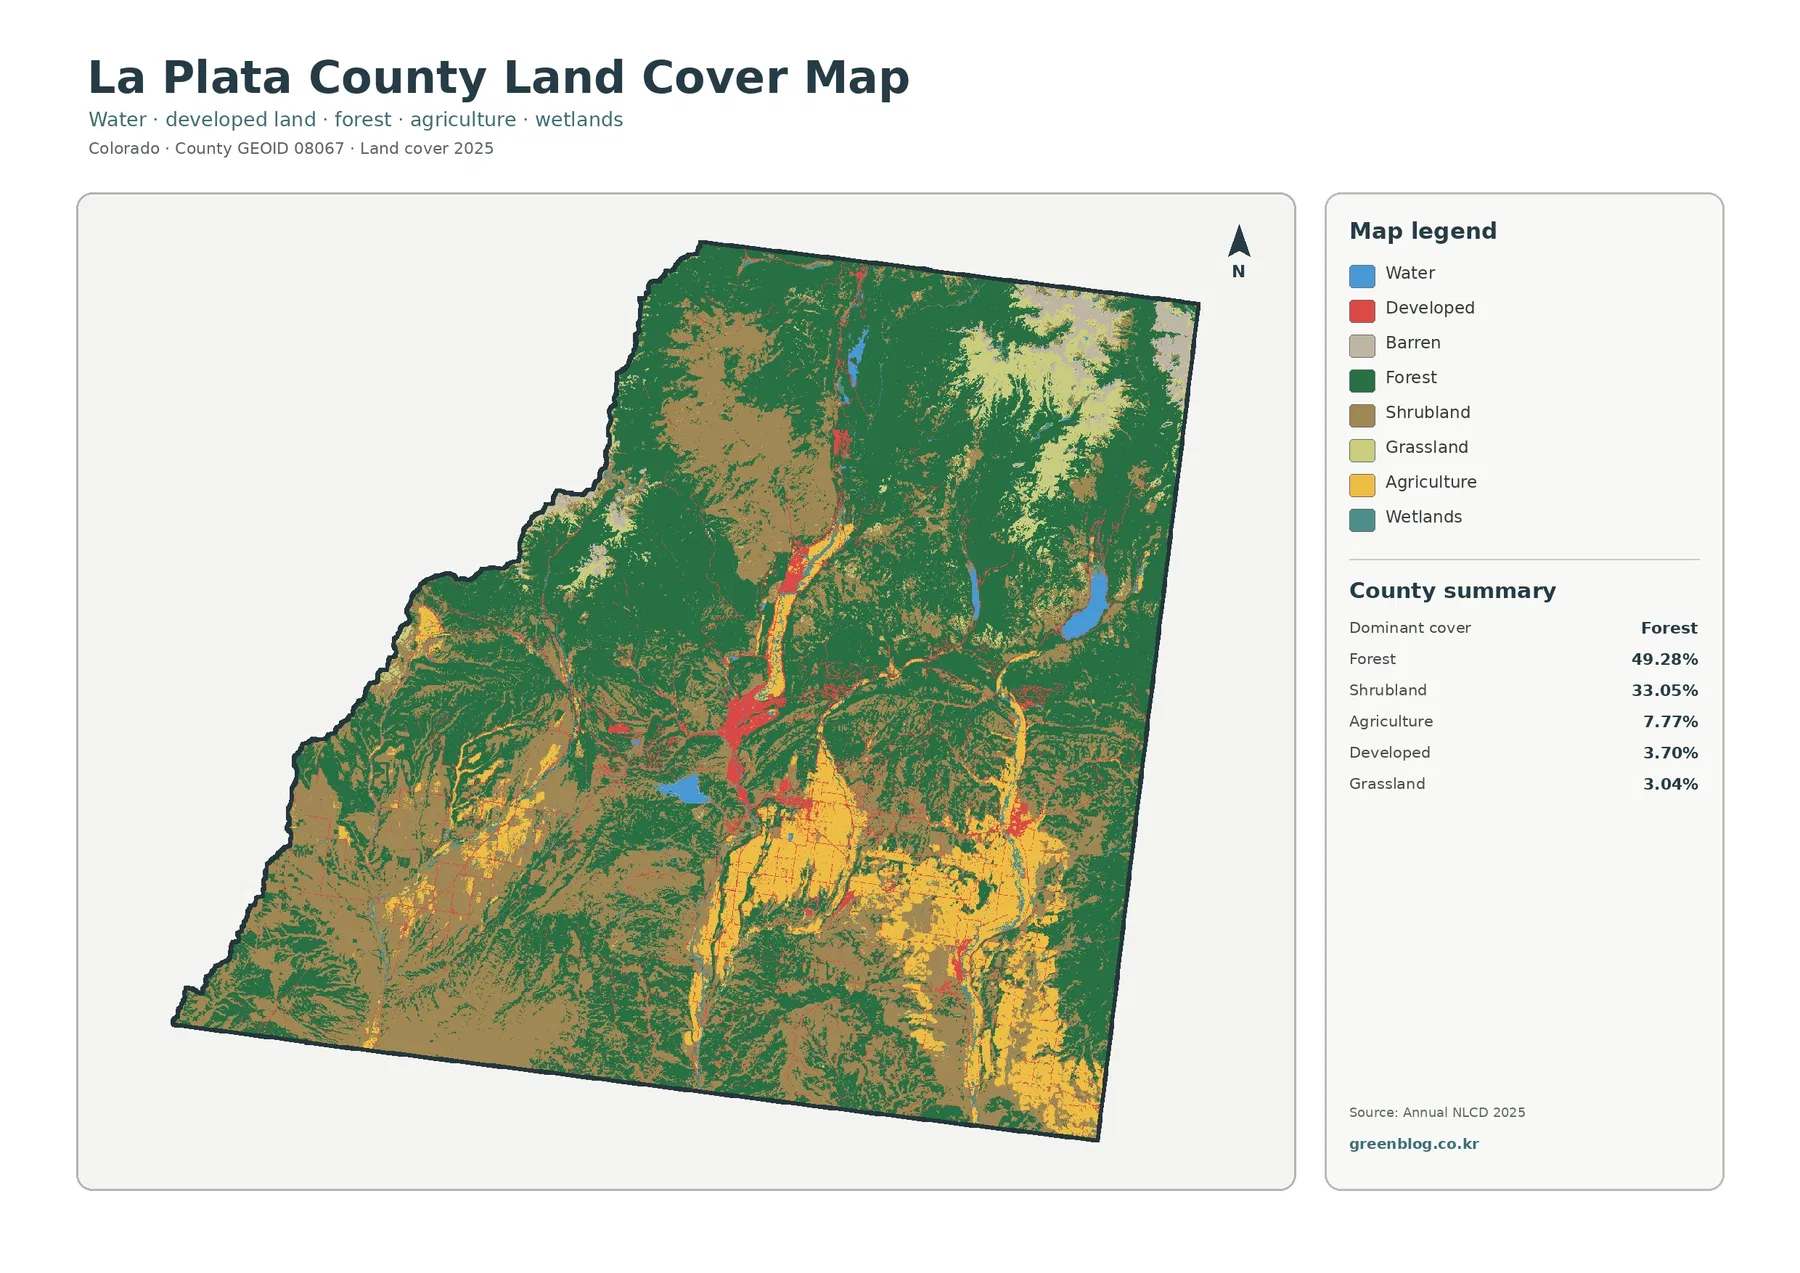
The 2025 land-cover summary is dominated by two classes. Forest covers 49.28% of La Plata County and shrubland covers 33.05%. Together they account for well over four-fifths of the mapped area. That balance is immediately visible on the general map: dark green forest occupies broad northern, northeastern, central, and eastern sections, while brown shrubland becomes more extensive toward the west and southwest and fills many openings between forested areas.
The forest is not one unbroken block. Large dark-green areas are interrupted by shrubland, grass, agriculture, water, and developed corridors. In the northern part of the county, forest forms broad continuous patches, while the southwestern portion contains much more shrub-dominated terrain. The transition between the two is irregular, which makes the county look very different from a flat agricultural county where rectangular fields or a street grid control most of the visual pattern.
Agriculture accounts for 7.77% of the 2025 map, grassland for 3.04%, and developed cover for 3.70%. Those percentages are modest, but their locations matter. Agricultural colors become more noticeable in the southern and southeastern parts of the county and in open valley settings. Developed cover forms compact clusters and narrow corridors around populated places instead of spreading evenly across the mountain and shrubland landscape.
Land cover should not be confused with zoning or ownership. These classes describe what the ground surface was classified as in the source imagery and data. A forest cell does not indicate who owns the land, and an agricultural cell does not identify a crop, parcel boundary, or legal land-use designation. The map is best used to understand broad surface patterns before turning to parcel, zoning, or permitting records for legal questions.
Durango forms the strongest developed concentration
Developed land represents 3.70% of the county, but the red class is easy to pick out because most of the surrounding land is forest, shrubland, or agriculture. The strongest cluster sits around Durango in the central part of the county. Narrow developed traces extend north and south from that area, and smaller concentrations appear farther east and southeast around other settled places. The result is a network of compact nodes and connecting routes rather than a broad urban blanket.
County records identify Durango, Bayfield, and Ignacio as municipalities within La Plata County. That local context helps interpret the separate red concentrations visible on the map. Durango stands out as the largest cluster, while smaller developed areas to the east and southeast sit within landscapes that quickly return to forest, shrubland, grass, or agriculture. The map therefore provides a useful countywide view of how sharply built areas contrast with the surrounding natural cover.
The pattern should be described as an association, not a cause-and-effect conclusion. Roads and developed surfaces often appear along the same corridors, but the map does not explain why development occurred in a particular place. It simply shows where the classifications are concentrated. Planning history, transportation projects, utilities, topography, and land policy would need separate sources if the goal were to explain the causes of growth.
The current map is also not a municipal boundary map. A developed pixel can occur outside an incorporated town, and an incorporated area can include parks, vegetation, bare ground, or other surfaces. For questions about jurisdiction, subdivision, or allowable development, readers should use official county and municipal planning records rather than treating the red land-cover class as a legal boundary.
The forest-and-farmland view brings the southern open areas forward
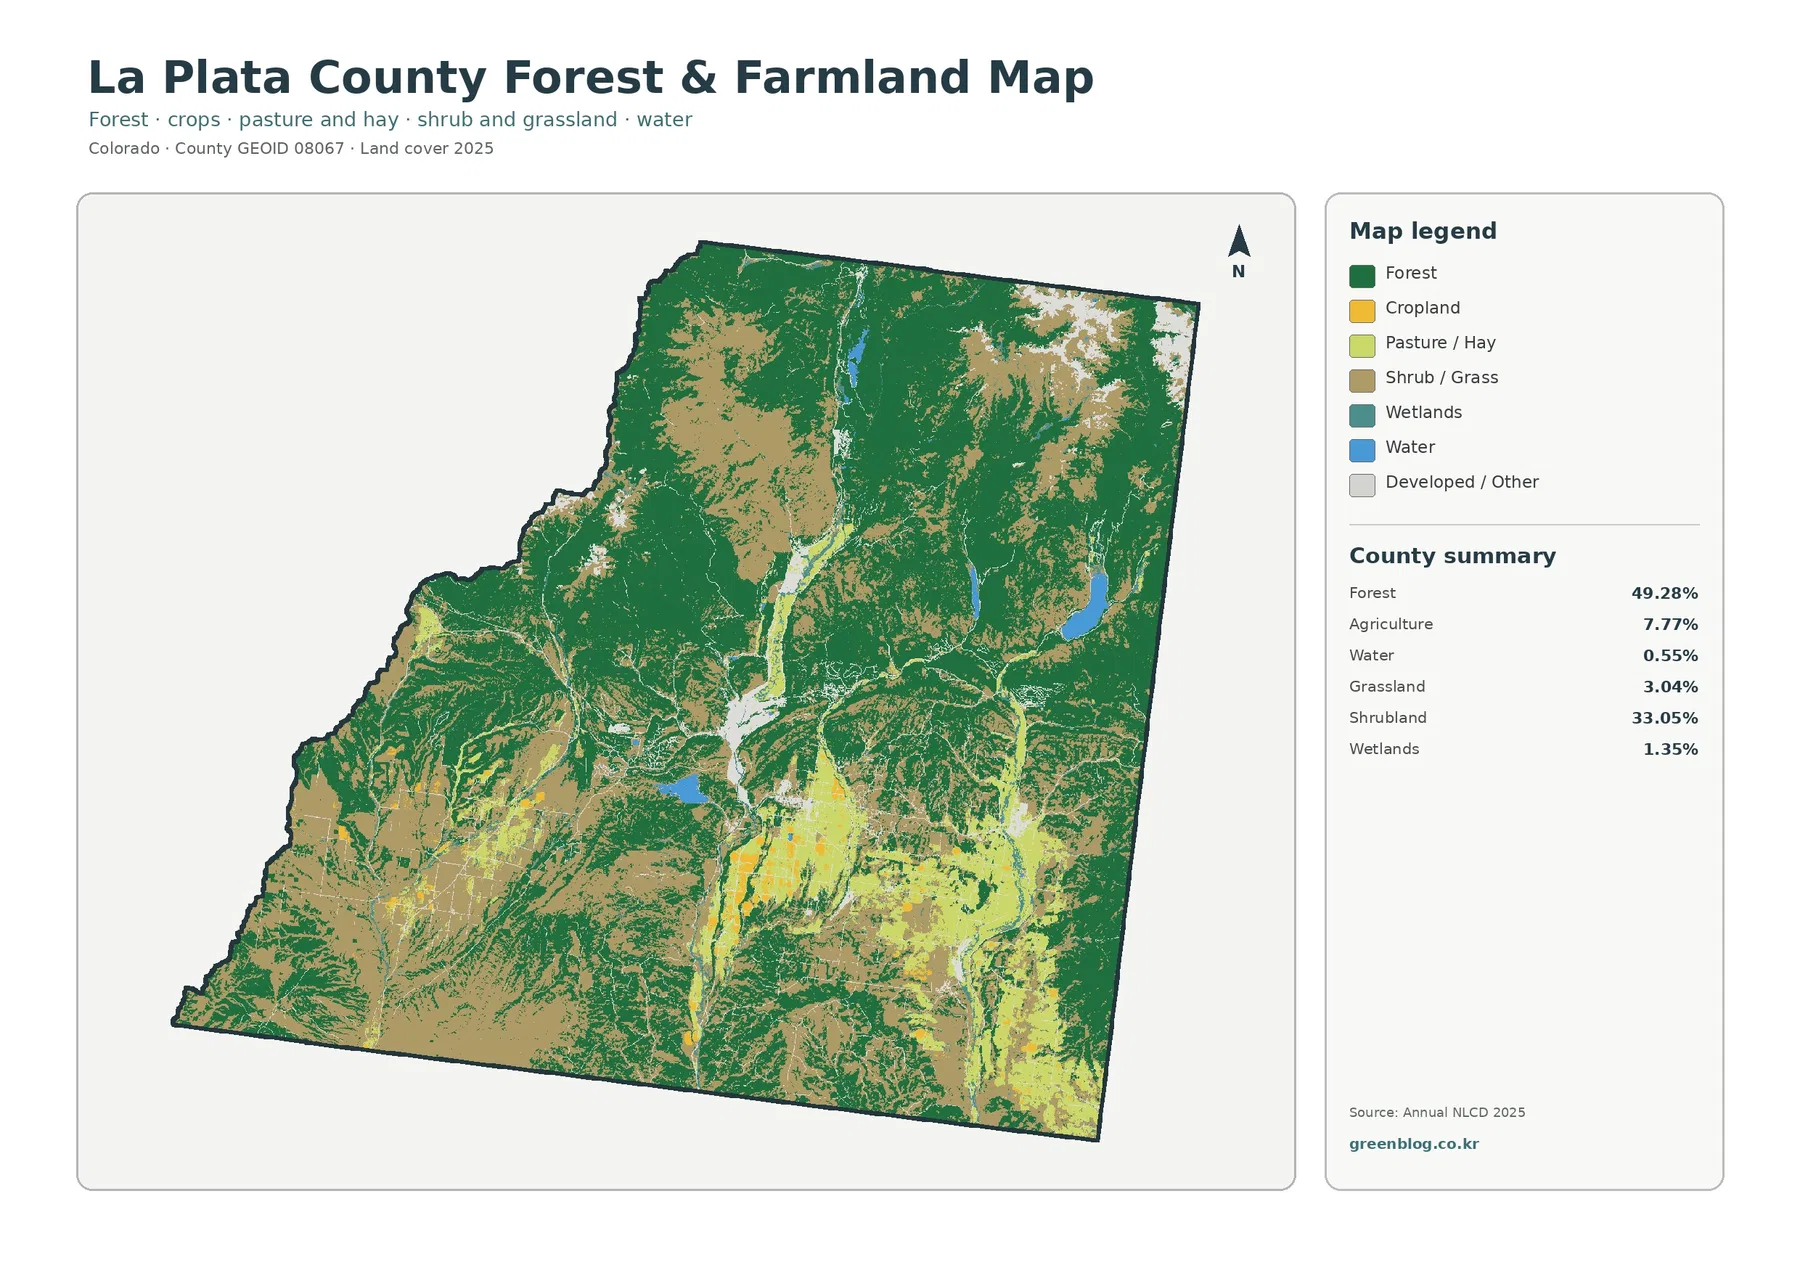
The forest-and-farmland map simplifies several classes so the contrast between wooded mountains and open agricultural areas is easier to follow. Forest still leads at 49.28%, but the 7.77% agricultural share becomes more prominent because crop and pasture-related colors are separated from the broad forest background. Much of that open agricultural cover appears in the south and southeast, with additional narrow areas extending through valleys and openings between forested slopes.
In the south-central and southeastern parts of La Plata County, agricultural colors form patches large enough to stand out at the county scale. Farther west, shrub and grass classes occupy more of the open ground, so agricultural areas are mixed with a different surrounding cover than they are in the forest-heavy north. This uneven distribution is important: the county is not simply “half forest and half open land.” The type of open ground changes from place to place.
La Plata County has also published material on the long history and continuing diversity of local agriculture, including examples from the Animas Valley. That information provides useful context for the mapped agricultural patches, but the land-cover layer does not identify individual farms or management practices. A yellow or pasture-colored cell only indicates a surface classification at the mapping date; it should not be read as a farm census or a statement about ownership.
Water covers 0.55% and wetlands 1.35% in the map summary. Those are small shares, yet several blue water bodies are visible within the forested terrain and smaller wetland features appear as narrow strips or patches. The simplified map makes it easier to see how water and wet areas interrupt the surrounding forest, shrubland, and agricultural cover without having to sort through the full general legend.
A 0.84% mean impervious value reveals how concentrated hard surfaces are
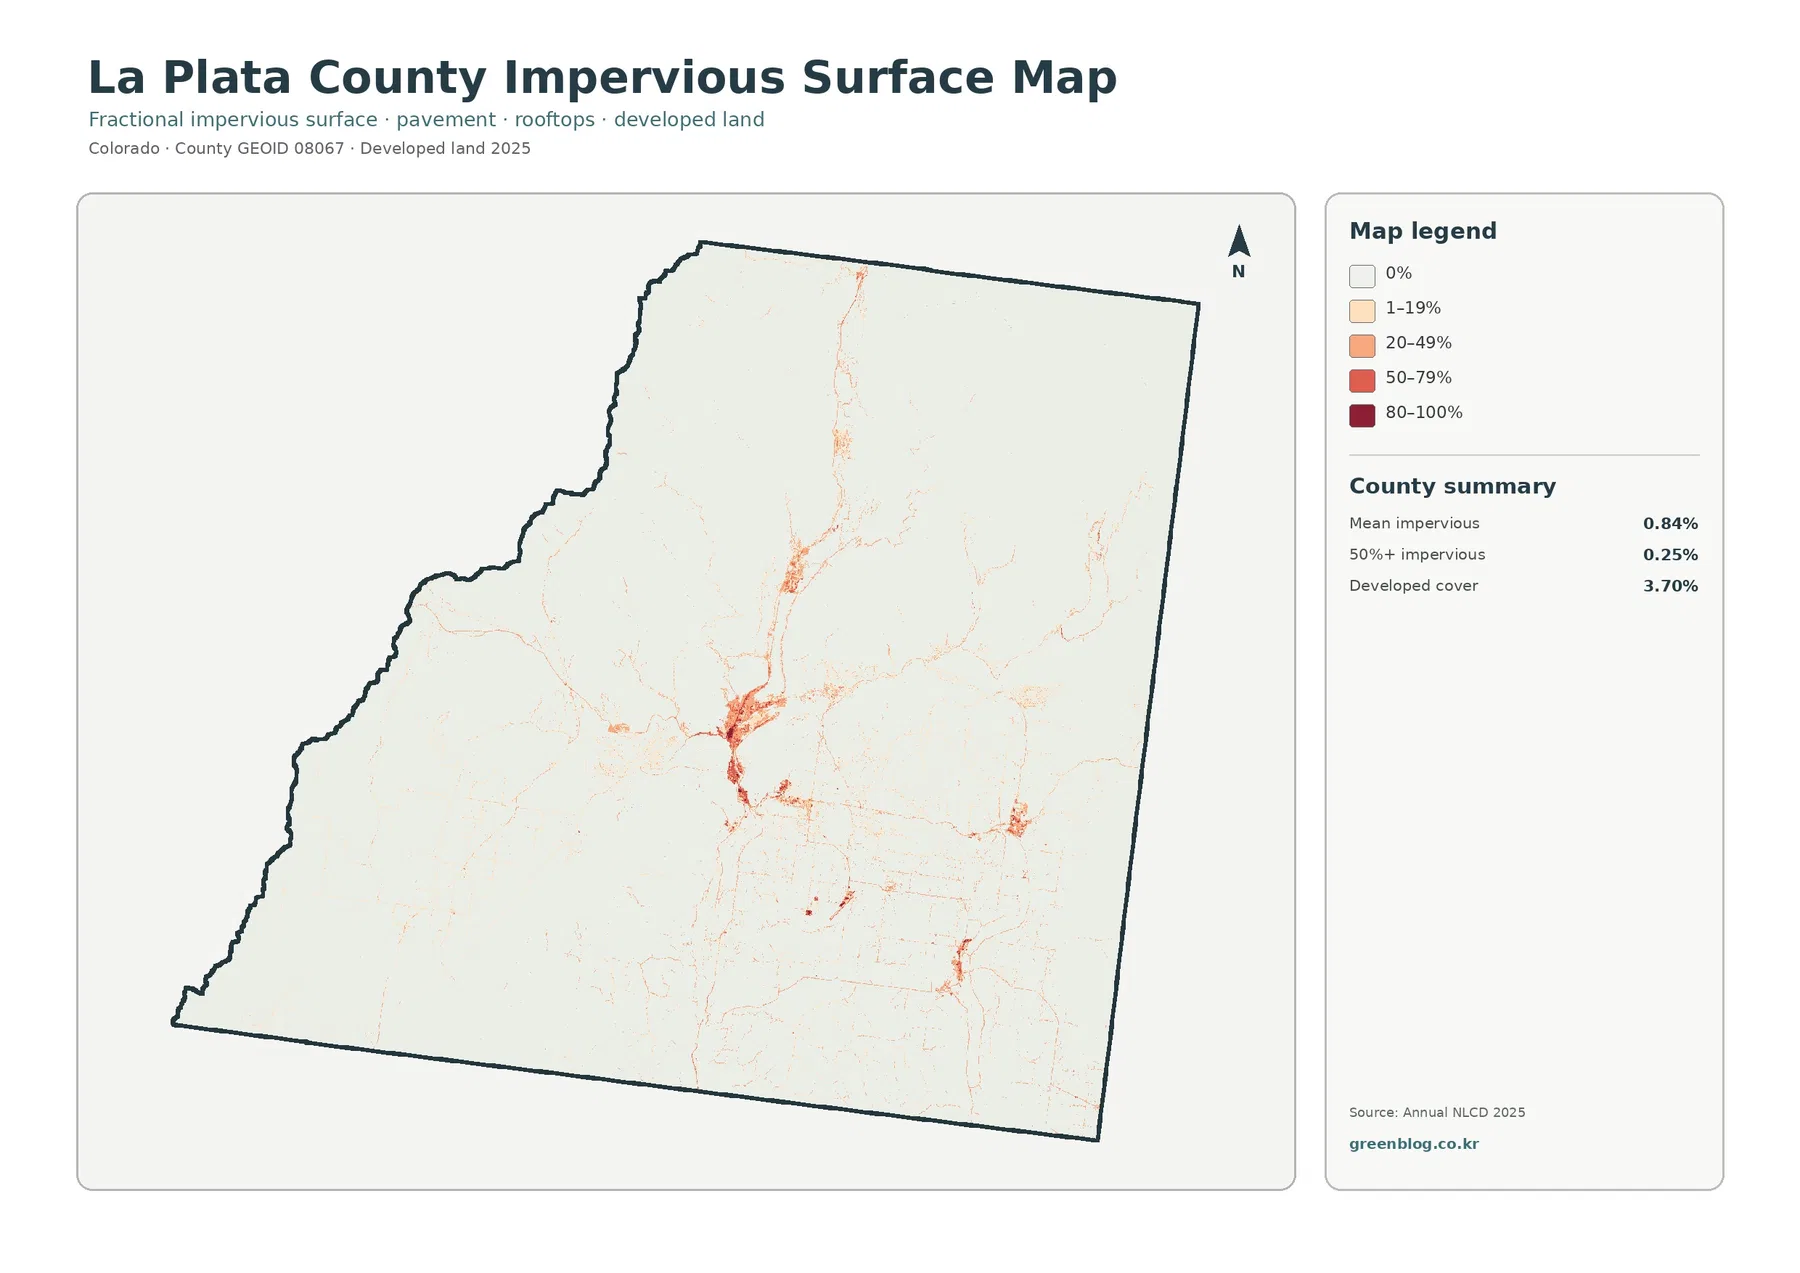
The impervious-surface map strips away most land-cover colors and focuses on surfaces such as pavement and rooftops that do not readily absorb water. La Plata County has a mean impervious value of 0.84%, and only 0.25% of the county is mapped at 50% impervious or higher. Those numbers are much smaller than the 3.70% developed-cover figure because a developed land-cover class can still contain lawns, trees, soil, and other permeable surfaces.
Durango is the most obvious concentration on this map. A compact dark cluster appears in the central portion of the county, with thinner lines extending along transportation and settlement corridors. Smaller high-value spots occur farther east and southeast. By comparison, the western and northeastern forest and shrub areas are nearly blank at this scale, showing how little strongly impervious surface is present across most of the county.
This map is especially useful when the question concerns built surface rather than simply “developed land.” A road corridor may be narrow but highly impervious, while a low-density developed area can include substantial vegetation and therefore show a lower impervious percentage. Reading the impervious map beside the general land-cover map helps prevent those two ideas from being treated as interchangeable.
Impervious cover can be relevant to runoff and watershed studies because water behaves differently on pavement and rooftops than on forest soil or grass. Even so, this layer does not calculate flood risk or runoff volume. Slope, soil, drainage systems, precipitation, and channel conditions also matter. The map should be used as one surface indicator, not as a substitute for hydrologic or engineering analysis.
The 1985–2025 comparison contains widespread forest-class differences
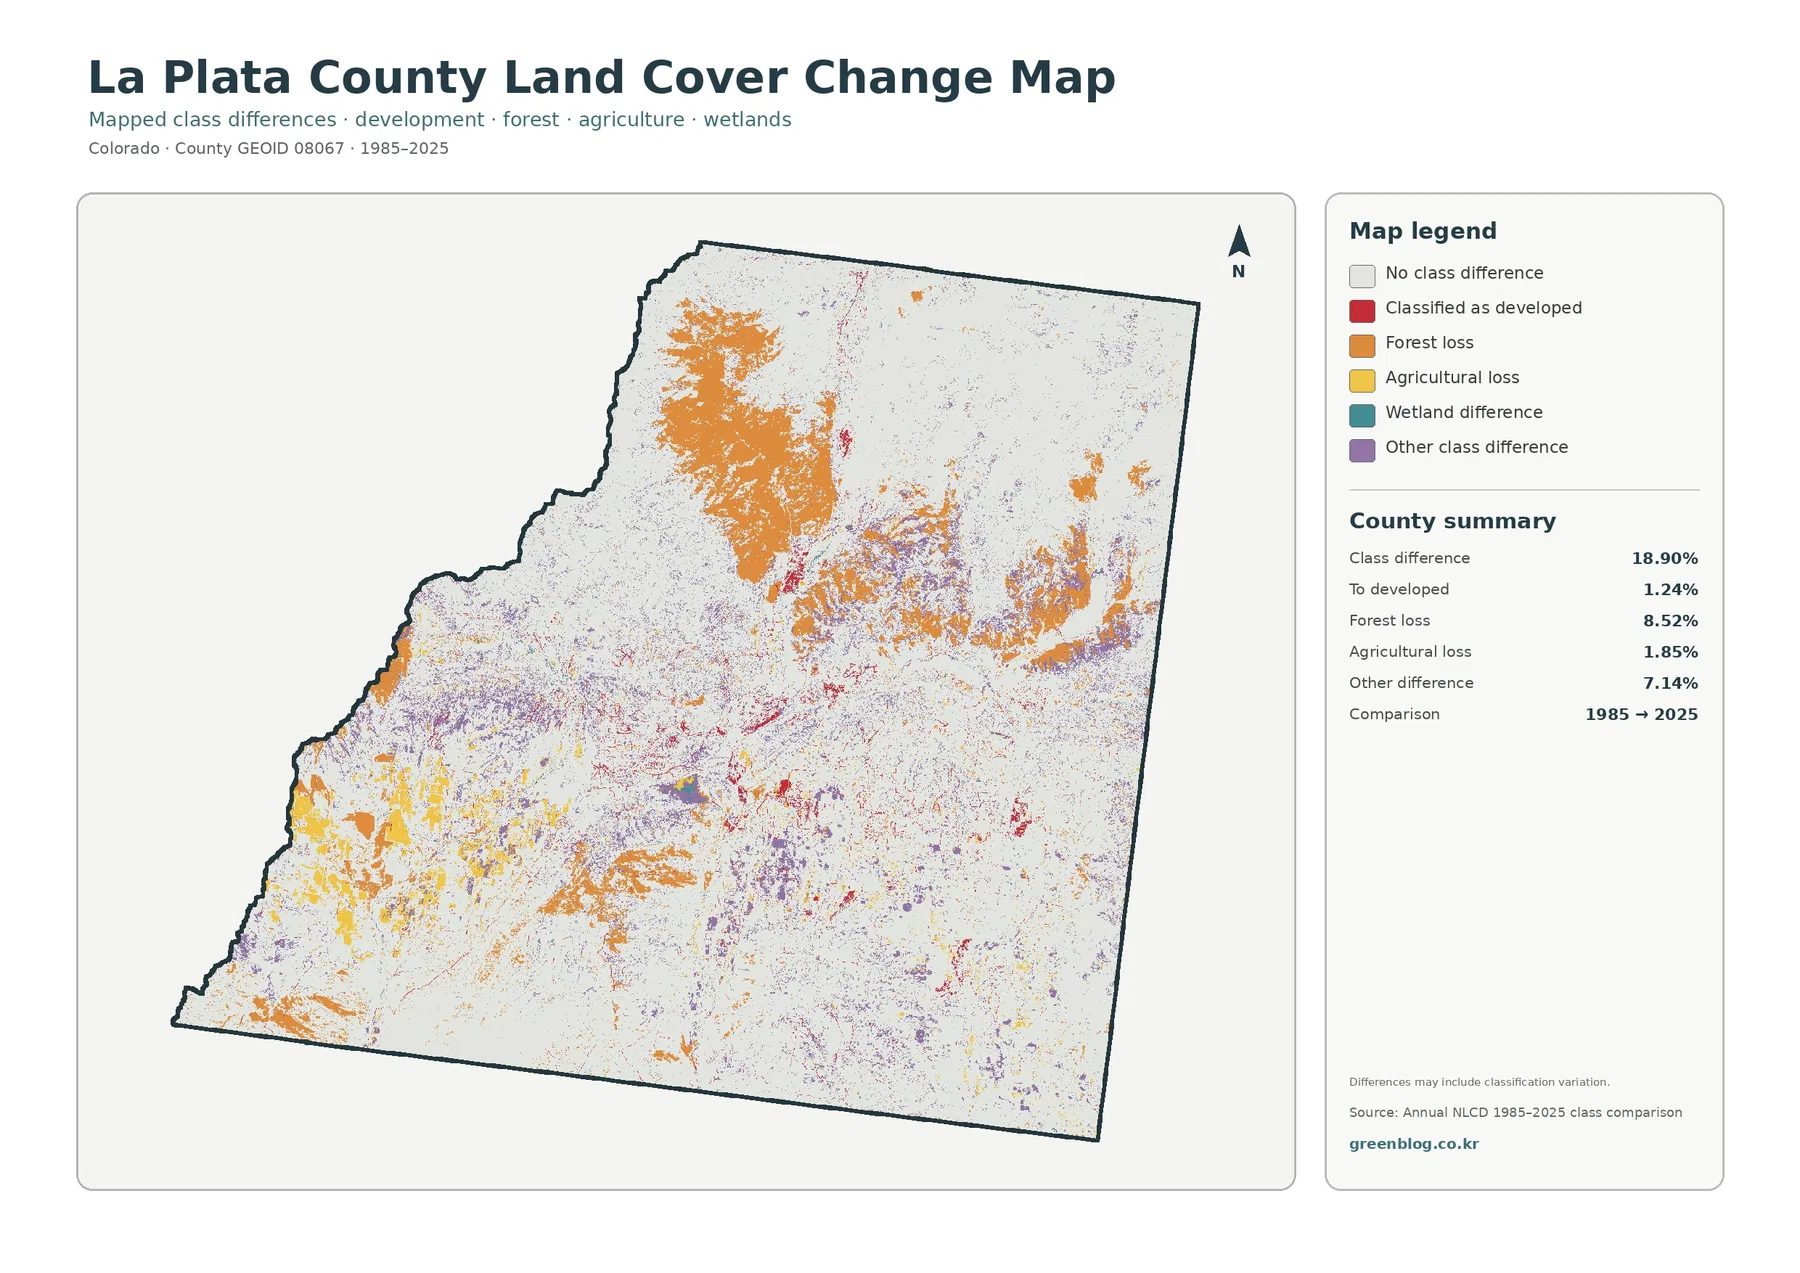
The change map compares the 1985 and 2025 classifications rather than showing current cover alone. The county summary reports a class difference across 18.90% of the mapped area. Forest loss is the largest named category at 8.52%, followed by other class differences at 7.14%, agricultural loss at 1.85%, and areas classified to developed at 1.24%. The broad pale background represents locations with no class difference between the two comparison dates.
Orange forest-loss pixels form large irregular patches in the northwestern and north-central parts of the county and also appear across eastern mountain areas. They are not limited to the edge of Durango or to one development corridor. Red developed-change pixels are much more localized around existing settlement patterns, while yellow agricultural-loss areas appear in parts of the south and southwest. Purple “other difference” pixels are scattered across many parts of the county.
The 8.52% forest-loss category should not be translated directly into a statement that exactly 8.52% of the county was physically deforested. The map compares classifications, and its own note warns that differences may include classification variation. Real forest change can be part of the result, but sensor differences, mixed pixels, changes in canopy condition, or classification methods can also affect the mapped category. A cause such as fire, logging, insects, or development requires additional evidence.
The same caution applies to the 1.24% classified-to-developed value. It marks cells whose classification moved toward developed cover between the two selected dates. It does not provide a year-by-year construction history and does not identify a particular subdivision or road project. For a detailed growth history, aerial imagery and planning records would need to be checked alongside the change layer.
Small water and wetland shares still help explain the landscape
Water makes up 0.55% of the 2025 summary and wetlands account for 1.35%. Those percentages are small beside forest and shrubland, but location is more informative than area alone. Several blue water features remain visible even at the county scale, and wetland colors appear in narrow or patchy forms near water and valley bottoms. These features break up otherwise extensive forest, shrub, or agricultural cover.
In the northern and eastern portions, water features sit within heavily forested terrain. Central and southern sections contain narrower drainage-related patterns mixed with development or agriculture. Looking at these features beside the forest-and-farmland layer helps show where open land, wooded slopes, and wet surfaces meet without requiring a separate stream or watershed legend.
The land-cover water class is not a complete hydrography map. Narrow streams may be smaller than the raster cell size and can be mixed with adjacent vegetation. Seasonal water levels can also change what is visible at a particular observation date. A reader who needs named streams, discharge, floodplain boundaries, or water quality should use dedicated hydrology datasets. On these maps, water and wetlands are best treated as part of the broader surface-cover pattern.
A useful way to compare the four maps without mixing their meanings
Start with the general land-cover map when you need an overall view. It keeps forest, shrubland, agriculture, developed land, grassland, water, wetlands, and barren surfaces in one legend. That makes it the best map for deciding which part of the county deserves closer attention. The forest-and-farmland view is a logical second step when the question shifts to wooded terrain, open grazing or shrub areas, and agricultural patches.
For Durango and other settled areas, the impervious map adds a different type of detail. The general map identifies developed cover, while the impervious layer shows where hard surfaces are most concentrated inside and along those developed areas. Moving to the change map after that reveals which cells were classified differently in 1985 and 2025. Current land cover, hard-surface intensity, and two-date change are therefore three separate measurements of the same location.
In the forested north and east, a different pairing can be more useful. The current land-cover map establishes where forest remains dominant, and the change map highlights the orange forest-loss category within some of those broader mountain areas. That comparison can identify places for a closer look, but it cannot determine whether a mapped difference came from wildfire, harvest, vegetation condition, classification variation, or another process.
Agricultural areas in the south can be reviewed with the forest-and-farmland and change maps together. Current crop and pasture-related cover can be compared with the agricultural-loss category, but a different classification does not automatically mean a legal conversion out of agriculture. Crop cycles, fallow periods, pasture condition, and mixed pixels can all change the way a raster cell is classified.
Choosing a map for print, teaching, or local reference
For a single printed county reference, the general land-cover map is usually the most informative choice because it preserves the full range of visible classes. Add the forest-and-farmland map when the audience needs to focus on the contrast between wooded mountains and southern agricultural areas. Use the impervious map for a discussion of towns, roads, and built surface. Reserve the change map for questions that specifically involve the 1985 and 2025 comparison.
In a classroom, the percentages provide a clear starting point. Students can compare forest at 49.28% with shrubland at 33.05%, then locate the much smaller 7.77% agricultural and 3.70% developed classes. The next comparison—3.70% developed cover versus a 0.84% mean impervious value—helps explain why a developed classification and hard-surface percentage are related but not identical.
Water and wetlands can be added as a second exercise. Their countywide shares, 0.55% and 1.35%, look minor in a table but become more meaningful when students find the actual blue and wetland features among forest, shrubland, and agricultural areas. This is a good example of why area percentage and geographic position answer different questions.
For planning context, these maps work best at the reconnaissance stage. They can show whether a general location lies in a forested setting, near a developed corridor, or close to mapped agriculture or wetland cover. They cannot establish parcel boundaries, zoning, ownership, or development rights. Formal decisions should rely on La Plata County and municipal planning documents and other authoritative local records.
Classification date, raster cells, and scale limits
Annual NLCD products represent the landscape as raster cells rather than surveyed parcels. One cell can contain more than one real-world feature, creating what is often called a mixed pixel. A narrow road, stream, small building, forest edge, or field boundary may therefore be generalized or combined with the surrounding class. Straight or sharp map boundaries should not be assumed to match legal property lines.
The current land-cover and impervious maps describe the 2025 classification. Construction, vegetation change, forest recovery, agricultural shifts, or other changes after that observation period may not appear. The change map compares 1985 with 2025, but it does not show every year in between. A two-date comparison can identify a different classification without explaining the full sequence that produced it.
Scale also matters. At a small thumbnail size, narrow roads, small wetlands, and minor water features can disappear. On the change map, scattered single-cell differences can make the surface look more complicated than the broad landscape actually is. A practical reading method is to identify the large countywide pattern first, then zoom into an area of interest, and finally compare it with aerial imagery or local records if the question requires site-level detail.
With those limits in mind, the four-map set gives a consistent picture of La Plata County. Forest and shrubland dominate most of the county; agriculture is concentrated in selected southern and valley settings; hard surfaces cluster around Durango and other settled corridors; and the 1985–2025 comparison contains broad forest and other class differences. Those relationships are the main value of the maps and a useful starting point for more detailed study.
Map File Information
The download ZIP contains the four original JPG maps discussed on this page. Use them when you need files larger than the web previews for printing, classroom materials, presentations, or personal reference.
- Included maps: land cover, forest & farmland, impervious/developed land, and land cover change
- Format: one ZIP containing four JPG files
- Coverage: La Plata County, Colorado
Frequently Asked Questions
What is the dominant land cover in La Plata County?
Forest is the largest 2025 class at 49.28%, followed by shrubland at 33.05%. Together they cover more than four-fifths of the mapped county, which is why wooded and shrub-dominated terrain defines the overall appearance more strongly than agriculture or development.
Which map is best for examining development around Durango?
The general land-cover map is best for seeing development in relation to surrounding forest, shrubland, and agriculture. The impervious-surface map is better for locating concentrated pavement and rooftops. Used together, they also show why 3.70% developed cover and a 0.84% mean impervious value are not the same measurement.
Does the 8.52% forest-loss category mean 8.52% of the county was definitely deforested?
No. It is a classification difference between 1985 and 2025. Real forest change may contribute, but classification variation, mixed pixels, and changes in vegetation condition can also affect the result. A specific cause such as fire, logging, or development requires additional evidence.
Map File Information
Download the map files associated with this page for reference, printing, and compatible visual projects.
- Included Files: Use only the versions confirmed in the article and supplied images
- File Type: Use the confirmed download contents
- Intended Use: Printing, education, presentations, and map-based projects
Related Maps
- Adams County Colorado Land Cover Map
- Alamosa County Colorado Land Cover Map
- Arapahoe County Colorado Land Cover Map
Sources and References
- MRLC Annual NLCD Data – land-cover and impervious-surface products
- USGS Annual NLCD Land Cover Classification – definitions and interpretation of land-cover classes
- U.S. Census Bureau TIGER/Line Shapefiles – county boundary data
- La Plata County 2022 Annual Comprehensive Financial Report – county profile and municipalities including Durango, Bayfield, and Ignacio
- La Plata County Connections – Agriculture in La Plata County – local agriculture and Animas Valley context
Green Map creates custom-edited map images using open geographic data sources such as geoBoundaries, Natural Earth, OpenStreetMap, and government open data.
These maps are edited visual materials, not raw data files, and are provided for education, documents, presentations, and graphic reference.