Kit Carson County sits on Colorado’s eastern plains, where cropland and grassland fill almost the entire county while developed land stays concentrated in small towns and along the Interstate 70 corridor. The four maps on this page separate that broad pattern into current land cover, forest and farmland, impervious surface, and mapped class differences between 1985 and 2025.
The original four JPG maps are available together in one download near the end of the page. They are useful when you need a printable county reference, want to compare Burlington with the surrounding farm-and-grassland landscape, or need to see how the I-70 corridor stands out from the much less developed countryside.
Table of Contents
A county where cropland and grassland dominate the view
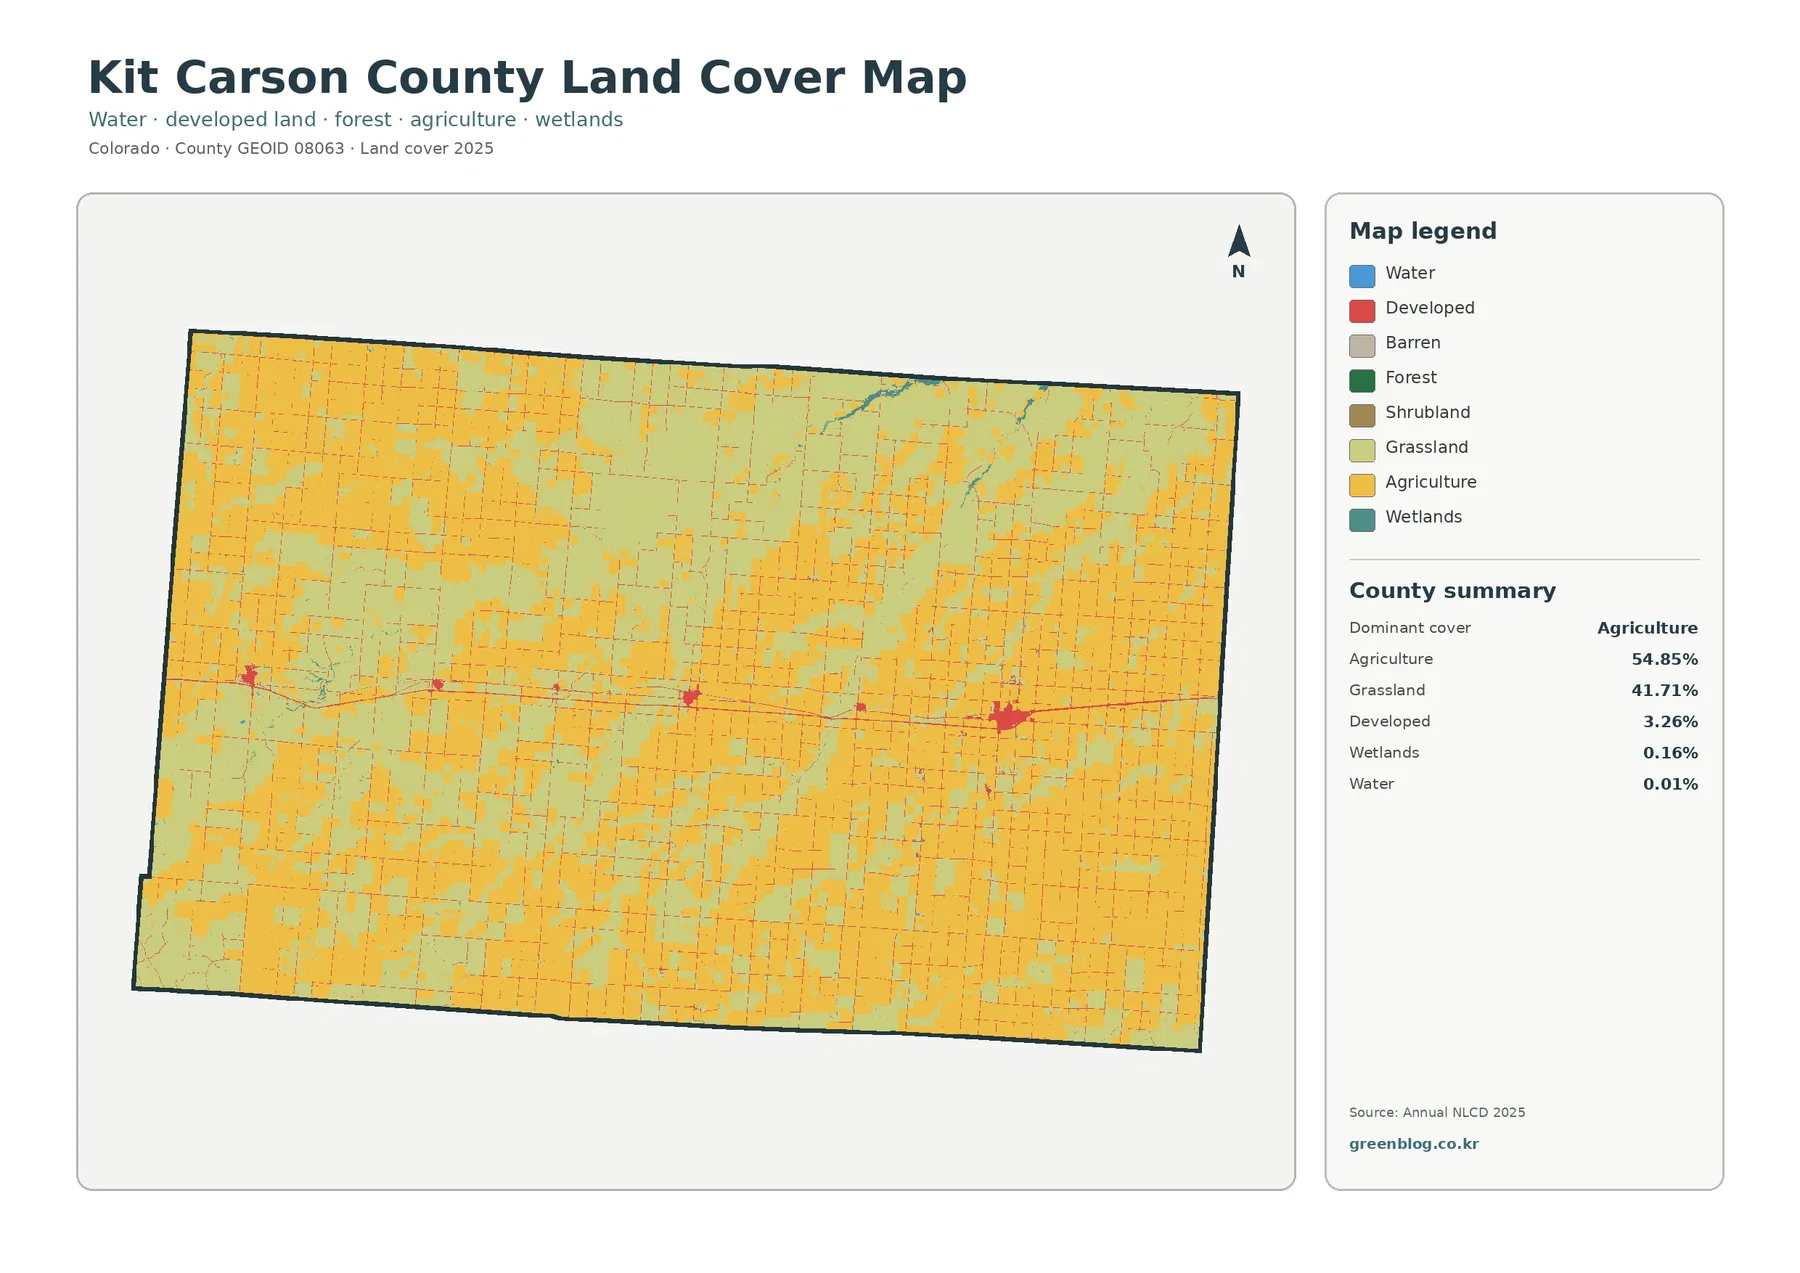
The 2025 land-cover summary makes the main pattern unusually clear. Agriculture accounts for 54.85% of the mapped county and grassland adds another 41.71%. Together they cover more than 96% of the area, leaving only small shares for developed land, wetlands, and water. That balance is visible before you even read the legend: yellow agricultural blocks and pale green grassland spread from the western boundary to the Kansas side with no large forest belt interrupting them.
Cropland does not form one continuous zone. It appears as a patchwork of rectangular and irregular fields mixed with larger grassland areas. The eastern and southeastern parts of the county contain many closely spaced agricultural blocks, while broad grassland patches remain visible through the north-central and western portions. The result is a working-plains landscape in which the two dominant covers repeatedly meet rather than occupying separate halves of the county.
That map pattern also fits the county’s own description of its economy and location. Kit Carson County’s official website places the county on the I-70 corridor in east-central Colorado near Kansas and identifies livestock, wheat, and corn as important parts of the local agricultural economy. The land-cover map does not identify individual crops or ranch ownership, but the large agricultural share provides useful landscape context for those county-level facts.
The I-70 corridor is the clearest developed feature
Developed land covers 3.26% of the county, so it is minor by area but easy to locate. A thin developed line runs east-west through the middle of the county, connecting several compact settlement clusters. Burlington forms the strongest concentration toward the eastern side. Smaller developed points continue westward along the same general corridor near Bethune, Stratton, and Seibert, while most land away from that route returns quickly to agriculture or grassland.
Colorado Department of Transportation project pages confirm the transportation context behind the visible corridor. CDOT identifies I-70 projects around Burlington and Bethune and another segment around Seibert and Stratton. The map and the transportation record therefore point to the same east-west band as a major local corridor. That is a spatial association, not proof that the highway caused every nearby development patch, so the map should be used to describe concentration rather than cause.
Outside that band, developed pixels become sparse. There are scattered roads, farmsteads, and small built surfaces across the county, but they do not create a broad urban footprint. This difference is important when comparing Kit Carson County with more urban Colorado counties: here the developed class works more like a narrow network threaded through an agricultural landscape than a large continuous city region.
Why the forest-and-farmland view is mostly about fields and open range
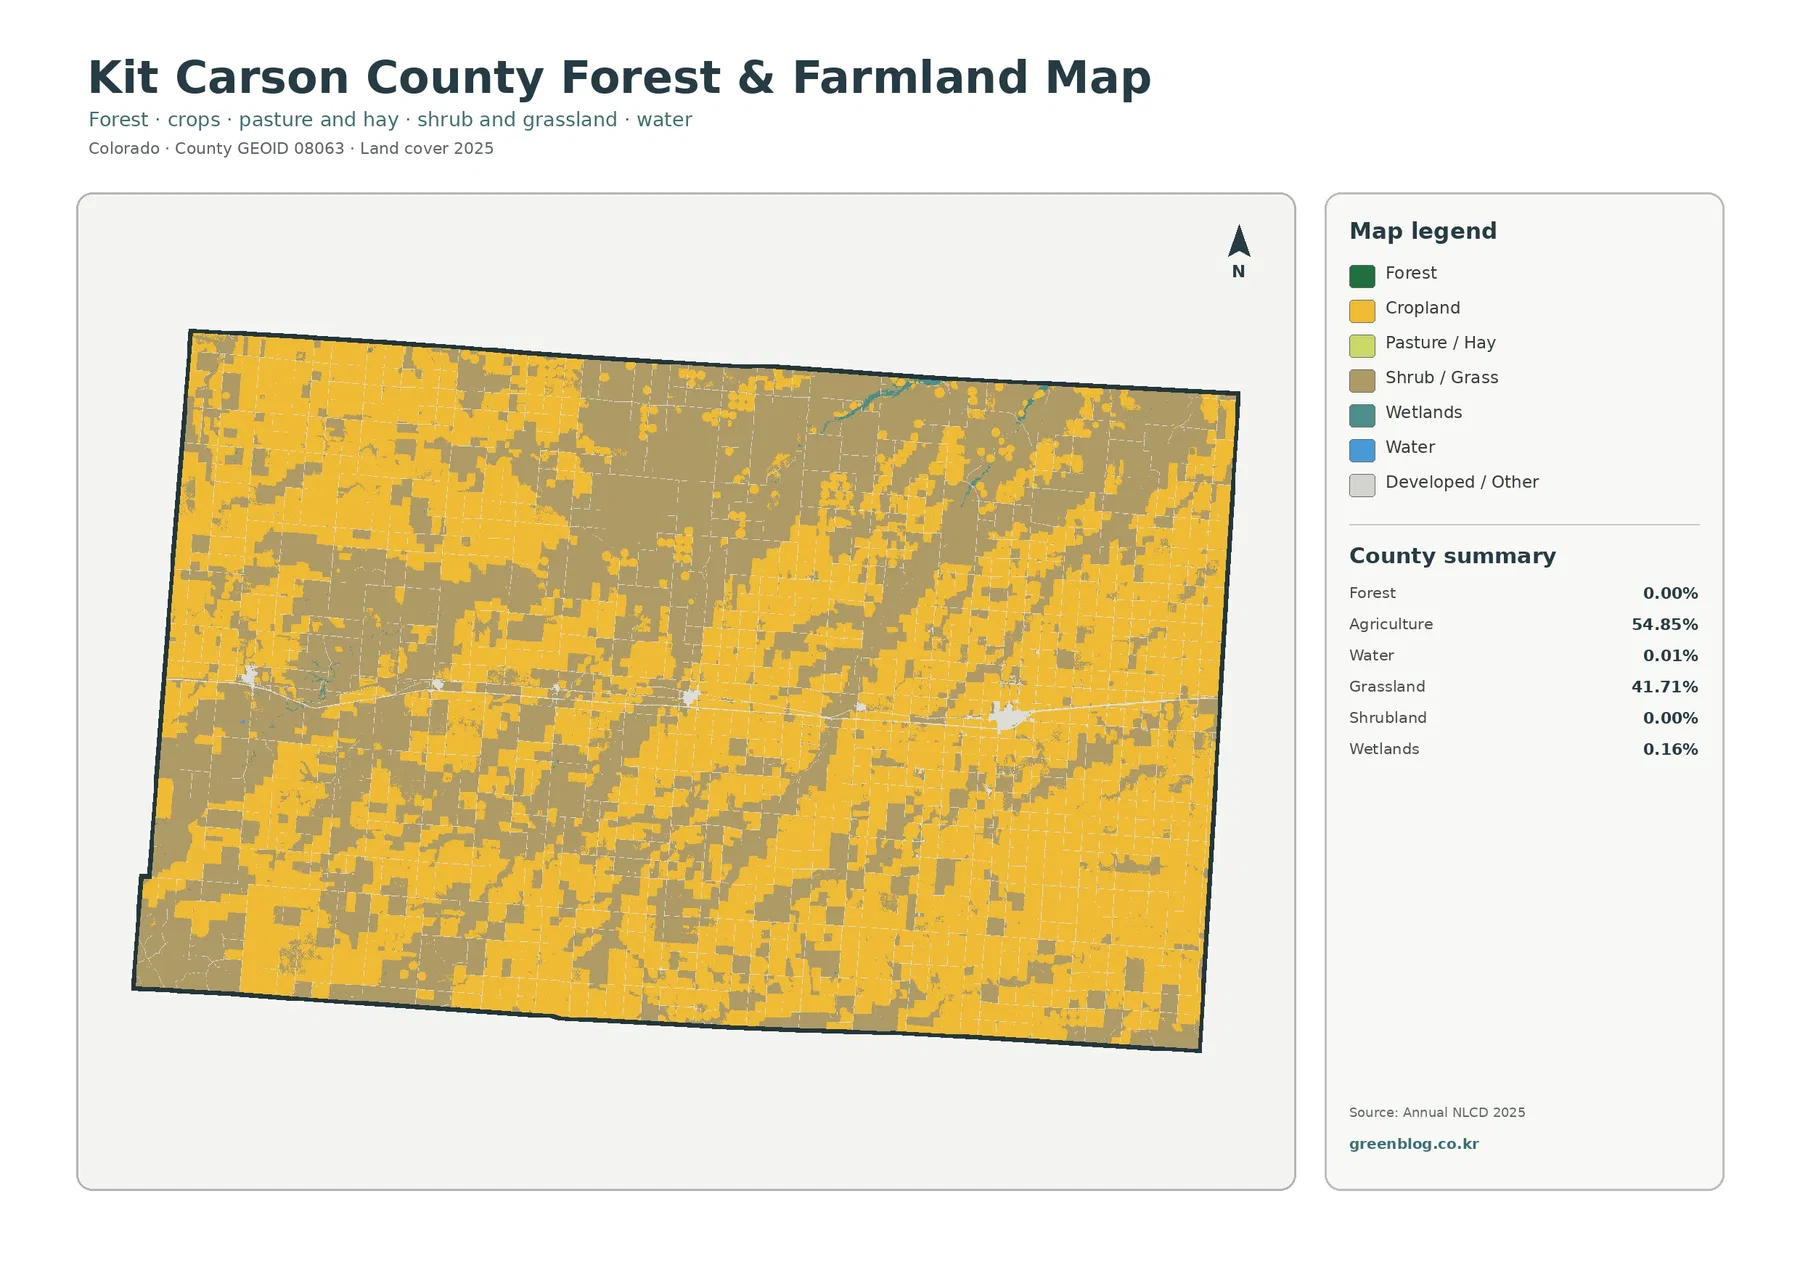
The forest-and-farmland map simplifies the land-cover classes to make agricultural and open-land differences easier to see. Its county summary lists forest at 0.00% and shrubland at 0.00%, while agriculture remains 54.85% and grassland 41.71%. In a mountain county, this kind of map might be used to compare woodland against fields. In Kit Carson County, the useful comparison is instead between cultivated blocks and the extensive grassland around and between them.
Large yellow field blocks appear throughout the county, but their spacing changes from place to place. The eastern half contains many dense agricultural patches, especially toward the southeast, while grassland forms larger connected areas in portions of the west and north-central interior. Elsewhere the two classes create a fine checkerboard. This map is especially helpful for seeing those transitions because the small developed and other classes are visually reduced.
The categories should not be confused with legal land use. A pixel classified as agriculture does not tell you the owner, zoning, crop type, irrigation status, or whether a parcel can be developed. Likewise, grassland is a surface-cover category rather than a statement about public access or grazing rights. The map classifies what the surface looked like to the underlying dataset at the observation date.
Impervious surface isolates the built-up places from the plains
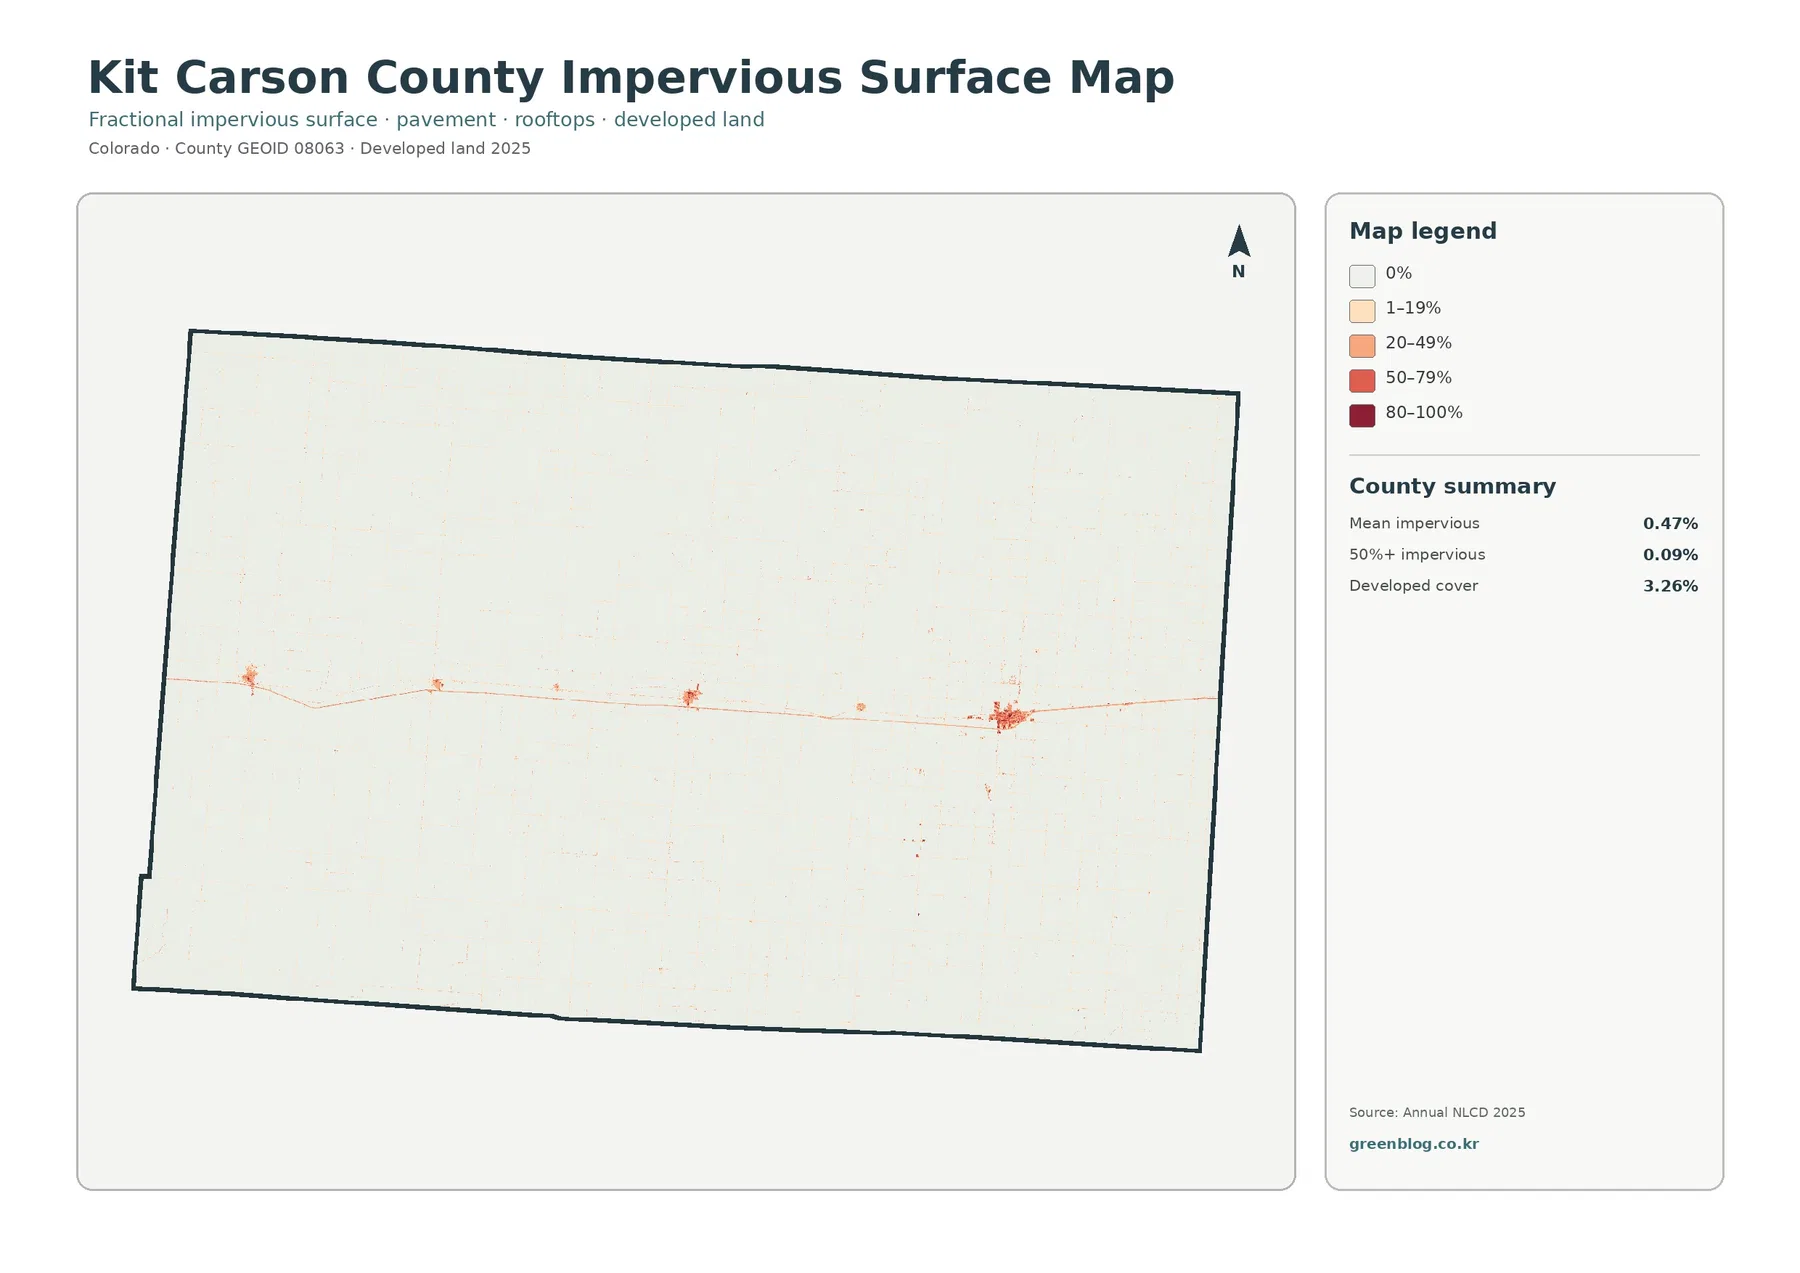
The impervious-surface map strips away most land-cover detail and focuses on surfaces that shed water rather than letting it soak in easily, such as pavement and rooftops. Kit Carson County’s mean impervious value is only 0.47%, and just 0.09% of the county is mapped at 50% or more impervious. That low countywide average makes the settlement pattern stand out sharply because almost everything away from towns and major roads appears very light.
Burlington is again the most visible cluster. The east-west road corridor can be followed from there across the county, with smaller spots appearing around the other I-70 communities. North and south of that band, high-impervious pixels are much less common. The contrast gives a simple picture of how compact the built footprint is compared with the surrounding farms and grasslands.
Impervious surface and developed land are related but not identical measures. The 3.26% developed-cover figure includes broader developed land classes, while the impervious product estimates the share of a surface occupied by hard materials. A lightly developed location can therefore be mapped as developed even though only a modest part of the pixel is actually pavement or roof. Looking at both maps prevents those concepts from being treated as the same statistic.
A low impervious percentage also does not mean runoff or drainage concerns are absent. Soil properties, rainfall intensity, roadside ditches, stream channels, and local grading all matter. This map is best used as one layer of context for built surfaces, not as a flood-risk map or a parcel-level engineering survey.
What changed between the 1985 and 2025 classifications
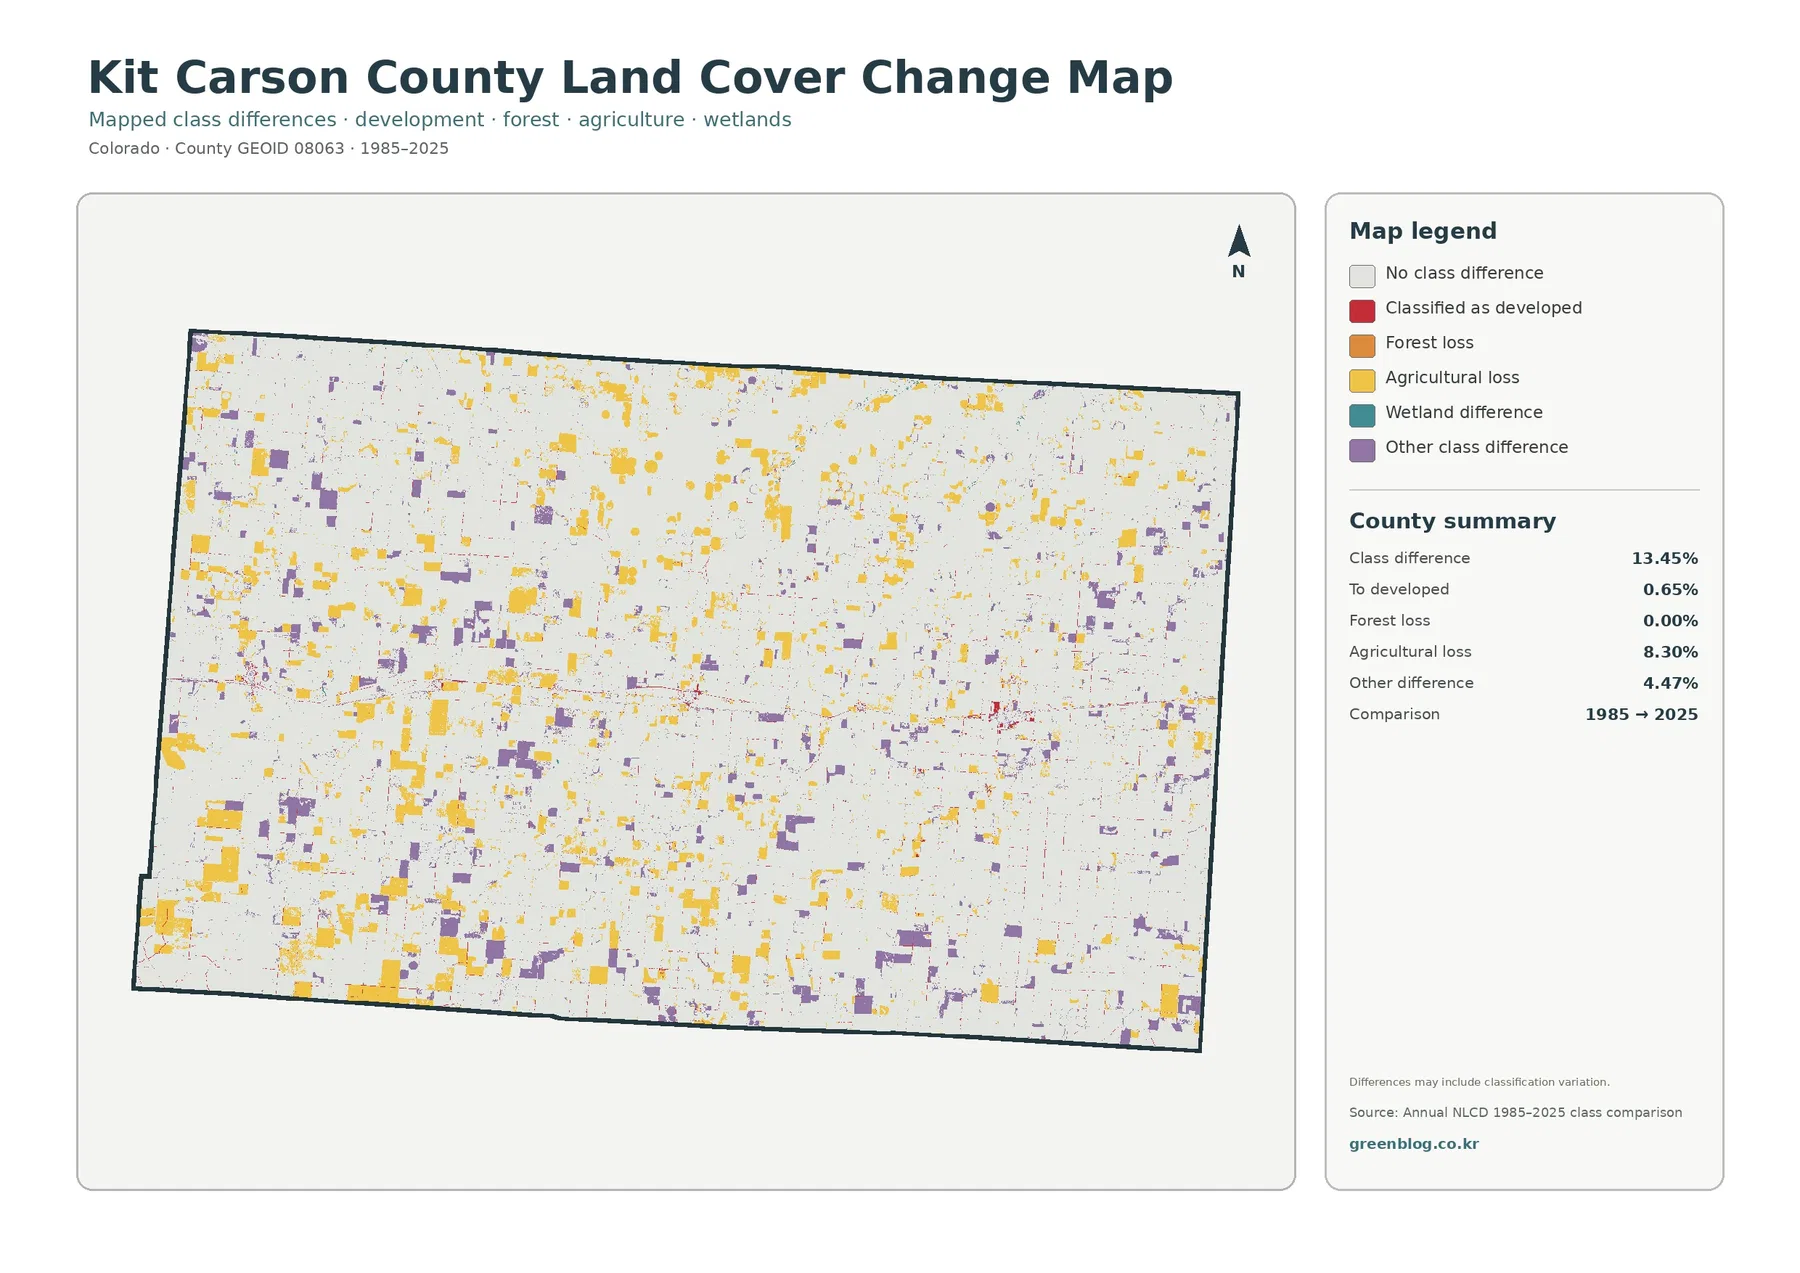
The change map compares the 1985 and 2025 classifications rather than showing a single-date landscape. Its summary reports class differences across 13.45% of the county. Agricultural loss is the largest named category at 8.30%, other class differences account for 4.47%, and pixels classified as developed add 0.65%. Forest loss is listed at 0.00%. Most of the county remains white, indicating no mapped class difference between the two comparison years.
The yellow agricultural-loss patches are scattered widely instead of forming one single front. They appear in the western and southwestern parts of the county, across northern sections, and in smaller blocks elsewhere. Purple “other class difference” patches are also dispersed through the agricultural and grassland matrix. Red developed-change pixels are much less extensive and are easier to notice near the established east-west settlement corridor.
It would be misleading to read the 8.30% agricultural-loss value as a direct statement that the county permanently lost exactly that share of farmland. The product compares classified raster cells at two dates. A changed cell can reflect actual land-cover change, but agricultural cycles, fallow conditions, mixed pixels, or classification differences can also affect the result. The map itself notes that differences may include classification variation.
For that reason, the change map is strongest as a screening tool. It can show where to look more closely, especially where large blocks of agricultural-loss or other-change pixels appear. Confirming why a specific parcel changed would require time-series imagery, agricultural records, property information, or another local source rather than the color on this map alone.
Water and wetlands occupy little area but still matter on the map
Water covers only 0.01% of the 2025 map summary and wetlands account for 0.16%. Those values are so small that blue and teal features can disappear when the map is viewed at thumbnail size. At closer scale, thin drainage features and small wetland patches are visible in parts of the north and northeast. They are minor in area but useful for understanding where the otherwise dry-looking farm-and-grassland pattern is interrupted.
The mapped water class should not be treated as a complete stream inventory. Narrow channels can be smaller than the raster cells used by the land-cover product, and seasonal water may not appear the same way at every observation date. If the purpose is to trace named streams, determine flow, or evaluate flood conditions, a dedicated hydrography or flood dataset is more appropriate. Here, water and wetlands are best read as land-cover features within the broader county pattern.
Reading the four maps as one county story
The general land-cover map provides the quickest overall picture because it keeps the main classes together. Start there to see how thoroughly agriculture and grassland dominate. Move to the forest-and-farmland map when the goal is to compare field blocks with surrounding open grassland. The impervious map then isolates Burlington, the highway corridor, and other built spots. Finally, the change map adds a time comparison that the current-cover maps cannot provide.
Burlington offers a good example of this sequence. On the general map it appears as a developed cluster surrounded by agriculture. On the impervious map, the hard-surface concentration becomes more obvious and the I-70 line is easier to follow. On the change map, a smaller set of developed-change pixels can be compared with the much broader agricultural and other class differences around the county. Each map answers a different part of the same location question without needing to force all information into one legend.
Rural sections work differently. In places far from the interstate, the impervious map may show almost nothing, while the forest-and-farmland view contains the most useful detail. Pairing that current agricultural pattern with the change map makes it easier to find blocks where the classification differed between 1985 and 2025. The combination is useful for classroom comparison, landscape review, and deciding where a more detailed investigation should begin.
Practical uses for printing, teaching, and local reference
For a printed county reference, the general map is usually the best first page because the legend includes water, developed land, barren land, forest, shrubland, grassland, agriculture, and wetlands. A second page can then be chosen according to the task. Agricultural discussions benefit from the simplified farmland view, while transportation or settlement discussions are clearer with the impervious map. The change map works best when the audience already understands the current landscape and is ready to compare dates.
In a classroom, the summary percentages create a straightforward exercise. Students can begin with agriculture at 54.85% and grassland at 41.71%, locate the much smaller 3.26% developed class, and then compare that figure with the 0.47% mean impervious value. That comparison makes it easier to explain why “developed land” and “hard surface” are not interchangeable terms. The 1985–2025 change map can then introduce the difference between a classified change and a confirmed land-use decision.
For local planning context, the maps are useful at the reconnaissance stage rather than the permitting stage. Kit Carson County maintains a separate Land Use department and land-use code for formal decisions involving property and development. A land-cover raster does not replace those records. It can, however, help a reader quickly understand whether a site lies within a broad agricultural setting, near a developed corridor, or close to a mapped wetland or water feature before consulting more detailed official material.
Scale, classification, and date limits to keep in mind
Annual NLCD products classify the landscape as raster cells rather than surveyed parcels. A cell can contain more than one real-world feature, creating a mixed pixel. Small roads, narrow channels, isolated buildings, and field edges may therefore be generalized or merged with the surrounding class. Straight-looking boundaries on the map should not be assumed to match legal parcel lines.
The current maps describe the 2025 classification, so later construction, crop changes, or surface changes may not be present. The change map compares 1985 with 2025, but it does not show every intermediate year. That distinction matters in an agricultural county because crop cover, fallow land, and grass conditions can change between seasons and years. A two-date difference is evidence of a classification change, not by itself a full history of what happened in between.
Used at the right scale, the four-map set still gives a consistent picture of Kit Carson County. The county is overwhelmingly agricultural and grass-covered, developed land is sparse and tied closely to the I-70 settlement corridor, impervious surface occupies only a very small share, and the long-term comparison contains more agricultural and other class differences than newly developed classification. Those broad relationships are exactly the kind of information these maps are designed to make easy to compare.
Map File Information
The download ZIP contains the four original JPG maps discussed on this page. Use them when you need files larger than the web previews for printing, class materials, presentations, or personal reference.
- Included maps: land cover, forest & farmland, impervious/developed land, and land cover change
- Format: one ZIP containing four JPG files
- Coverage: Kit Carson County, Colorado
Frequently Asked Questions
What is the dominant land cover in Kit Carson County?
Agriculture is the largest 2025 class at 54.85%, followed by grassland at 41.71%. Together they account for more than 96% of the mapped county, which is why the landscape appears overwhelmingly farm-and-grassland rather than forested or urban.
Where is developed land easiest to see?
The clearest developed concentration is around Burlington, with smaller clusters continuing west along the I-70 corridor near other county communities. The impervious-surface map makes this pattern especially easy to see because most of the surrounding countryside has very low impervious values.
Does the 8.30% agricultural-loss category mean farmland permanently shrank by 8.30%?
No. It is a mapped class difference between the 1985 and 2025 classifications. Real land-cover change may be part of that number, but agricultural cycles, mixed pixels, and classification variation can also contribute. Parcel-level conclusions need additional evidence.
Map File Information
Download the map files associated with this page for reference, printing, and compatible visual projects.
- Included Files: Use only the versions confirmed in the article and supplied images
- File Type: Use the confirmed download contents
- Intended Use: Printing, education, presentations, and map-based projects
Related Maps
- Adams County Colorado Land Cover Map
- Alamosa County Colorado Land Cover Map
- Arapahoe County Colorado Land Cover Map
Sources and References
- MRLC Annual NLCD Data – access and documentation for land-cover products
- USGS Annual NLCD Land Cover Classification – explanation of land-cover classes
- Kit Carson County official website – county location, Burlington county seat, and local agricultural context
- Colorado State University Golden Plains Area Extension – Kit Carson County agricultural extension office in Burlington
Green Map creates custom-edited map images using open geographic data sources such as geoBoundaries, Natural Earth, OpenStreetMap, and government open data.
These maps are edited visual materials, not raw data files, and are provided for education, documents, presentations, and graphic reference.